Thirupathi Thippania,
Sudip Mandala,
Guanxiong Wangb,
Vijay K. Ramanib and
R. Kothandaraman*a
aDepartment of Chemistry, IIT Madras, Chennai 600 036, India. E-mail: rkraman@iitm.ac.in; Fax: +91-44-2257-4202
bDepartment of Chemical and Biological Engineering, Illinois Institute of Technology, 10 W. 33rd Street, Chicago, IL 60616, USA
First published on 19th July 2016
Non-precious metal (NPM) catalysts comprising cobalt and N-doped multiwalled carbon nanotubes (N-MWCNTs-Co) were synthesized by the solid-state pyrolysis (SSP) of melamine with Co3O4. N-MWCNTs-Co acts as an electrocatalyst for both the oxygen reduction reaction (ORR) and the oxygen evolution reaction (OER), and hence can be used in secondary metal–air batteries and in unitized regenerative fuel cells. It is important to study the OER and ORR at high concentrations of KOH as most of the metal–air batteries employ KOH concentrations > 4 M. The OER potential of N-MWCNTs-Co at a current density of 10 mA cm−2 was 0.6 V vs. Hg/HgO (corresponding to an overpotential of 0.364 V) in 6 M KOH. The activity towards the ORR of N-MWCNTs-Co at −0.1 V vs. Hg/HgO was 2.7 and 0.2 mA cm−2 in 0.1 M and 6 M KOH respectively. Based on our ORR, OER and impedance studies, we postulate that the non-covalent interactions between the hydrated alkali metal cations and the adsorbed oxygen-based species on the catalyst surface are responsible for the reduction in ORR activity and enhancement in OER activity with increasing KOH concentration. Finally, we provide our initial results using this bifunctional catalyst in a zinc–air battery.
As an alternative to expensive precious metal catalysts, non-precious-metal (NPM) based materials such as perovskites,18–20 cobalt oxide, manganese oxide and its derivatives1,21–23 N-doped carbon nanotubes24 and nitrogen-metal-containing carbon materials (hereafter called MNC) have been proposed and investigated.25 Recently, MNC catalysts have been reported to demonstrate high ORR activity, comparable to that of Pt/C catalysts.26 However, the use of an amorphous, conducting carbon source27 to host the ORR active sites within its micropores dilutes the active site density in the resultant MNC catalyst. To meet the required current density, thicker (>100 μm) MNC-catalyst-based electrodes are required,28 which result in high mass-transfer overpotentials. Moreover, the amorphous carbon support used in Pt-based catalysts has been identified as being prone to corrosion at high potentials, typically seen during transient conditions.29–31 In the case of MNC catalysts, in addition to carbon corrosion, the oxidative decay of the ORR active site by peroxide radicals produced as intermediates during the ORR also contributes to loss in catalytic activity.32 Hence, MNC catalysts ideally need to be designed with a corrosion resistant support and with the ability to reduce oxygen completely (4 electron reduction of oxygen). Nitrogen-doped carbon nanotubes33–37 and graphene2 based MNC catalysts have been explored towards this end. In the literature, Xia et al. reported metal–organic framework-derived N-doped carbon nanotubes as superior bifunctional oxygen electrocatalyst.38
In this study, we have developed N-doped multi-walled carbon nanotubes N-MWCNTs-Co via the solid-state pyrolysis (SSP) of melamine and Co3O4. Using this catalyst, we have investigated the effect of non-covalent interactions existing between the hydrated alkali metal cations and the adsorbed oxygen based species generated on the electrode surface during the ORR/OER. Electrochemical impedance spectroscopy (EIS) and ORR polarization analysis were employed for the electrochemical characterization of N-MWCNTs-Co. In the literature, the effect of non-covalent interactions on ORR kinetics has been reported for Pt catalysts.39,40 Since the metal–air batteries are operated with an electrolyte having a high concentration of KOH, it is essential to study the ORR/OER kinetics of the catalyst in high concentration alkaline media, as we have done in this study.
An accelerated stability test (AST) comprising potential cycling between −0.13 and 0.73 V vs. Hg/HgO (OER region) at 500 mV s−1 was conducted on the N-MWCNTs-Co-800-120 min coated RDE in O2-saturated 6 M KOH solution to understand the durability and ORR activity of the catalyst after it was employed for the OER.
Electrochemical impedance spectroscopy (EIS) was performed between 100 kHz and 30 mHz with a voltage perturbation of 10 mVrms at base DC potentials of −0.08, −0.1, −0.12 and −0.14 V vs. Hg/HgO (in the ORR regime). Similarly, EIS was performed at DC potentials of 0.72, 0.74, 0.76, 0.78 V vs. Hg/HgO (in the OER regime).
An electrochemical quartz crystal microbalance (EQCM7290, Metrohm, Autolab) wherein the quartz crystal was coated with a 100 nm polished gold layer was used to study the ORR. The resonance frequency and the sensitivity coefficient of the quartz crystal were 6 MHz and 0.0815 Hz ng−1 cm−2 respectively. This quartz crystal was coated with the catalyst ink (catalyst loading = 200 μg cm−2) and used in the EQCM to follow the change in mass of the electrode during the ORR.
For testing the performance of the N-MWCNTs-Co-800-120 min catalyst in a zinc–air battery, a bipolar air electrode was made by coating a 4 cm2 carbon felt (5 mm thick) with appropriate catalyst ink. The catalyst loading on the felt electrode was 3 mg cm−2. A carbon felt coated with 0.25 g cm−2 of zinc was used as the anode. 0.2 M zinc acetate dissolved in 6 M KOH was used as the electrolyte. Synthetic air was bubbled near the cathode at 50 mL min−1 during the discharge of the battery.
![]() | ||
Fig. 1 (a) and (b) SEM images, (c)–(e) TEM images and (f) power XRD patterns of N-MWCNT-Co-800-120 min catalyst. (f) Includes the XRD of pyrolyzed melamine. |
Fig. 1(f) shows the powder XRD pattern of the catalyst and the pyrolyzed melamine. The features at around 10° and 26.5° indicated the presence of graphene and MWCNTs respectively in the catalyst. Pyrolyzed melamine exhibited many diffraction peaks related to its fragments.45 On comparing the XRD of the pyrolyzed melamine and the catalyst, it was understood that the presence of Co3O4 promoted the formation MWCNTs and graphene. The FT-IR spectrum46 of the catalyst featured the peaks due to N–H, aromatic CC and C
N, C–H and C
O stretches, confirming the functionalization of the catalyst (Fig. 2(a)). The Raman spectrum of the catalyst exhibited two strong peaks at around 1302 and 1600 cm−1, commonly known as the D and G bands of carbon (Fig. 2(b)). The presence of the D band was associated with the defects/edges47 that were likely developed due to the nitrogen/oxygen functionalization on the MWCNTs. The ratio of the intensity of D and G bands was around 1.0, indicating the presence of defects in the catalysts. Fig. S3† provides the XRD and Raman spectra of the N-MWCNTs-Co-800-20 min and N-MWCNTs-Co-800-60 min catalysts. The ratio of the intensity of the XRD features at 26.5° and 10° was used to qualitatively analyze the growing phase with the duration of pyrolysis. The intensity ratio was 1.31, 1.55 and 1.75 for N-MWCNTs-Co-800-20 min, N-MWCNTs-Co-800-60 min and N-MWCNTs-Co-800-120 min respectively, indicating the continuous conversion of N-doped graphene into N-MWCNTs with time. The Raman spectra also showed a change in ID/IG value from 1.16 to 1.03 as the pyrolysis duration increased from 20 min to 120 min. Based on CHN analysis, the nitrogen content of the catalyst obtained after 20 min and 60 min of pyrolysis was estimated to be 5.0 ± 0.2 and 3.8 ± 0.2 wt% respectively. In summary, from TEM, XRD, CHN and Raman spectroscopy studies, it was understood that Co3O4 catalyzed the formation of functionalized graphene and N-MWCNTs.
Fig. S4† shows the TGA profile of the N-MWCNTs-Co-800-120 min catalyst measured in air at 20 °C min−1 ramp rate. About 9.5 wt% of the mass was left. Employing the XRD analysis (inset to Fig. S4†), the left over mass was identified as Co3O4. Hence, the Co content of the N-MWCNTs-Co-800-120 min is about 6.9 wt%.
Fig. 3 shows the XPS spectra of N-MWCNTs-Co-800-120 min measured in the C 1s, N 1s and Co 2p regions. The XPS spectra of the other two catalysts are provided in Fig. S5 and S6.† As shown in Fig. 3(a), the C 1s peak can be deconvoluted into four peaks. The peaks at 284.8 eV, 285.9 eV, 286.8 eV and 289.2 eV represent CC, C
N or C–O, C–N or C–O–C and O–C
O respectively. Fig. 3(b) presents the Co 2p region, which was deconvoluted into three peaks. The peaks at 778.6 eV, 780.1 eV and 781.8 eV are attributed to metallic cobalt, Co3O4 and to a satellite peak of Co. The N 1s peak could be clearly deconvoluted into two peaks (Fig. 3(c)). The peaks at 398.8 eV, 401.3 eV are associated with pyridinic N and primary or secondary amines respectively. The XPS N 1s results corroborates well with FT-IR results, confirming the presence of primary/secondary amines (Fig. 2(a)) in N-MWCNTs-Co-800-120 min. Table S1 in the ESI† lists the elemental composition of the catalysts obtained through XPS analysis. The surface nitrogen content decreased by a factor of about 2.5 as the pyrolysis duration of catalyst increased from 20 min to 120 min. This related well with the CHN data, wherein the bulk nitrogen content was reported to decrease from 5 wt% to 2 wt% for a corresponding increase in pyrolysis time. As the duration of pyrolysis is increased, the nitrogen is continuously removed from the catalyst due to the high temperature involved during synthesis of the catalysts. Please note that the XRD predicted the growth of graphitic materials at the cost of graphene and Raman spectroscopy predicted increase in the intensity of IG in comparison to that of ID. Possibly, these nitrogen defect sites are removed to facilitate conversion of graphene layers into MWCNTs.
KOH concentration (M) | CO2 (mol cm−3) | DO2 (cm2 s−1) | ν (cm2 s−1) | EO2/H2O (V) vs. Hg/HgO | Activity coefficient |
---|---|---|---|---|---|
0.1 | 1.1 × 10⁻⁶ | 1.9 × 10⁻⁵ | 0.95 × 10⁻² | 0.360 | 0.8 |
1 | 0.83 × 10⁻⁶ | 1.65 × 10⁻⁵ | 0.95 × 10⁻² | 0.308 | 0.75 |
4 | 0.33 × 10⁻⁶ | 1.05 × 10⁻⁵ | 1.23 × 10⁻² | 0.257 | 1.35 |
6 | 1.7 × 10⁻⁷ | 7.5 × 10⁻⁶ | 1.6 × 10⁻² | 0.234 | 2.2 |
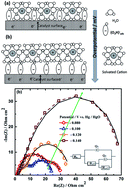
To obtain more clarity on the mechanism of the ORR, we performed EIS analysis on the catalyst coated RDE (rotating at 1600 rpm) at various DC potentials in the ORR regime. In a nitrogen-saturated solution, only a Warburg-capacitive behavior was observed indicating the absence of any charge-transfer reactions (Fig. S10(a)†). Fig. 4(c) shows the representative Nyquist plots and corresponding Bode phase plots obtained in O2 saturated 0.1 M KOH solution as a function of potential. The Nyquist plots and corresponding Bode phase plots for the remaining KOH concentrations are provided in Fig. S10(b)–(d).† The equivalent circuit used is shown as inset to Fig. S10(b).† Fig. 4(c) shows the presence of two semicircles at all potentials, indicating two possible charge-transfer steps for the ORR on the catalyst. With increasing overpotential (in the cathodic direction), the second semicircle grows and the first semicircle decreases in diameter. Hence, we believe that the second semicircle was due to a mass-transfer influenced charge transfer step. The best fit to this data was obtained with an impedance circuit corresponding to a transmissive-finite diffusion model.54–56 We believe that this behavior is due to species diffusion through the attached film of partly reduced oxygen intermediate species ((O2H)ads−) adsorbed on the surface of the catalyst, which is stabilized by hydrated alkali metal cations (Scheme 1). The reduction process associated with the conversion of oxygen to intermediate species corresponds to the first semicircle in the Nyquist plots. Constant phase element (CPE, Q) is employed to fit the experimental impedance data instead of pure capacitor, as the goodness of it is poor with the later. The physical reason for replacing capacitor with Q is well-established in the literature and it is due to the frequency dependence of the measured electrode–electrolyte capacitor, which is arising due to surface inhomogeneity, roughness and current and potential distribution associated with the electrode geometry.57–59 The expected phase angle for the pure capacitor is 90°, anything lower than that indicates the presence of CPE. The Bode phase plot shown in the right side of Fig. 4(c) clearly indicates presence of two time constants. The phase angle associated with the high-frequency side peak decreases slightly with overpotential, whereas the phase angle associated with low-frequency side peak is increasing with increase in overpotential. This again confirms the dominance of capacitive contribution arise due to the increase in the surface concentration of (O2H)ads− intermediate species adsorbed on the surface of the catalyst with increase in overpotential.
![]() | ||
Scheme 1 The growth of (O2H)ads−–M+(H2O)x cluster layer with overpotential on the electrode–electrolyte interface. |
The results of EQCM measurements performed in oxygen and nitrogen saturated 0.1 M KOH are shown in Fig. S11.† In oxygen saturated electrolyte, as the potential was scanned from 0.015 V to −0.28 V vs. Hg/HgO, a negative change in the frequency was observed at potentials lower than −0.1 V, indicating increase in the mass of the catalyst coated quartz crystal. This increase in mass was attributed to adsorbed intermediate species, such as (O2H)ads−, produced during the ORR. The change in frequency at −0.275 V vs. Hg/HgO was equivalent to 877 ng cm−2. In nitrogen-saturated electrolyte, a slight negative change in the frequency was observed at potentials below −0.1 V, which was attributed to the potential induced change in the interfacial region, such as formation of hydroquinone from quinone etc. This result supports the interpretation of the EIS data. Strmcnik et al.39 and Katsounaros et al.40 reported the existence of non-covalent binding between OHads and hydrated cation clusters (OHads–M+(H2O)x) located at the outer Helmholtz plane (OHP) of the double layer during electrocatalytic reactions over platinum in alkaline media. The presence of this layer of cation clusters is reported to increase the overpotential towards O2 reduction and to decrease the overpotential towards H2O2 oxidation. Since the hydration energy of Li+ is higher than that of K+, the concentration of OHads–Li+(H2O)x cluster was higher on the catalyst surface at a given overpotential. Hence, the ORR was reported to have higher overpotential in a LiOH solution compared to a KOH solution. Fig. S12† shows the Nyquist plots of Pt/C catalysts in various KOH solutions for comparison. Platinum exhibited only one semicircle60 across the ORR regime and the charge transfer resistance decreased with increase in overpotential.
In alkaline media, the ORR on NPM catalyst proceeds via a multistep mechanism comprising adsorption and desorption phenomena, and it is well documented in the literature.43 In Fig. 4(d) and (e), Rct1 and Rct2 correspond to the first and second semicircle respectively, and were determined at various KOH concentrations. There was not much change in the Rct values when the concentration of KOH changed from 0.1 M to 1 M. The inset of Fig. 4(e) shows the change in ik values as a function of potential for 0.1 M and 1 M KOH solutions. From the Rct values and the ik values, no change was observed in the ORR mechanism or the order of the ORR reaction with respect to KOH concentration (zero order) while varying the KOH concentration from 0.1 M to 1 M. However, the observed Rct values for 4 M and 6 M KOH solutions greatly vary. For comparison, Fig. 4(f) shows the change in Rct values of Pt/C as a function of potential in the four KOH solutions. The Rct values of Pt/C were nearly one order magnitude higher in comparison to the Rct1 values of N-MWCNTs-Co-800-120 min catalyst at potentials close to equilibrium. Similar Rct values have been reported for Pt/C in the literature.55
Employing the reduction potential and activity coefficients given in Table 1 and the ik values obtained from the K–L analysis, exchange current density (i0) values and transfer coefficient (α) values were calculated (see Table 2) using the Nernst and Tafel equations given below.
![]() | (1) |
![]() | (2) |
KOH concentration (M) | Transfer coefficient (α) | Exchange current density (i0/A cm−2) | Exchange current density (i0/A cm−2) | |
---|---|---|---|---|
N-MWCNTs-Co-800-120 min | 20% Pt/C | N-MWCNTs-Co-800-120 min | 20% Pt/C | |
0.1 | 0.80 | 0.44 | 1.56 × 10⁻⁹ | 3.6 × 10⁻⁶ |
1 | 0.86 | 0.78 | 2.74 × 10⁻⁹ | 9.51 × 10⁻⁸ |
4 | 1.16 | 0.93 | 1.70 × 10⁻¹⁰ | 1.38 × 10⁻⁸ |
6 | 1.30 | 0.94 | 1.58 × 10⁻¹¹ | 1.41 × 10⁻⁸ |
The i0 values for 0.1 and 1 M KOH were in the order of 10−9 A cm−2 and decreased to 10−10 and 10−11A cm−2 in case of 4 M and 6 M KOH respectively, indicating a change in surface coverage by the species present in aqueous KOH solution (water, hydrated potassium ion and hydroxide). From Fig. 4(a), a negative shift in the onset of ORR with KOH concentration could be observed. For comparison, the i0 and α values of 20 wt% Pt/C catalyst are also reported in Table 2. The i0 values of the Pt/C catalyst were on the order of 10−8 A cm−2 in the concentration range of 1 M to 6 M KOH. Although the Rct values of Pt/C are higher than the corresponding values for the N-MWCNTs-Co-800-120 min, the observed ORR activity of Pt/C catalyst was higher than that of the N-MWCNTs-Co-800-120 min catalyst in 4 M and 6 M solutions as the exchange current densities on Pt/C were nearly 2 to 3 orders of magnitude higher to those on N-MWCNTs-Co-800-120 min. However, the difference between the E1/2 values of Pt/C and N-MWCNTs-Co-800-120 min decreased from about 100 mV to 60 mV as the concentration of KOH was increased from 4 M to 6 M. Hence, at the high KOH concentrations required for zinc–air batteries, the N-MWCNTs-Co-800-120 min catalyst can adequately substitute for Pt/C, especially given its much higher activity for the OER.
To study the effect of cation on activity, we performed ORR polarization (Fig. 4(g)) and impedance analysis for the N-MWCNTs-Co-800-120 min catalyst in 0.1 M LiOH solution. The overpotential for the ORR reaction in this solution was higher in comparison to 0.1 M KOH and this effect was more pronounced in the mixed control and limiting current regions of the ORR curve. The Rct1 and Rct2 values measured in 0.1 M KOH and 0.1 M LiOH are shown in Fig. 4(h). Across the potentials studied, the Rct1 value for LiOH was about 5 ohm-cm2 higher than in KOH. Although the activity coefficient of 0.1 M KOH and 0.1 M LiOH are almost the same,50 the difference in Rct1 values indicated cation specific interactions with the catalyst surface even near equilibrium conditions. The difference between the Rct2 values in LiOH and KOH solutions increased with overpotential, confirming the high level of interaction between the ORR intermediates adsorbed on the catalyst surface and hydrated Li+, compared to hydrated K+. Based on the above analysis, we suggest the following inner-sphere electron transfer mechanism consisting of multi-step elementary electrochemical reactions for the ORR on the N-MWCNTs-Co-800-120 min catalyst surface.
O2 + active site ↔ O2ads | (I) |
O2ads + e− → O2ads− | (II) |
2O2ads− + H2O → (O2H)ads− + O2 + OH− | (III) |
(O2H)ads− + H2O + e− → (OH)ads + 2OH− | (IV) |
(OH)ads + e− → OH− | (V) |
At potentials close to onset potential, the first electron transfer could be rate limiting as confirmed by the impedance analysis, wherein Rct1 was higher than Rct2. Near the onset potential, the surface coverage due to (O2H)ads− species would be lower. As the overpotential increased (closed circuit conditions) more and more (O2H)ads− species would form and would gradually begin to cover the electrode surface if the reduction of (O2H)ads− species into (OH)ads turns into the rate-determining step. The layer of (O2H)ads− can be stabilized by the hydrated alkali metal cations, via electrostatic interactions, forming a (O2H)ads−–M+(H2O)x type of cluster layer (Scheme 1). A layer of such clusters would impede the oxygen and electrolyte mass-transport to the electrode surface. This cluster is in a quasi-specifically adsorbed state as the alkali metal ion contacts the electrode surface via adsorbed (O2H)−. Hence, at potentials lower than −0.08 V vs. Hg/HgO, step (IV) could be the rate-limiting step as the tunneling of electron and insertion of H2O into the activated complex present in the cluster layer could be an energy intensive process. Moreover, the availability of water at the catalyst–electrolyte interface could be impacted by the competitive H2O absorption by the alkali cation to form its hydration shell.
In the literature two kinds of active sites have been reported namely (i) transition metal ion coordinated to the pyridinic nitrogen covalently attached to the edges of the graphitic crystallites41 and (ii) metal free catalysts having pyridinic and quaternary type of nitrogen tethered to the edges of graphitic crystallites.40 To identify the N-MWCNTs-Co-800-120 min catalyst's active site, the ORR activity was measured in presence of 10 mM 2,2′-bipyridine (Bpy) or disodium salt of ethylene diamine tetraacetic acid (EDTA) (Fig. 5). Ligation of cobalt ion, present in the active site, with Bpy/EDTA was expected to modify the ORR activity of the catalyst. Both in presence of Bpy and EDTA, the ORR activity did not change appreciably at the onset potential and in the kinetic region, whereas the limiting current was lowered. This indicated that in the presence of Bpy/EDTA, oxygen diffusion towards the ORR active site was impeded, most likely due to the diffusion barrier offered by adsorbed EDTA/Bpy or EDTA/Bpy co-ordinated to the exposed cobalt site if any. Hence, we inferred that the active site comprised of only carbon and nitrogen, wherein the role of cobalt is to catalyze the formation of carbon nanotubes functionalized with catalytic sites constituted of carbon and nitrogen. TEM results (Fig. 1(c)) indicated the presence of cobalt particles encapsulated by carbon (confirmed by the EDAX and electron diffraction measurements), and no visible cobalt particles were spotted outside the nanotubes.
![]() | ||
Fig. 5 ORR activity of N-MWCNT-Co-800-120 min catalyst measured in O2 saturated 0.1 M KOH solution with and without Bpy and EDTA. |
Fig. 6 shows the ORR activity of N-MWCNTs-Co-800-120 min catalyst and Pt in presence and absence of 0.2 M zinc acetate in 4 M KOH solution. It is important (from the perspective of application in a zinc air battery) to check the effect of zinc containing electrolyte on the ORR activity of a bifunctional electrocatalyst. The ORR activity of N-MWCNTs-Co-800-120 min catalyst was not affected by the presence of zinc, however a 50 mV negative shift was observed in case of platinum, indicating a detrimental interference of zinc on the ORR activity of Pt/C due to adsorption effects.
![]() | ||
Fig. 6 ORR activity of N-MWCNT-Co-800-120 min catalyst and Pt/C in the presence (open triangle) and absence (open circle) of 0.2 M zinc acetate in 4 M KOH solution. |
Fig. 7 shows the OER polarization curves of N-MWCNTs-Co-800-120 min catalyst at four different KOH concentrations and the OER activity measured in the presence of zinc acetate in 4 M KOH solution. The highest OER activity of 10 mA cm−2 at 0.6 V vs. Hg/HgO (1.59 V vs. RHE) was obtained in 6 M KOH solution. This value is comparable to the reported OER activity values reported in the MNC literature.61 As the potentials in the OER region are more positive relative to the potentials in the ORR region, the electrostatic attraction between the electrode surface and hydrated metal ion would be minimized, thereby enhancing the OER activity with increase in KOH concentration in the solution. The OER activity of N-MWCNTs-Co-800-120 min catalyst was not affected by the presence of zinc across the potential range studied. Fig. S13(a)–(b)† shows the OER polarization of 20 wt% Pt/C and 20 wt% IrO2/C respectively, in various KOH solutions. At all KOH concentrations, the OER activity of Pt/C was lower than that of N-MWCNTs-Co-800-120 min. At 0.6 V, in 6 M KOH, an OER current density of 1.35 mA cm−2 was observed on the Pt/C catalyst, which was about 8 times lower than that of N-MWCNTs-Co-120 min catalyst. At all KOH concentrations, the OER activity on 20 wt% IrO2/C was comparable to that of N-MWCNTs-Co-800-120 min. For instance, at 0.6 V and 0.7 V, in 6 M KOH, the OER current densities were 10 mA cm−2 and 64 mA cm−2 respectively; the corresponding values were 10 mA cm−2 and 59 mA cm−2 on N-MWCNTs-Co-800-120 min. Fig. S14† shows the OER activity of 20 wt% Pt/C and 20 wt% IrO2/C in presence of 0.2 M zinc acetate; due to the interference of zinc, the OER activities of Pt/C and IrO2/C were further reduced. Fig. S15 and S16† show the Nyquist plots obtained in various KOH solution as a function of potential, relevant to the OER region. At any given potential, the Rct observed with N-MWCNTs-800-120 min was lower than the Pt/C counterpart. Fig. S17(a) and (b)† presents the summary of Rct values obtained as a function of potential in various KOH solutions for N-MWCNTs-800-120 min and Pt/C. With increasing KOH concentration, Rct decreased for both N-MWCNTs-800-120 min and Pt/C.
![]() | ||
Fig. 7 OER polarization of N-MWCNT-Co-800-120 min catalyst measured in N2 saturated KOH solutions (0.1 M, 1 M, 4 M and 6 M) and in 4 M KOH solution containing 0.2 M zinc acetate. |
To identify the N-MWCNTs-Co-800-120 min catalyst's active site, the OER activity was measured in presence of 10 mM 2,2′-bipyridine (Bpy) or disodium salt of ethylene diamine tetraacetic acid (EDTA) in 0.1 M KOH (Fig. S18†). Ligation of cobalt ion, present in the active site, with Bpy/EDTA was expected to modify the OER activity of the catalyst. Both in presence of Bpy and EDTA, the OER activity did not change appreciably at the onset potential and in the kinetic region, which confirms that Co is not part of the OER active site.
To resolve this issue, 50 polarization cycles in the OER regime (between 0.35 and 0.8 V at 20 mV s−1) was carried out using Ketjenblack carbon (reference, independent run) and N-MWCNTs-Co-800-120 min (sample) in 100 mL of 0.1 M KOH solution (Fig. S18†). Fig. S20(a)† shows the data obtained on N-MWCNTs-Co-800-120 min; the current obtained increased with the number of cycles. Fig. S20(b)† shows the results of the same experiment performed with Ketjenblack carbon, wherein a decrease in oxidation current observed with the number of cycles. This provides partial evidence for the OER on the N-MWCNTs-Co-800-120 min catalyst and for carbon corrosion on the Ketjenblack carbon, but again does not rule out carbon corrosion in the former. A similar cycling experiment was repeated in 100 mL of 0.1 M KOH solution containing 15 mg of Ca(OH)2. Upon cycling, the electrode was washed in distilled water, dried and photographed. Photographs of RDE electrodes coated with Ketjenblack and N-MWCNTs-Co-800-120 min upon cycling are shown as insets to Fig. S20.† The Ketjenblack coated RDE electrode turned white due to the precipitation of CaCO3 as a result of the reaction between electrochemically evolved CO2 from the carbon surface and Ca(OH)2 in the solution. Whereas, there was no visible white precipitate found on the N-MWCNTs-Co-800-120 min catalyst coated RDE, supporting the premise of a high selectivity towards the OER over carbon corrosion.
![]() | ||
Fig. 8 ORR polarization curve of the N-MWCNT-Co-800-120 min catalyst before and after 1000 AST cycles in the OER region in 6 M KOH solution. |
Fig. S23(a)† shows the photograph of the N-MWCNTs-Co-800-120 min and zinc coated carbon felt. Fig. S23(b)† shows the experimental zinc–air battery setup. Fig. S24† compares the SEM micrograph of the carbon felt and zinc-coated carbon felt. A uniform coating of zinc on the carbon fibers of the felt was observed and EDAX confirms the presence of zinc (Fig. S23(c)†). The average charging voltage of the battery was 2.0 V and corresponding discharge voltage was 1.15 V. Fig. 9(a) compares the first 16 cycles of the zinc–air battery while using N-MWCNTs-Co-800-120 min, 20 wt% Pt/C or 20 wt% IrO2/C as air electrodes. In the ORR regime (the discharge profile of the zinc–air battery), the cell voltage exhibited by N-MWCNTs-Co-800-120 min was 44 and 83 mV higher (based on 5th cycle) in comparison to of 20 wt% Pt/C and 20 wt% IrO2/C respectively, which is in line with the half-cell studies performed in RDE mode. In the OER regime (charge profile of zinc–air battery), the IrO2/C exhibited about 45 mV lower overpotential in comparison to that of the N-MWCNTs-Co-800C-120 min, which corroborates with the half-cell study (S13(b) and S14†). Fig. 9(b) shows the change in average charge and discharge voltage of the zinc–air battery, employing N-MWCNTs-Co-800C-120 min as air electrode, as a function of the current density. This demonstrates the ability of N-MWCNTs-Co-800C-120 min to work at higher current densities.64
Footnote |
† Electronic supplementary information (ESI) available. See DOI: 10.1039/c6ra13414a |
This journal is © The Royal Society of Chemistry 2016 |