Bio-based plant oil polymers from ROMP of norbornene modified with triglyceride from crude red palm olein

H. Fernandesa, R. M. Souza Filhob, J. L. Silva Sáb and B. S. Lima-Neto*a
aInstituto de Química de São Carlos, Universidade de São Paulo, PO Box 780, 13560-970, São Carlos, SP, Brazil. E-mail: benedito@iqsc.usp.br
bCentro de Ciências da Natureza, Universidade Estadual do Piauí, 64002-150, Teresina, PI, Brazil. E-mail: zeluizquimica@gmail.com

Received 22nd May 2016 , Accepted 4th August 2016

First published on 4th August 2016


Abstract

A novel monomer norbornene palm olein (NPO) was isolated from reaction of 5-norbornene-2-carboxylic acid with triglycerides from red palm olein, with one norbornene (NBE) unit per NPO. No polymer from ROMP of NPO with a 2nd generation Grubbs catalyst was produced. ROMP of NPO in the presence of free NBE at 30 °C with different amounts of each monomer resulted in products with different physical states. Viscous liquids, soft solids, and cracked solids resulted from reactions with 90%, 80–40%, and 20% NPO, respectively. The soft solids were insoluble in water, acetic acid, and typical organic solvents. Swelling experiments in slightly polar organic solvents resulted in a mass gain of up to 800%, as in chloroform at 30 °C for 48 h. SEM micrographic images showed non-porous materials, and TGA analyses indicated thermal stability up to 300 °C. A poly(NPO-co-NBE) type has been suggested as the resulting product.

Introduction

Requirements for sustainable and environmentally friendly developments are a concern in different scientific fields, as well as in the chemical industry.1,2 In this direction, alternative raw materials to replace petroleum-based products have been sought. Plant oils and fatty acids have been suggested as alternatives for a variety of products, such as lubricants, paints, polymers, fuels, etc. Other purposes include the finding of low cost raw materials that could be used as carbon sources with high availability, accessibility, variety and versatility for the production of alternative and renewable polymers.1–5

In contrast ring-opening metathesis polymerization (ROMP) of cyclic olefin catalyzed by transition metal-carbene complexes6 is a method to produce polymers which has presented increasing evolution for the past two decades. Contrary to vinyl polymerization, a characteristic of this reaction is the retention of the unsaturation in the chain. Typically, this reaction utilizes chemicals from petroleum to develop high value-added materials, such as automotive rubber components and absorbent materials.7,8 Currently, ROMP has explored monomers synthesized from compounds obtained from natural sources such as sugars, amino-acids, fatty acids, and triglycerides from plant oils.5,9–12

To produce monomers to ROMP from plant oils, cyclic olefins have to be chemically bonded in the triglycerides. Olefins and other functional groups present in many triglycerides enable this connection. Plant oils with high unsaturation content, such as soybean, castor and linseed oils, with ca. 85, 96 and 90%,2,13 respectively, have been targeted by researchers for the development of new monomers.14–16 This study aims to develop a monomer from oil with low unsaturated content and expand the array of renewable resources to be used.

Palm Oil (PO) extracted from the fruit of Elaeis guineensis palm tree is a promising candidate. This oil is rich in oleic (C18:1; ca. 45%) and palmitic (C16:0; ca. 47%) acids,2 with two well-defined oil phases (olein and stearin).17 PO has not been largely investigated as a chemical source probably because of its high-saturated fatty acid content compared with those from plant oils that have been employed in polymer development. With the purpose of producing polymer from PO, this study presents the development of a novel monomer from norbornene (NBE) attached to triglyceride chains from PO and its reaction via ROMP. Instead of the pure triglycerides or fatty acids from certain plant oils generally used, red palm olein (RPO) oil from crude PO was used in this study. This aims to simplify the use, reduce costs, and possibly raise the value-added of raw material.

Experimental

General remarks

Norbornene (NBE), 5-norbornene-2-carboxylic acid (AcNBE), 2nd generation Grubbs catalyst (G2), triethylamine (TEA) and CDCl3 were from Aldrich. Hydrogen peroxide (30%) was from Merck. HPLC grade CHCl3 from Tedia was distilled prior use. Other analytical grade reagents were from Synth. Crude palm oil was purchased in supermarket, presenting two oil phases (olein and stearin) at room temperature (23 ± 1 °C). The red palm olein (RPO) oil was separated by decantation and used as acquired.17

Epoxidation of triglycerides from RPO

Formic acid (85%; 4 mL) was added to a two-way round bottom flask containing RPO (20 g). Under ice bath, hydrogen peroxide (100 mL) was dropwise added from an addition funnel. The mixture was stirred for 4 h at 60 °C to produce a colorless biphasic solution. In a separatory funnel, the organic layer containing the epoxidized palm oil (EPO) was washed with cooled distilled water and dried under reduced pressure, yielding 18 g of EPO.18

The average number of oxirane rings present in the EPO was determined by the integrated intensity of the signals in the 1H-NMR spectrum and by direct titration with acetic solution of hydrobromic acid (100 μmol L−1) in presence of violet crystal as indicator.19

Reaction of EPO with norbornene

EPO (15 g), AcNBE (4.4 g), and TEA (77 μL) were added to a two-way round-bottom flask. The AcNBE stoichiometry was 1[thin space (1/6-em)]:[thin space (1/6-em)]1 in relation to the oxirane rings present in the EPO. The reaction was left to stir for 24 h at 160 °C. 350 mL of an aqueous 5 wt% Na2CO3 solution was added to convert AcNBE non-functionalized in the corresponding carboxylate salt. The reaction mixture was stirred for 12 h at room temperature.15 The produced norbornene palm olein (NPO) was extracted with 50 mL of ethyl acetate and dried under reduced pressure, resulting 15 g of a viscous brown liquid. The average number of NBE rings present in the NPO was determined by the integrated intensity of the signals in the 1H-NMR spectrum.15

Polymerization reactions

In typical reaction, the monomer, CHCl3 (1 mL of per 1000 mg of monomer), and the G2 catalyst (1.7; 0.84; 0.56; or 0.42 mg) were mixed in a round-bottom flask. ROMP of NPO were carried out at 60 °C for 1 h, and then at 150 °C for 48 h, with magnetic stirring in air atmosphere. In the cases of the copolymerizations of NPO with NBE, different amounts of NPO (20–90 wt%; NBE as balance) and different (total NBE)/catalyst molar ratios were evaluated, where total NBE is NBE content in NPO plus added free NBE. The reaction mixtures were stirred by hand at 30 °C until gelation of the solutions that occurred at different times in each case. Reactions with large percentages of NBE were very exothermic and they were performed in ice bath.

Swelling tests

Swelling tests with solvents presenting different Hildebrand solubility parameter were performed at 30 °C.20,21 The weight of samples with similar dimensions were measured as function of time after softly removal of external liquid with absorbing paper. The results are average of three similar samples.

Equipment

TGA analyses were performed in a Shimadzu model TGA-50, from 30 to 750 °C at 10 °C min−1 in N2 atmosphere. NMR spectra were recorded in a 400 MHz Agilent Technologies Nuclear Magnetic Resonance Spectrometer, with CDCl3 as a solvent. FTIR measurements of one drop of compound added to silicon window were performed in a MB-102 BOMEN Spectrometer. SEM were performed in a LEO 440 model.

Results

Characterization of RPO by 1H-NMR

RPO composition was calculated from the integrated intensity of the signals in the 1H-NMR spectrum assigned to the protons in typical fatty acid chains (Fig. 1; Scheme 1). The method identifies the unsaturated fatty acids, grouping the saturated fatty acids in a single block.22 This is useful in the present case because the saturated fraction in RPO is not very complex, with palmitic acid as the major component.2 The result is in agreement with data from the literature (Table 1).2
image file: c6ra13287a-f1.tif
Fig. 1 1H-NMR spectrum of RPO in CDCl3; the peaks are assigned in Scheme 1.

image file: c6ra13287a-s1.tif
Scheme 1 Illustration of typical fatty acid chains in RPO; Arabic and Greek letters denote the protons in the 1H-NMR spectrum.
Table 1 RPO fatty acid composition determined from 1H-NMR spectrum
Fatty acid Experimental Literature2
Linoleic (18:2) 10.6% 7.90%
Oleic (18:1) 41.5% 45.2%
Saturated (palmitic) 47.9% 46.9%


From the fatty acid composition, the triglyceride molar mass was calculated by using a weighted average of its components (eqn (1)); M values are the molar masses, and value 38 represents the molar mass increase from the esterified glycerol with fatty acid chains. The result is 847 g mol−1.

 
Mtriglc = [3(0.479Msaturated + 0.415Moleic + 0.106Mlinoleic)] + 38 (1)

Synthesis of NPO

The olefins in the triglycerides from RPO were epoxidized with performic acid, which was produced in situ by mixing formic acid with hydrogen peroxide in a 20/2/1 molar ratio of hydrogen peroxide/formic acid/olefin.

The olefins were converted into oxirane rings, resulting in epoxidized palm oil (EPO) (Scheme 2), as indicated by the 1H-NMR spectra (Fig. 2). The signals at 5.35, 2.80, and 2.00 ppm, respectively attributed to olefin (A), inter-olefin (B), and α-olefin (D) protons decreased, and the signals at the 2.90–3.10 ppm range and at 1.50 ppm, respectively assigned to oxiranic and α-oxiranic protons present in the EPO appeared.


image file: c6ra13287a-s2.tif
Scheme 2 Illustration of the EPO and NPO syntheses from a generic triglyceride.

image file: c6ra13287a-f2.tif
Fig. 2 1H-NMR spectra of RPO, EPO and NPO in CDCl3.

FTIR spectrum of the EPO showed a band at 840 cm−1 related to vibrations in the oxirane rings, with disappearance of the band at 700 cm−1 related to the olefinic bond vibrations.

From the integrated intensity of the signals in the 1H-NMR spectrum and the direct titration of the oxirane rings with HBr–HAc solution, an average of 1.8 oxirane rings per EPO unit was calculated.

The presence of the norbornene unit in the NPO monomer, from the reaction between AcNBE and the oxirane rings in the EPO, was characterized by the signals in the 1H-NMR spectrum attributed to the proton in the carbon attached to the NBE moiety (ca. 4.8 ppm) and to the proton in the carbon attached to the hydroxyl group (ca. 3.6 ppm) from the opening of the oxirane ring (Fig. 2). From the integrated intensity of the signals in the 1H-NMR spectrum and the direct titration with HBr–HAc solution of the residual oxirane rings, an average of 1.0 NBE molecule per NPO unit was calculated. Olefinic protons from attached norbornene can be observed at the 5.85–6.25 ppm range.

From the signals in the 1H-NMR spectrum attributed to the protons in the glycerol unit (α and β; Scheme 1), the triglyceride structure remains after reactions.

ROMP reactions

All attempts to polymerize 1000 mg of NPO with different amounts of 2nd generation Grubbs (G2) catalyst (1.7–0.42 mg) for 1 h at 60 °C and 48 h at 150 °C failed. In these experiments, changes in the viscosity were not observed by visual perceptions, and the olefin proton signals in the 1H-NMR spectra were not shifted in the final solution. Polymers from monomers derived from plant oils have been obtained under similar conditions.15,23 Unlike the NPO, the monomers presented more than two cyclic olefins per monomeric unit in all cases. Perhaps, only one cyclic olefin per triglyceride-monomer can hamper the occurrence of the ROMP steps due to a large steric hindrance (see ESI, Fig. S1), even using the reactive G2 catalyst where the orbital coplanarity in the olefin–metal-carbene moiety is necessary for the occurrence of successful polymerization. It is possible that a larger number of cyclic olefins by monomer unit, as reported in the literature, would solve the problem of steric hindrance, allowing at least the production of oligomers that would be sufficient to gel the solution because of the high monomer molar mass. A parallel test was conducted using epoxidized methyl esters from RPO to produce a similar monomer (norbornene fatty acid methyl ester; NBE-FAME), but not in a triglyceride form. When G2 catalyst was added to this respective monomer, NBE-FAME, an increase in the viscosity was observed. This suggests that ROMP of NBE-FAME occurred where reduced steric hindrance in the fatty ester chain allowed the reaction to occur.

Considering that the production of polyNPO can be blocked by steric hindrance due to the difficulty in packing NPO units next to each other, where the polymer is tailored by the metal catalyst, free NBE can be used as a co-monomer to link NPO units.

Successful copolymerizations (Scheme 3) resulted from reactions with different ratios of NPO/NBE content and total-NBE/catalyst molar ratio at 30 °C (Table 2), where total NBE is free NBE plus NBE in NPO. The changes in the physical aspects of the resulting products as a function of the total-NBE content and the amount of catalyst were visually clear. The products became more rigid as the free NBE percentage (from entry 5 to entry 1) increased; the same occurred as the amount of catalyst (from 7500 to 500 in molar ratio) increased. Although there was a substantial increase in viscosity, it was not enough to enable gelification, perhaps only oligomers were produced.


image file: c6ra13287a-s3.tif
Scheme 3 Representation of a copolymerization with NPO and NBE.
Table 2 Dependence of resulting product type on the starting monomer content and on the catalyst amount for ROMP of NPO in presence of NBE at 30 °Ca
Entry Monomer contentb Total-NBEc/catalyst molar ratio
500 750 1500 3000 7500
a The letters C, S, and V denote how fast were the reactions and the product physical aspect: C for a immediate reaction with cracked solid product (less than 1 min); with bubbles due to boiling solvent. S for a moderate reaction with soft solid product (1–60 min). V for a slow reaction with viscous liquid product (more than 60 min).b NPO wt%; NBE balance.c NBE units in NPO plus additional free NBE.
1 20% NPO C C C C C
2 40% NPO S S S S S
3 60% NPO S S S S S
4 80% NPO S S S V V
5 90% NPO V V V V V


It must be observed that 10% of free NBE was enough for the occurrence of ROMP (entry 5), contrary to NPO homopolymerization attempts. This can suggest that NBE polymerized with NPO units, perhaps working as a bridge between them (Fig. 3), because homo-polyNBE usually gels very fast, as observed in a parallel experiment.


image file: c6ra13287a-f3.tif
Fig. 3 Illustration of a possible poly(NPO-co-NBE) molecular structure, depicting the main polymeric chain with NPO and NBE mers.

Acting as a spacer, NBE allows sufficient space between the NPO units for the polymer chain to propagate. Samples obtained from mixtures containing at least 20% of NBE (entry 4) showed complete gelation. This shows that there is a minimum NBE content to enable the occurrence of polymers from NPO.

From the production of materials with different aspects, the samples from the range 40–80% of NPO and 500–1500 total-NBE/catalyst molar ratio, identified by the letter “S” in Table 2, were appropriate for further studies. These samples showed a mild curing process and produced fully gelled materials, as shown in Fig. 4.


image file: c6ra13287a-f4.tif
Fig. 4 Photographs of resulting material from sample with 80% NPO and 750 molar ratio.

Reasoning that pure NPO did not polymerize and pure NBE underwent immediate reaction with G2 catalyst producing a gel, it would be possible that a mixture of non-polymerized NPO molecules with polyNBE was produced. However, SEM micrographs showed a continuous pattern without pores for all cases (Fig. 5); polyNBE is usually porous.24 Moreover, all the solids with C and S marks in Table 2 were insoluble in chloroform, contrary to polyNBE, confirming that novel polymeric materials were obtained.


image file: c6ra13287a-f5.tif
Fig. 5 SEM micrographs of resulting material from sample with 60% NPO and 750 molar ratio. (a) 100× magnification, (b) 500×, (c) 5000×.

Swelling test

The samples from different percentages of NPO (40; 60; 80%) and different total-NBE/catalyst molar ratios (450; 750; 1500) were insoluble at room temperature (ca. 23 °C) in typical slightly polar and polar solvents such as heptane (dielectric constant = 1.92), cyclohexane (2.02), toluene (2.38), chloroform (4.81), acetic acid (6.15), acetone (20.7), ethanol (24.5), dimethylformamide (36.7), acetonitrile (37.5), and water (80.1).

Swelling experiments at 30 °C were conducted with selected solvent presenting Hildebrand solubility parameter values ranging from 7.4 to 12.14.20,21 Fig. 6 shows the swelling curves as a function of time for resulting material from the sample with 60% NPO and molar ratio of 750.


image file: c6ra13287a-f6.tif
Fig. 6 Swelling curve (top) at 30 °C with selected solvent presenting different values of Hildebrand solubility parameters for resulting material from sample with 60% NPO and 750 molar ratio. Plot of percentage of swelling (bottom) after 48 h as a function of the Hildebrand solubility parameter.

The swelling curves follow saturation profiles for heptane, cyclohexane, toluene, and chloroform, with swelling increasing with increasing solubility parameter. The samples swelled the most (ca. 20%) in acetic acid, acetone, and DMF, with no influence of the solubility parameter. The occurrence of swelling suggests that although the material is insoluble in such solvents, there is great mobility in the polymer chains.20,21

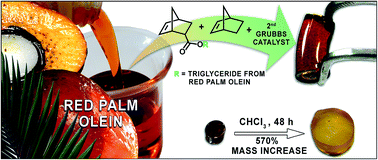
Chloroform also provided the highest swelling with the other samples. For the resulting material from the sample with 80% NPO and molar ratio of 750, a 570% mass increase occurred after 48 hours (Fig. 7).


image file: c6ra13287a-f7.tif
Fig. 7 Sample from 80% NPO and 750 molar ratio before and after swelling in chloroform for 48 h, with 570% mass increase.

The solubility parameter of 9.21 from chloroform is the closest value to the solubility parameter of the tested materials.20,21

Swelling curves in chloroform for the sample from different percentages of NPO (40; 60; 80%) and different total-NBE/catalyst molar ratios (500; 750; 1500) are depicted in Fig. 8. Samples with less NPO swelled more, as observed when the samples with 40% NPO are compared with those with 80% NPO. The amount of catalyst used in the syntheses showed no major influence on the swelling, as it can be observed by comparing the curves for samples with 60% NPO and changing the molar ratio. Indeed, the samples with 60% NPO present similar curves.


image file: c6ra13287a-f8.tif
Fig. 8 Swelling curves in chloroform at 30 °C for resulting samples with different percentage of NPO (40; 60; 80%) and different total-NBE/catalyst molar ratio (500; 750; 1500).

The samples swelled in chloroform were left to dry until reproducible weight was reached. The weight loss was determined by the difference between the initial and final weights (Table 3), with results with no clear correlation. The residual solvent volumes from the swelling experiments were reduced by rotoevaporation and analyzed by 1H-NMR (see ESI, Fig. S2). From the integrated intensity of the signals in the 1H-NMR spectrum, two major extracted components were identified as polyNBE and unreacted NPO monomer (Table 3), where high NPO content follows the NPO amount in the starting sample. The amount of catalyst does not correlate with the amount of extracted compounds.

Table 3 Extracted mass from swelling tests in chloroform
  Sample (wt% NPO; total NBE/catalyst)
40; 450 60; 450 80; 450 60; 700 40; 1500 60; 1500 80; 1500
Extracted fraction (wt%) 33.3 19.8 19.0 19.4 44.4 22.5 31.9
PolyNBE in extracted fraction (wt%) 56 33 9 33 46 33 6
NPO in extracted fraction (wt%) 44 67 91 67 54 67 94


From the results with 60% NPO with three different amounts of catalyst, it appears that there is an ideal molar ratio between NPO and free NBE to result in the same polymeric material, with no influence of catalyst amount.

Analyzing the swelling results and the compounds extracted, the major part of the synthesized material can be considered poly(NPO-co-NBE). Thus all isolated materials are composed of polymer blends of poly(NPO-co-NBE) and polyNBE, with unpolymerized NPO or soluble NPO-oligomers.

Thermogravimetric analysis

Similar samples from the swelling tests were analyzed by thermogravimetry (TGA). Curves from samples with different starting amount of NPO (40, 60 or 80%) and the same catalyst concentration (molar ratio of 500) roughly presented the same profiles, with two main degradation stages at 430 and 470 °C (Fig. 9). The main difference is a degradation process at approximately 380 °C, with weight loss following the NPO content. The latter step is not present in the curve of the sample with 40% NPO, which presents the largest weight loss at 470 °C. Similar results were obtained from samples with 40, 60, and 80% NPO and molar ratio of 1500.
image file: c6ra13287a-f9.tif
Fig. 9 TGA and DTG (insert) of the samples from 40, 60 and 80% NPO and 500 of molar ratio.

Identical curves were obtained from the samples with 60% NPO and different amounts of catalyst concentration (Fig. 10), with the same degradation stages at 380, 430 and 470 °C. Thus the catalyst concentration did not influence the type of resulting material according to the thermal degradation profiles; the same occurred with the swelling results.


image file: c6ra13287a-f10.tif
Fig. 10 TGA and DTG (insert) of the samples from 60% NPO and different amounts of catalyst.

The TGA degradation curve of NPO shows a weight loss from approximately 250 to 500 °C, highlighting the loss centered at 430 °C (Fig. 11). The polyNBE shows degradation steps between 130 and 250 °C associated with free units of NBE and oligomers, and between 450 and 500 °C associated with degradation of polyNBE, with peaks for cis and trans structures, respectively.25,26 Comparing these curves with the curve from the sample with 60% NPO and molar ratio of 500, it is possible to verify the presence of cis and trans-polyNBE (insert Fig. 11). In addition, weight loss occurred at 430 and 450 °C, matching with the degradation range of the NPO. The maximum degradation at 430 °C is also observed in the curves depicted in Fig. 10 and 11.


image file: c6ra13287a-f11.tif
Fig. 11 TGA and DTG (insert) of the non-polymerized NPO, polyNBE and sample 60; 500.

This process indicates the degradation of a new material, such as poly(NPO-co-NBE), because this is not observed in the degradation of NPO or polyNBE. Moreover, a mass loss at 380 °C is typical of NPO, which was absent in the samples with 40% NPO. In the latter case, the maximum mass loss at 470 °C suggests the presence of a large block of poly-NBE, in agreement with the superior NBE amount in the starting composition.

The results from the TGA agree with those from the swelling experiments in chloroform, in which two soluble components were extracted and identified as being polyNBE and NPO. An unknown insoluble material remaining from the swelling test can be the copolymer poly(NPO-co-NBE), with maximum degradation at approximately 430 °C.

Conclusions

A novel monomer NPO from NBE modified with RPO-triglycerides was developed with the average of one NBE unit per NPO. Successful ROMP of NPO in the presence of pure NBE occurred, resulting in materials with physical state dependent on total NBE to catalyst ratio. On the other hand, in some NPO molecules, there might be several NBE functional groups within one NPO molecule, and therefore, the copolymerization products of NPO with NBE may have a crosslinked structure; this fact can explain some observed characteristics in the products. Soft solids were evaluated as polymer blends composed of poly(NPO-co-NBE) and polyNBE. Solubility in water, acetic acid, and many organic solvents failed. Swelling was greater in non-polar than in polar organic solvents. Chloroform found low resistance to enter the structure of the materials, with increasing weight of more than 500%. In general, the samples showed thermal stability up to 300 °C.

From the results, the synthesis of the new palm oil-based monomer, as well as its polymerization via ROMP, contributes to the development of renewable polymers. This study shows the viability of producing polymeric materials from palm olein, suggesting that saturated fatty acid rich oil is an alternative chemical source to produce a bio-based polymer network.

Acknowledgements

The authors are indebted to CAPES, CNPq and FAPESP for financial supports.

References

  1. R. Verhé, in Renewable Bioresources: Scope and Modification for Non-food Applications, ed. C. V. Stevens and R. Verhé, John Wiley & Sons, Ltd, 2004, pp. 208–250 Search PubMed.
  2. R. Malacea and P. H. Dixneuf, in Green Metathesis Chemistry: Great Challenges in Synthesis, Catalysis and Nanotechnology, ed. V. Dragutan, et al., Springer Science + Business Media B. V., 2010, pp. 185–206 Search PubMed.
  3. U. Biermann, U. Bornscheuer, M. A. R. Meier, J. O. Metzger and H. J. Schäfer, Angew. Chem., Int. Ed., 2011, 50, 3854–3871 CrossRef CAS PubMed.
  4. M. R. Islam, M. D. H. Beg and S. S. Jamari, J. Appl. Polym. Sci., 2014, 131, 1–13 CrossRef.
  5. L. Montero de Espinosa and M. A. R. Meier, Eur. Polym. J., 2011, 47, 837–852 CrossRef CAS.
  6. C. W. Bielawski and R. H. Grubbs, Prog. Polym. Sci., 2007, 32, 1–29 CrossRef CAS.
  7. P. H. Sandstrom, P. Zhang, X. Yang, J. J. Kulig, A. S. Puhala and R. L. Dando, Rubber composition and pneumatic tire therewith, EP2179865B1, 2012, vol. 1, pp. 1–16.
  8. W. S. Anderson, Polynorbornene-based combustible compositions and processes for the fabrication thereof, U. S. Pat., US4416710A, 1983.
  9. B. Wang, K. Mireles, M. Rock, Y. Li, V. K. Thakur, D. Gao and M. R. Kessler, Macromol. Chem. Phys., 2016, 1–9 Search PubMed.
  10. S. Sutthasupa, K. Terada, F. Sanda and T. Masuda, Polymer, 2007, 48, 3026–3032 CrossRef CAS.
  11. Bio-based plant oil polymers and composites, ed. S. A. Madbouly, C. Zhang and M. R. Kessler, Elsevier, 1st edn, 2016 Search PubMed.
  12. M. A. R. Meier, J. O. Metzger and U. S. Schubert, Chem. Soc. Rev., 2007, 36, 1788–1802 RSC.
  13. Y. Xia, P. H. Henna and R. C. Larock, Macromol. Mater. Eng., 2009, 294, 590–598 CrossRef CAS.
  14. Y. Xia, Y. Lu and R. C. Larock, Polymer, 2010, 51, 53–61 CrossRef CAS.
  15. Y. Xia and R. C. Larock, Polymer, 2010, 51, 2508–2514 CrossRef CAS.
  16. K. Haman, P. Badrinarayanan and M. R. Kessler, Polym. Int., 2009, 58, 738–744 CrossRef CAS.
  17. O. I. Mba, M.-J. Dumont and M. Ngadi, Food Biosci., 2015, 10, 26–41 CrossRef CAS.
  18. D. R. Lehnen, R. Guzatto, D. Defferrari, L. L. Albornoz and D. Samios, Environ. Chem. Lett., 2014, 12, 335–340 CrossRef CAS.
  19. A. Durbetaki, Anal. Chem., 1956, 28, 5–6 CrossRef.
  20. F. W. Billmeyer Jr, Textbook of Polymer Science, Wiley, New York, 3rd edn, 1984 Search PubMed.
  21. E. F. Lucas, B. G. Soares and E. E. C. Monteiro, Caracterização de Polímeros: Determinação de peso molecular e análise térmica, E-Papers, Rio de Janeiro, 1st edn, 2001 Search PubMed.
  22. A. Barison, C. W. P. da Silva, F. R. Campos, F. Simonelli, C. A. Lenz and A. G. Ferreira, Magn. Reson. Chem., 2010, 48, 642–650 CAS.
  23. P. H. Henna and R. C. Larock, Macromol. Mater. Eng., 2007, 292, 1201–1209 CrossRef CAS.
  24. V. P. Carvalho, C. P. Ferraz and B. S. Lima-Neto, Eur. Polym. J., 2012, 48, 341–349 CrossRef CAS.
  25. K. Sakurai, T. Kashiwagi and T. Takahashi, J. Appl. Polym. Sci., 1993, 3, 937–940 CrossRef.
  26. W. Fischer, K. D. Aichholzer and F. Stelzer, J. Mol. Catal. A: Chem., 1997, 169, 163–171 Search PubMed.

Footnote

Electronic supplementary information (ESI) available. See DOI: 10.1039/c6ra13287a

This journal is © The Royal Society of Chemistry 2016
Click here to see how this site uses Cookies. View our privacy policy here.