Yanxiu Liab,
Jun Meib,
Xiaodong Guoa,
Benhe Zhong*a,
Hao Liub,
Guobiao Liu*b and
Shixue Douc
aSchool of Chemical Engineering, Sichuan University, Chengdu 610065, China. E-mail: zhongbenhe@163.com
bChengdu Green Energy and Green Manufacturing Technology R&D Center, Chengdu Development Center of Science and Technology, China Academy of Engineering Physics, Chengdu 610207, China. E-mail: guobiaoliu@sina.com
cInstitute for Superconducting and Electronic Materials, University of Wollongong, Wollongong, NSW 2522, Australia
First published on 18th July 2016
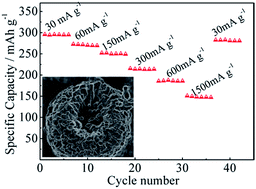
Hollow Li1.2Mn0.54Ni0.13Co0.13O2 micro-spheres were successfully synthesized by a co-precipitation method. The micro-spheres deliver an initial discharge capacity of 296 mA h g−1 and a coulombic efficiency of 83.4% at a current density of 30 mA g−1. Furthermore, the micro-spheres exhibit an excellent rate capability (150 mA h g−1 at a current density of 1500 mA g−1) and a high reversible discharge capacity of 227 mA h g−1 after 100 cycles at a current density of 60 mA g−1.
In order to further improve the high energy densities of LIBs, lithium-rich manganese-based layered (denoted as LMR) cathode materials have attracted extensive attentions and had even been considered as the most promising candidate for the next generation cathode materials of LIBs because of their high discharge capacity (∼250 mA h g−1) and high discharge voltage, preferable thermal stability and low cost of raw materials.8–10 However, pristine LMR cathode materials display poor rate capability and voltage fading during cycling, which is obstacle to the practical use.11,12
To date, many strategies including doping,13 coating14 and controlling particle size and morphology15 have been developed to improve the rate capabilities of LMR cathode materials. Furthermore, it has been confirmed that some special morphologies such as nano-rods,16–18 nano-sheets,19–21 nano-tubes22,23 or nano-plates24 are greatly helpful to the enhancement of rate capabilities of LMR cathode materials through shortening Li+ diffusion path or enhancing Li+ diffusion coefficient.25 In addition, hollow micro-particles of cathode materials have been reported to be in favor of the improvement of electrochemical performance due to their advantages as follows.26–32 Firstly, the cavities in hollow micro-particles could provide extra active sites for Li+ storage, which is beneficial for increasing the reversible capacity. Secondly, the hollow micro-sized particles consisted of nano-sized primary particles possess a larger surface area than solid micro-particles. The larger surface area provides more Li+ diffusion accesses to electrolyte, which contributes to the improvement of rate capability. Finally, the void space in the hollow micro-particles could offer an extra-space for volume expansion/contraction in the process of Li+ insertion/extraction, which could facilitate the improvement of cycling performance.
In the previous reports about the hollow micro-particles of the LMR cathode materials, due to its ease in controlling the morphologies of final products, carbonate precursor is widely used as a template to prepared hollow micro-particles.26,27,32 For examples, MnCO3 was used to prepare hollow 0.3Li2MnO30.7LiNi0.5Mn0.5O2 micro-spheres by Jiang et al. Furthermore, MnCO3 was also used to prepare hollow Li1.2Ni0.16Co0.08Mn0.56O2 micro-spheres by He et al. In addition, Co0.33Mn0.67CO3 was used to prepare hollow Li1.2Mn0.5Co0.25Ni0.05O2 micro-cubes by Shi et al. In the above reports, because another one or two kinds of transition elements were introduced into the target LMR cathode materials at the calcinations process, the different transition elements were inhomogeneously distributed, resulting in relatively poor electrochemical performances of target materials. The inhomogeneous distribution can be overcome by the co-precipitation method in which Mn1−x−yNixCoyCO3 or Mn1−x−yNixCoy(OH)2 is used as a precursor.30,31 Therefore, using Mn1−x−yNixCoyCO3 prepared by a co-precipitation method as a template for the hollow structures is expected to further improve the electrochemical performances of the target Li-rich manganese-based materials, an attempt which has not been reported before.
In this work, we demonstrate that the hollow Li1.2Mn0.54Ni0.13Co0.13O2 micro-spheres can be prepared by using Mn0.675Ni0.1625Co0.1625CO3 as a template. Compared to hollow micro-spheres prepared by using MnCO3 as a template or hollow micro-cubes prepared by using Co0.33Mn0.67CO3 as a template, the hollow micro-spheres prepared by using Mn0.675Ni0.1625Co0.1625CO3 as a template exhibit a higher reversible capacity and a better rate capability.
As a comparison, lithium-rich manganese-based layered cathode material with the same component was also synthesized by traditional solid-state reaction process. LiOH·H2O, MnO2, NiO and Co3O4 in a molar ratio of 1.2:
0.54
:
0.13
:
0.13 were mixed by ball-milling in ethanol for 12 h. After dried, the mixtures were calcined at 500 °C for 5 h in air and then sintered at 900 °C for an additional 12 h. The final product was denoted as s-LMNC because it displays solid irregular particles.
The crystal structure of sample was characterized by powder X-ray diffraction (XRD, Philips, X′ pert TRO MPD) using Cu Kα radiation (λ = 1.5418 Å) at 40 kV/25 mA at 0.06° s−1. The morphology was examined by scanning electron microscopy (SEM, Hitachi S-4800). The elemental analysis was conducted by energy-dispersive X-ray spectrometer (EDX, QUANTAX400). The compositions of samples were measured by inductively coupled plasma (ICP, Perkin Elmer, Optima 8000). Nitrogen adsorption isotherm was obtained at a monosorb surface area analyzer (Quantachrome, Autosorb-6B). Mercury porosimetry curves were gained at a mercury porosimetry (Quantachrome, poremaster33). The XPS spectra were attained using a PHI spectrometer (Perkin-Elmer, American) with monochromatic Mg Kα radiation (hv = 1253.6 eV). Binding energies were charge corrected using the C 1s peak (284.8 eV). Transmission electron microscopy (TEM) observations were carried out on a FEI Tecnai G2 F20 S-TWIN 200 kV.
The electrochemical properties of the sample were tested in CR2032 coin-type lithium half-cells. To prepare the positive electrode, 80 wt% as-synthesized active materials, 15 wt% acetylene black and 5 wt% polyvinylidene fluoride (PVDF) were dissolved in N-methyl-2-pyrrolidone (NMP). The slurry was coated uniformly on the aluminum foil which was selected as the current collector of the positive electrode. The cathode film was dried at 120 °C overnight in a vacuum oven. The dried loading mass is about 6 mg cm2−. A lithium metal foil was used as a negative electrode. A porous polyethylene film (Celgard 2500) was selected as separator. The electrolyte is a solution of LiPF6 in ethylene carbonate, dimethyl carbonate and ethyl methyl carbonate (VEC:
VDMC
:
VEMC = 1
:
1
:
1). Finally, the cells with coin-type cells (CR2032) were assembled in an argon-filled glove box with H2O concentration below 1 ppm. The galvanostatic charge–discharge tests were performed on an Arbin instrument (BT-2043) in a voltage range between 2.0 and 4.8 V at current densities from 30 mA g−1 to 1500 mA g−1 at room temperature. Electrochemical impedance spectroscopy (EIS) measurements were conducted on a PARSTAT 4000 electrochemical workstation in the frequency range from 100 KHz to 0.01 Hz and in the perturbation amplitude of 10 mV.
ICP analysis was taken to confirm the chemical composition by measuring the atomic ratios of Li, Mn, Ni and Co in s-LNCM and h-LNCM. The calculated atomic ratios are shown in Table S1 (ESI†) and are approximately in accordance with those of Li1.2Mn0.54Ni0.13Co0.13O2, a result which implies the homogeneous reaction during calcination process at a high temperature. In addition, the XPS measurement was conducted to determine chemical valence states of Mn, Ni, and Co. As shown in Fig. 2, the XPS spectra of h-LMNC and s-LMNC are similar. The binding energy of Mn 2P1/2 and Mn 2P3/2 peaks of both sample are around 654.2 eV and 642.6 eV, respectively, which suggest a single valence of Mn4+.33 The binding energy of Co 2P1/2 and Co 2P3/2 peaks of both sample are around 795.2 eV and 780.2 eV, respectively, which indicate a single valence of Co3+. The binding energy of Co 2P1/2 and Co 2P3/2 peaks of both sample are around 795.2 eV and 780.2 eV, respectively, which indicate a single valence of Co3+.34 The binding energy of Ni 2P3/2 peaks of both sample are around 855.2 eV accompanied by a shake-up peak at about 861.0 eV, which is the characteristic of Ni2+.35 The chemical valence states of Mn, Ni, and Co of as-prepared sample are the same as those of lithium-rich manganese-based layered (denoted as LMR) cathode materials.36
Fig. 3a and b show the SEM images of Mn0.675Ni0.1625Co0.1625CO3 precursor at low and high magnifications. In Fig. 3a, some spheres with a diameter of about 3–8 μm and irregular particles with a diameter of less 3 μm are observed. The presence of irregular particles indicates the growing process of the spheres with a diameter of about 3–8 μm. In Fig. 3b, it is clear that the sphere is composed of numerous small particles. Fig. 3c and d show the SEM images of h-LMNC particles at low and high magnifications. It is obvious that the sphere morphology is retained after the addition of Li source and high temperature solid state reactions. Compared with Mn0.675Ni0.1625Co0.1625CO3 spheres, h-LMNC spheres display a rougher surface. Furthermore, a hole can be observed in some h-LMNC particles in Fig. 3c and can be clearly detected through EDX mapping images (Fig. S1, ESI†) and TEM image (Fig. 5d), the observations which indicate that the hollow spheres can be prepared using Mn0.675Ni0.1625Co0.1625CO3 as a template. The reason for the formation of hollow spheres can be explained as follows. According to the Kirkendall effect, during annealing process, transition metal ion Mn, Ni, and Co atoms rapidly migrate outward and then react with Li atoms to form Li1.2Mn0.54Ni0.13Co0.13O2. Meanwhile, the O atoms migrate inward. Half of the O atoms are released in the form of O2. Consequently, the Kirkendall effect leads to the formation of the hollow structure in the Li1.2Mn0.54Ni0.13Co0.13O2 micro-spheres.26,27,29 By comparison, as shown in Fig. 3e and f, s-LMNC presents irregular particles with a diameter range from 100 to 800 nm.
![]() | ||
Fig. 3 SEM images of (a, b) Mn0.675Ni0.1625Co0.1625CO3 precursor and (c, d) h-LMNC, (e, f) s-LMNC powders at different magnifications. |
Fig. 4 shows pore size distribution curves gained by nitrogen absorption method and mercury intrusion method. h-LMNC displays some pores with a diameter under 10 nm shown in Fig. 4a and a great amount of pores with a diameter around 3 μm shown in Fig. 4b. Pores with a diameter under 10 nm may be originated from the Mn0.675Ni0.1625Co0.1625CO3 precursor which generated CO2 gas during calcination. By contrast, s-LMNC presents a few pores with a diameter under 10 nm and a great amount of pores with a diameter around 350 nm. Pores with a diameter around 350 nm maybe arise from small opening due to the close contact between some primary particles. As listed in Tables S2 and S3 ESI,† h-LMNC demonstrate a larger specific surface area and pore volume attributed to the micro-sized pores. The larger surface area will increase the reactive site.36 The larger pore volume will offer an extra-space for volume expansion/contraction in the process of Li+ insertion/extraction.31,32
![]() | ||
Fig. 4 Pore size distribution curves of h-LMNC and s-LMNC obtained by (a) nitrogen absorption method and (b) mercury intrusion method. |
TEM and HR-TEM images provide more insight into the microstructure of Mn0.675Ni0.1625Co0.1625CO3 and h-LMNC particles. Fig. 5a shows the typical bright-field TEM image of Mn0.675Ni0.1625Co0.1625CO3 micro-sphere. Fig. 5c shows the HR-TEM image taken from the edge of a single Mn0.675Ni0.1625Co0.1625CO3 micro-sphere. The periodic fringe spacing is nearly 0.282 nm, which agrees well with interplanar spacing between the {104} planes of the rhombohedral MnCO3.37 This result further confirms the formation of Mn0.675Ni0.1625Co0.1625CO3 solid solution. Fig. 5d displays the typical TEM image of a h-LMNC micro-sphere. A distinct light–dark contrast is clearly observed in the micro-sphere, suggesting the hollow nature of the h-LMNC micro-sphere. Fig. 5f shows the HR-TEM image taken from the edge of a single h-LMNC micro-sphere. The HR-TEM image demonstrates that the distance of 0.47 nm not only agrees well with the {003} lattice spacing of the rhombohedral phase of lithium nickel manganese cobalt oxide, but also the {001} planes for monoclinic Li2MnO3, indicating the formation of high crystalline oxide.38
![]() | ||
Fig. 5 TEM and HR-TEM images of (a–c) Mn0.675Ni0.1625Co0.1625CO3 precursor and (d–f) h-LMNC particle. |
Fig. 6 shows the initial charge–discharge curves and dQ/dV plots of h-LMNC and s-LMNC electrodes at a current density of 30 mA g−1 and a potential range of 2.0–4.8 V. The charge/discharge and dQ/dV profiles are similar to those in previous literatures.39 Two regions are clearly shown in the charge process. The region below 4.5 V is ascribed to the oxidation reactions of Ni2+ to Ni4+ and Co3+ to Co4+, which is confirmed by the oxidation peak around 4.0 V of the dQ/dV curve. The flat region above 4.5 V is attributed to the activation of the Li2MnO3 component and is associated with the extraction of Li+ and the oxidation of O2− to O− or O2, an observation which is confirmed by the intense oxidation peak at around 4.5 V of dQ/dV curve.40 While the charge curve displays two regions, the discharge curve is a smooth line. The corresponding dQ/dV plot includes three reduction peaks. The reduction peak about 4.5 V is related to the reduction of O− to O2−. The reduction peak around 3.7 V is associated with the reduction of Ni4+to Ni2+and Co4+ to Co3+. The biggest peak below 3.5 V is attributed to the reduction of Mn4+ to Mn3+.
![]() | ||
Fig. 6 Initial charge/discharge curves (a) and corresponding dQ/dV curves (b) of h-LMNC and s-LMNC electrodes. |
However, the significant difference between h-LMNC and s-LMNC electrodes is the discharge capacity. The discharge capacity of h-LMNC reaches to 296 mA h g−1, a capacity which is much higher than that of s-LMNC and is even higher than those of the hollow particles of lithium-rich manganese-based layered cathode materials in previous literatures.27,32,41 Compared with the low discharge capacity of s-LMNC, the high discharge capacity of h-LMNC can be ascribed to that the hollow structure facilitate the Mn4+ to Mn3+ reduction reaction. The conclusion is confirmed by the big Mn4+ to Mn3+ reduction perk in the dQ/dV plot of h-LMNC, as shown in Fig. 6b. Moreover, the initial coulombic efficiency is as high as 83.4% which is higher than the 75.3% and 75.2% reported in previous literatures of hollow spheres using MnCO3 and Co0.33Mn0.67CO3 as a template, respectively.27,32
The comparison of rate capability and cyclic performance between h-LMNC and s-LMNC is exhibited in Fig. 7. The rate capabilities were recorded at different current density from 30, 60, 150, 300, 600 and 1500 mA g−1 for each 6 cycles. The discharge specific capacities of h-LMNC are 296, 274, 252, 212, 187 and 150 mA h g−1 at current densities of 30, 60, 150, 300, 600 and 1500 mA g−1, respectively. By comparison, the discharge specific capacities of s-LMNC are 249, 222, 191, 170, 138 and 91 mA h g−1. In fact, the rate capability of h-LMNC is better than those of the hollow particles prepared by using MnCO3 or Co0.33Mn0.67CO3 as a template.26,27,32 To further investigate the cyclic performance, cells of h-LMNC and s-LMNC were cycled for 100 cycles at a current density of 60 mA g−1 after 6 cycles at a current density of 30 mA g−1 and were cycled for 100 cycles at a current density of 1500 mA g−1 after cycling at a current density of 600 mA g−1, respectively. The capacity retention of h-LMNC is 84.7% and 95.2%, respectively. However, the capacity retention of s-LMNC is 76.3% and 93.8%, respectively. As shown in Fig. 7c and e, compared with s-LMNC, h-LMNC also demonstrates a slower voltage decay, which is further confirmed by the dQ/dV curves in Fig. 7d and f. The reduction peak of h-LMNC at the discharge curve of the 100th cycle is around 2.85 V while that of s-LMNC is about 2.7 V.
![]() | ||
Fig. 7 Rate capability (a) and cyclic performance (b) of h-LMNC and s-LMNC electrodes. The charge/discharge curves (c, e) and corresponding dQ/dV curves (d, f) of at a current density of 60 mA g−1. |
Electrochemical impedance spectra measurements were conducted to shed light on the better electrochemical performance of h-LMNC. The Nyquist plots were obtained using cells cycled at the charge state of 4.5 V after initial cycle at a current density of 30 mA g−1 and 100 cycles at a current density of 60 mA g−1. Fig. 8 shows the Nyquist plots of h-LMNC and s-LMNC. These Nyquist plots display similar shape and are made up of a high-frequency semicircle and a low-frequency oblique line. These Nyquist plots were fitted using ZSimpWin software and an equivalent circuit shown in inset of Fig. 8. In the equivalent circuit, Re represent the resistive contribution from electrolyte resistance and cell components. RSEI and CPEf are the resistance and capacitance of solid electrolyte interface (SEI) film, respectively. Rct and CPEdl represent the charge transfer resistance and associated double layer capacitance. Zw is the Warburg impedance. The fitting data are listed in Table S4 (ESI†). It is clear that the Rct values of h-LMNC electrode after initial cycle and 100 cycles are much smaller than those of s-LMNC. As reported in previous literature,36 the smaller Rct values can be ascribed to the secondary spherical morphology with large pores which will facilitate the Li+ to travel from the electrolyte to the electrolyte to the solid material because the pores are benefit for the contract between electrolyte and the particle surface. Moreover, the connected points between the primary particles offer channels for the transfer of electron in the spherical particles.
![]() | ||
Fig. 8 Nyquist plots of h-LMNC and s-LMNC (a) after initial cycle, (b) after 100 cycles. Inset shows a corresponding equivalent circuit. |
Footnote |
† Electronic supplementary information (ESI) available: Fig. S1 and Tables S1–S4. See DOI: 10.1039/c6ra13265k |
This journal is © The Royal Society of Chemistry 2016 |