Novolac-derived carbon aerogels pyrolyzed at high temperatures: experimental and theoretical studies

Ahmad Allahbakhsh and Ahmad Reza Bahramian*
Department of Polymer Engineering, Faculty of Chemical Engineering, Tarbiat Modares University, P.O. 14115-114, Tehran, Iran. E-mail: abahramian@modares.ac.ir

Received 18th May 2016 , Accepted 26th July 2016

First published on 27th July 2016


Abstract

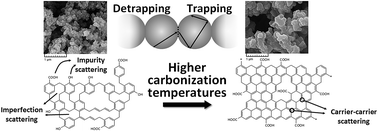
Microstructural characteristics of carbon aerogels dictate the conductance performance of these materials, as carrier transport in a porous carbon media highly depends on the carrier scattering rate. Here, we explore the influences of the carbonization temperature on the microstructural and textural characteristics of the novolac-derived carbon aerogels. A high-temperature carbonization process leads to the elimination of –OH groups from the molecular structure of the novolac-derived carbon aerogels, which in turn results in a reduction of the impurity scattering rate along the carrier transport pathway. Although, the density of the novolac-derived carbon aerogels increases with carbonization temperature, the content of micropores grows at higher temperatures, as the extent of –OH groups leaving the structure of carbon aerogels in the form of volatile gases increases at the higher pyrolysis temperatures. Moreover, the size and perfection of the nanocrystallite sites increase with carbonization temperature and hence, the imperfection scattering effect reduces at higher pyrolysis temperatures. As the carrier scattering rates decrease, the electrical conductivity and thermal conductivity of the novolac-derived carbon aerogels enhance with the pyrolysis temperature. In addition, an analytical modified series-parallel thermal conductivity model is presented here, and this model is used successfully for predicting the thermal conductivity of carbon aerogels derived from different organic precursors, and under different service conditions. No fitting parameters are involved in this model, and the only input data needed for the prediction procedure are microstructural characteristics of the carbon aerogels.


Introduction

Nowadays, the term “carbon aerogel” covers a wide range of porous carbon materials, from classic pyrolyzed carbon aerogels to self-assembled graphene and carbon nanotubes aerogels.1 From the very first introduction of carbon aerogels by Pekala and coworkers in the 1990s,2 this class of porous materials has attracted great interest for potential applications in many different general and specific fields such as: electrochemical systems,3–6 catalysts,7,8 hydrogen storage applications,9,10 electromagnetic wave absorption,11 and thermal insulating applications.12–14 The main features that make carbon aerogels perfect candidates for such a wide range of applications are high specific surface area and low density of these materials.1

The conventional procedure for the fabrication of carbon aerogels is the pyrolysis of organic precursors.15 Resorcinol/formaldehyde organic aerogels are the most prevalent precursors for the fabrication of carbon aerogels.2,3 However, other organic precursors can also be used for preparing carbon aerogels through the carbonization process.1,6,11 Novolac aerogels are a class of hyper-porous organic aerogels with high surface area and low density,16,17 used widely for the fabrication of carbon aerogels.18–21 Just like other carbon aerogels, the microstructure of novolac-derived carbon aerogels highly depends on sol–gel polymerization and the carbonization conditions.18 The microstructure of carbon aerogels is an important characteristic of these materials, as the structural characteristics of carbon aerogels dictate the conductance performance and functional properties of these porous materials.

To the best knowledge of the authors, there are just limited studies on the influences of carbonization conditions on microstructure and conductance performance of carbon aerogels, and there are no systematic studies on the carbonization process of the novolac-derived carbon aerogels. Hanzawa et al.22 studied the influences of the high-temperature heat treatment process on the microstructure of the resorcinol-formaldehyde-derived carbon aerogels, and they noted that the resorcinol-formaldehyde-derived carbon aerogels were non-graphitizing carbons.22 Therefore, the microstructure of these materials includes a strong system of crosslinking bonded the crystallites and formed a finely porous mass.23 Wiener et al.13 investigated the influences of the high-temperature pyrolysis process on the thermal conductance of the resorcinol-formaldehyde-derived carbon aerogels. Their study demonstrated that the thermal conductivity of carbon aerogels increases with pyrolysis temperature.13

Here, the influences of the high-temperature carbonization process on the microstructural and the conductance performance of the novolac-derived carbon aerogels are studied in details. In particular, the mechanisms involved in the carrier transport in hyper-porous carbon aerogels are studied in details and the impacts of the microstructural variations at different carbonization temperatures on these mechanisms are investigated. Discussions presented here can provide insights into the reasons behind thermal conductivity performance of carbon aerogels carbonized at high temperatures. Moreover, an analytical thermal conductivity model is presented here for predicting the thermal conductivity of carbon aerogels. The central hypothesis of this work is that there is a close relation between microstructural characteristics and thermal conductivity performance of carbon aerogels. Therefore, microstructural characteristics are incorporated into the presented thermal conductivity model to increase the reliability of the model.

Experimental

Synthetic procedures

The detailed sample preparation conditions are described in ESI. Novolac aerogels were prepared according to the method described in the literature.24 Fabricated novolac aerogel was labeled as Novolac. Carbon aerogels were prepared through pyrolysis of Novolac aerogels. Carbon aerogels fabricated through the carbonization process of Novolac at 600, 800, 1000, 1200, 1400 and 1600 °C final temperatures were labeled as CA-600, CA-800, CA-1000, CA-1200, CA-1400 and CA-1600, respectively (see ESI for details of fabrication procedures).

Characterizations

Thermogravimetric analysis (TGA) was made by using a Mettler Toledo Thermogravimetric Analyzer. Samples were heated with a heating rate of 10 °C min−1 under nitrogen atmosphere. Fourier transform infrared (FTIR) results were obtained on a Perkin-Elmer FTIR spectrometer. Field emission scanning electron microscopy (FESEM) images were carried out using a TESCAN Mira II scanning electron microscope. X-ray powder diffraction (XRD) patterns were obtained using a Philips X'Pert MPD diffractometer (Cu Kα radiation). Raman spectra of fabricated aerogels were recorded on an Almega Thermo Nicolet Dispersive Raman spectrometer at ambient conditions. The spectral range of Raman observations was 100–4200 cm−1. The Raman spectrometer was equipped with a Nd:YLF laser (532 nm) with a resolution of 4 cm−1 and a final laser power of 100 mW. Mercury porosimetry experiments were conducted on a Thermo Finnigan Pascal 440 porosimeter. Moreover, a TICO ultrasonic testing instrument was used for the calculation of ultrasonic sound velocity values (equipped with 54 kHz transducers, three experiment repeats for each sample). N2 adsorption isotherms were recorded on a Belsorp-mini II volumetric adsorption measurement instrument. Brunauer, Emmett and Teller (BET), Barrett, Joyner and Halenda (BJH) and t-plot theories were fitted on the isotherms for the calculation of textural parameters. Electrical characteristics were recorded on a GW INSTEK LCR-8101G LCR meter. All electrical measurements were performed at room temperature and in both DC and frequency-sweep AC modes. Moreover, thermal conductivity values were calculated using the hot-disk method (details for the used device were reported previously20).

Modified series–parallel (MSP) model

In general, thermal conductivity models can be classified into three main categories: (1) empirical models, (2) numerical models and (3) analytical models.25 One or more experimental factors are usually involved in the empirical models. As a result, fitting factors control the output of these models.25 Compared to the empirical models, numerical models are more accurate and experimental-fitting-factor-free. However, predictions by these models are usually time-consuming and complicated.25 The most applicable class of thermal conductivity models is the analytical models. In these models, the overall thermal conductivity is usually predicted through generalizing the thermal conductivity of a structural element, which represents the structural characteristics of a material.

There are a number of analytical thermal conductivity models in the literature for the prediction of different contributions to the thermal conductivity of aerogel structures.26–31 Moreover, there are different total thermal conductivity models for predicting the overall thermal conductivity of an aerogel structure.32–34 Most of these models present the overall thermal conductivity of an aerogel as a summation of gaseous, radiative, and solid thermal conductivity contributions. Among these models, the model proposed by Zhao et al.,25–27 not only presents a set of equations for accurate predicting the thermal conductivity of aerogel structures by incorporating the solid–gas coupling effect, but also contains multiple structural parameters, which can be used to relate the thermal conductivity of an aerogel to its structural characteristics.

In this work, based on the molecular structure of aerogels, the analytical series–parallel thermal conductivity model, originally presented by Zhao et al.,25–27 was modified and accordingly, a modified series–parallel (MSP) model was presented. The total thermal conductivity of an aerogel structure (ktotal) can be expressed as:25

 
image file: c6ra12947a-t1.tif(1)
where, kr is the radiative thermal conductivity, which is proportional to the third power of aerogel temperature, and kc is the thermal conductivity due to both conduction and convection in aerogel structure. As presented in eqn (1), the Rosseland radiative diffusion approximation35 is used in the MSP model for the calculation of kr (kr = 16n2σT3/3βa). In this equation, n is the average refraction index of aerogel, σ is the Stefan–Boltzmann constant (σ = 5.67 × 10⁻⁸ W m−2 K−4), T is the aerogel temperature (K), and βa is the mean extinction coefficient.

In the MSP model, the aerogel unit cell is assumed to be consisted of two kinds of elements: white and red cubic elements (see Fig. 1 for more details). Thermal conductivity inside white cubic elements represents the gaseous thermal conductivity of aerogel, caused by heat transfer via gas molecules trapped inside macro- and mesopores. Micropores are assumed to exist only inside secondary-nanoparticle-containing cubic elements (red cubic elements in Fig. 1(b)). Therefore, thermal conductivity inside red cubic elements represents the thermal conductivity of porous secondary nanoparticles consisted of fully-dense primary nanoparticle clusters and micropores (Fig. 1(a)).


image file: c6ra12947a-f1.tif
Fig. 1 Elements of the MSP model: (a) a secondary-nanoparticle-containing cubic element, (b) a unit cell consisted of secondary-nanoparticle-containing and pure-gas-containing cubic elements, and (c) coupling-effect-related portions of a secondary-nanoparticle-containing cubic element.

It is also assumed that the thermal conductivity in an aerogel structure due to the solid–gas coupling effect only presents inside secondary-nanoparticle-containing cubic elements (red cubic elements). Consequently, kc in the MSP model, which represents the thermal conductivity in an aerogel structure due to solid backbone and gas molecules, is expressed as:

 
image file: c6ra12947a-t2.tif(2)
where φa is the fraction of macro- and mesopores (white cubic elements) in a unit cell, B1 is the distribution factor of series–parallel model, kg is the gaseous thermal conductivity due to gas molecules inside a white cubic element, and ks-ce is the thermal conductivity inside a secondary-nanoparticle-containing red cubic element. Eqn (2) is an improved version of the modified equation presented by Hamilton and Crosser36,37 for the prediction of thermal conductivity in a two-phase system via Maxwell–Eucken model.

As shown in Fig. 1(c), the volume ratio of coupling-effect-related portions of a red cubic element (Vce = (alcontact)3: the total volume of cubes labeled as 1 to 8 in Fig. 1(c)), to the volume of a cubic element (Vtotal = a3), can be expressed as:

 
image file: c6ra12947a-t3.tif(3)

Using the definitions of the side length of a cubic element (a = √(dpart2lcontact2), dpart: the diameter of the secondary nanoparticle in Fig. 1(a)), the contact length between two adjacent secondary nanoparticles (lcontact in Fig. 1(a)), and the non-dimensional contact length of a cubic element (C1 = lcontact/a), B1 is defined as:

 
image file: c6ra12947a-t4.tif(4)

Eqn (4) represents the ratio of the secondary-nanoparticle-containing cubic elements' fraction in a unit cell (1 − φa), to the volume ratio of cubic element portions related to the solid–gas coupling-effect (1 − (1 − C1)3). In the MSP model, φa is defined based-on the output of the diffusion-limited cluster–cluster aggregation (DLCA) Monte Carlo method. Based on DLCA studies,38–40 the number of cubic elements (N) in a unit cell with side length of N1 is proportional to the density of aerogel (ρa) and the total volume of the unit cell. N can be expressed as:

 
N = aN13 (5)
where ρa is the density of the aerogel, and A is a proportional factor, which its value can be obtained from DLCA simulations. Based on simulation results, parameter A for an aerogel structure can be expressed as: A = 6/π.38,39 Consequently, using N as the number of secondary-nanoparticle-containing cubic elements in a unit cell, φa is defined as:
 
image file: c6ra12947a-t5.tif(6)

The parameter va in eqn (6) is the specific volume of filling gas (≈1 m3 kg−1 for air). By using eqn (5) and (6), one of the most important parameters in the MSP model, φa, can be calculated directly from the density of aerogel.

Gaseous thermal conductivity in an aerogel, due to the heat transfer of gas molecules trapped in the macro- and mesopores (kg), is calculated using the analytical model originally presented by Zeng et al. for the calculation of the gaseous thermal conductivity in a porous medium:29

 
image file: c6ra12947a-t6.tif(7)
where γ, R, T, p, Mg, mg and kB are the specific heat ratio (adiabatic coefficient), the universal gas constant (R = 8.314 J mol−1 K−1), temperature, pressure, molar mass of gas molecules, the mass of gas molecules, and the Boltzmann constant (kB = 1.381 × 10⁻²³ J K−1), respectively. Moreover, cv, Sa, ρa and dg are the specific heat of gas molecules, the specific surface area of aerogel, the density of aerogel, and the diameter of gas molecules, respectively.

By introducing specifications of air (as the filling gas) into eqn (7), Zeng's model is represented as:

 
image file: c6ra12947a-t7.tif(8)
where T and p are temperature (K) and pressure (bar), respectively. Moreover, φg in eqn (8) is the porosity of the aggregate structure, which represents all the structural portions of a unit cell involved in gaseous thermal conductivity through macro- and mesopores (including gaps between adjacent secondary nanoparticles). This parameter is defined as:25
 
φg = φa + φgap (9)

The parameter φgap in eqn (9) is the volume fraction of the aerogel aggregate structure involved in the solid–gas coupling effect, and is expressed as:

 
φgap = (1 − C1)3(1 − φa) (10)

Thermal conductivity inside a secondary-nanoparticle-containing red cubic element (ks-ce) is based on two heat transfer mechanisms: (1) thermal conductivity through micropores-containing porous secondary nanoparticles (kpart) and, (2) thermal conductivity due to solid–gas coupling effect (kce). As shown in Fig. 1(a), secondary nanoparticles are assumed to be aggregates of primary nanoparticles, and to only contain micropores. Therefore, the thermal conductivity of these porous secondary nanoparticles (kpart) is assumed to be a random distribution of: (a) the solid thermal conductivity of fully-dense primary spherical nanoparticles (kpart,s), and (b) the gaseous thermal conductivity of gas molecules trapped inside micropores (kpart,g). The Maxwell's model37,41 is used to express series-parallel relation between kpart,s and kpart,g, as:25

 
image file: c6ra12947a-t8.tif(11)
where φpart is the microporosity of a red cubic element, which is defined as:25
 
image file: c6ra12947a-t9.tif(12)

Π in eqn (12) is the total porosity of aerogel (Π = 1 − ρa/ρs, ρa is the density of aerogel and ρs is the skeleton density). As shown in Fig. 1(a), kpart,g represents the gaseous thermal conductivity in a micropores-containing-cluster of primary nanoparticles. Therefore, kpart,g can be considered as the gaseous thermal conductivity of a porous medium of primary nanoparticles and micropores. The Zeng's model is used to calculate kpart,g in the MSP model:

 
image file: c6ra12947a-t10.tif(13)
where Spart,b and ρpart,b are the surface area of micropores in nitrogen adsorption test (Smicro in N2 adsorption analysis), and the density of secondary nanoparticles (the density of aerogel without macro- and mesopores), respectively. The density of secondary nanoparticles can be calculated from:
 
ρpart,b = ρs(1 − φpart) (14)

In the MSP model, primary nanoparticles are assumed to be fully-dense spherical particles, which connect together to form micropores-containing porous clusters. Therefore, the thermal conductivity of these nanoparticles can be calculated using the model proposed by Chen:42

 
image file: c6ra12947a-t11.tif(15)
where kpart,b is the solid thermal conductivity of a fully-dense primary nanoparticle (in this work, the bulk thermal conductivity of amorphous carbon), and apart is the non-dimensional diameter of primary nanoparticles, defined as:
 
image file: c6ra12947a-t12.tif(16)

The parameter rpart,b in eqn (16) is the radius of primary nanoparticles, which can be approximated using the definition of particle diameter in the BET theory43 (rpart,b = 3/(ρpart,bSpart,b)[thin space (1/6-em)]12). Moreover, lpart is the phonon mean free path of primary nanoparticles in the cluster form (clusters of primary nanoparticles, which form porous secondary nanoparticles through cluster–cluster aggregation), which can be approximated using Matthiessen's rule:31

 
image file: c6ra12947a-t13.tif(17)
where lV, lT and lS are phonon mean free paths caused by: the volumetric scattering (lV = 3kpart,b/(ρacvva), va is the ultrasonic sound velocity in the aerogel), the interfacial scattering between the contacting nanoparticles (lT = 3LTd, L = √(dpart2lcontact2), Td is the energy transmissivity and Td = 0.5 for contacting particles with the same bulk materials), and the boundary scattering (lS = lcontact), respectively.31 In this study, the bulk material of the fully-dense primary nanoparticles was amorphous carbon. The experimental values of kpart,b for amorphous carbon at different temperatures are extracted from plots reported by Ho et al.44 Eqn (18) represents the curve fitted to the extracted experimental data (see ESI for the extracted data and the fitted curve):
 
kpart,b = 9 × 10⁻¹³T4 − 1 × 10⁻⁹T3 − 2 × 10⁻⁶T2 + 0.0046T + 0.2482 (18)

The model presented by Swimm et al.,28 for the calculation of thermal conductivity in a porous spherical nanoparticle due to the solid–gas coupling effect, is used in the MSP model for the calculation of kce. Swimm et al. used Zehner's cylindrical unit cell (see Fig. 2(a)) to calculate thermal conductivity due to the solid–gas coupling effect in spherical nanoparticles. Based on this model,28 thermal conductivity in a nanoparticle can be assumed to be due to parallel heat transfer in i number of co-centered hollow cylindrical unit cells (see Fig. 2(a) and (b)).


image file: c6ra12947a-f2.tif
Fig. 2 Schematic presentation of coupling-effect-related portions of a red cubic element: (a) coupling-effect-related heat transfer pathways, (b) cross-section area of a spherical nanoparticle in the Swimm model, (c) cross-section area of coupling-effect-related portions of a secondary nanoparticle in the MSP model, (d) coupling-effect-related portions of a red cubic element in the MSP model, and (e) cross-section area of a coupling-effect-related co-centered hollow cylindrical unit cells in the MSP model.

As noted by Swimm et al.,28 their model is only reliable for spherical nanoparticles (the cross-section area of spherical nanoparticles in Swimm model is depicted in Fig. 2(b)). However, the geometry of nanoparticles in the MSP model is not a full spherical geometry (due to contact length between adjacent nanoparticles), as shown in Fig. 2(c). Consequently, only coupling-effect-related portions of a red cubic element (cubes labeled as 1 to 8 in Fig. 1(c)) are considered for calculation of kce in the MSP model. As shown in Fig. 2(d) and (e), these portions of a red cubic element form a fully spherical nanoparticle with a radius of hgap (hgap = (alcontact)/2[thin space (1/6-em)]25). The cross-section area of co-centered hollow cylindrical unit cells in this spherical nanoparticle (Fig. 2(e)) is applicable for calculation of kce using the Swimm's model. Based on the Swimm's model, kce in the MSP model for N2 number of co-centered hollow cylindrical unit cells is expressed as:

 
image file: c6ra12947a-t14.tif(19)
where φpart,b is the porosity of spherical nanoparticles with the radius of hgap. This parameter represents the intraparticle porosity of nanoparticles, and based on the Swimm's model28 is defined as:
 
image file: c6ra12947a-t15.tif(20)

Di, yi and Ai in eqn (19) are the total height of the gas phase (Di = 2hgapyi), the total height of the solid phaseimage file: c6ra12947a-t16.tif, and the cross-section area of the respective co-centered hollow cylindrical unit cell, respectively (see Fig. 2(e)). Based on Swimm's model, Ai, the cross-section area of i-th co-centered hollow cylindrical unit cell, is defined as:

 
image file: c6ra12947a-t17.tif(21)

Moreover, kg,i in eqn (19) is the thermal conductivity of gas molecules through length Di of the i-th cylindrical unit cell in Fig. 2(e), and is defined as:25,27

 
image file: c6ra12947a-t18.tif(22)
where C2 is a constant to characterize the energy transfer efficiency for gas molecules, and is expressed as:27,33
 
image file: c6ra12947a-t19.tif(23)

The parameter α in eqn (23) is the accommodation coefficient and γ is the adiabatic coefficient. Moreover, the parameter kg0 in eqn (22) is the gaseous thermal conductivity of the filling gas in a free space. The variations of kg0 with temperature for air can be calculated from eqn (24):25

 
kg0 = 1.6241 × 10⁻³ + 8.4799 × 10⁻⁵T + 2.8585 × 10⁻⁹T2 − 3.7581 × 10⁻¹¹T3 + 1.6705 × 10⁻¹⁴T4 (24)

The parameter lce in eqn (22) is a modified gas mean free path, presented by Zhao et al.27 for the gaseous thermal conductivity in the gaps between two adjacent nanoparticles as:25,27

 
image file: c6ra12947a-t20.tif(25)
where lg is the gas mean free path in free space (lg = (kBT)/(√2πdg2p)) and B is a parameter related to the ratio of lg/ls (B = (1 + lg/ls)/2).25,27

Finally, the thermal conductivity inside a red cubic element (ks-ce) can now be expressed as:

 
ks-ce = (1 − ((1 − C1)3))kpart + kce (26)

The MSP model, presented through eqn (1) to (26), is a complete model for predicting the thermal conductivity of aerogel structures. The experimental inputs needed for predictions using this model include dimensional characteristics of secondary nanoparticles (lcontact and dpart), dimensional characteristics of pores (Sa[thin space (1/6-em)]:[thin space (1/6-em)]SBET and Spart,b[thin space (1/6-em)]:[thin space (1/6-em)]Smicro), the density of aerogel (ρa) and the ultrasonic sound velocity of aerogel (va). The MSP model was used here for predicting the thermal conductivity of novolac-derived carbon aerogels.

The procedure followed for the prediction of thermal conductivity values using the MSP model was as following: (1) calculating the number of cubic elements (N) using eqn (5), (2) calculation of φa from eqn (6), (3) calculation of B1 using eqn (4), (4) calculation of φg and φgap using eqn (9) and (10), respectively, (5) calculation of kg using φg and eqn (8), (6) calculation of φpart from eqn (12), (7) calculation of kpart,g from eqn (13) and (14), (8) calculation of kpart,s using eqn (15)–(18), (9) calculation of kpart from kpart,g, kpart,s, φpart and eqn (11), (10) calculation of kce using eqn (19)–(25), (11) calculation of ks-ce using kpart, kce and eqn (26), (12) calculation of kc using eqn (2), and (13) calculation of ktotal using eqn (1). Compared to other models presented in the literature for predicting the thermal conductivity of aerogel structures,25–27 there are no fitting parameters in the MSP model and therefore, the thermal conductivity of carbon aerogels can be predicted using this model with an acceptable precision.

Results and discussion

Structural studies

Influences of carbonization temperature on the structural performance of novolac-derived carbon aerogels were studied using different characterization methods. FTIR, Raman and XRD studies revealed that the carbonization process resulted in three simultaneous phenomena: (1) elimination of –OH groups from novolac structure, (2) formation and growth of nanocrystallites in the structure of carbon aerogels with both sp2 and sp3 carbons, and (3) formation of –COOH groups at the edges of nanocrystallites. Based on FTIR results (see ESI for FTIR spectra of fabricated aerogels), the pyrolysis of Novolac at 600 °C resulted in the partial elimination of –OH groups and partial rearrangement of carbon atoms. The molecular structure of novolac, proposed originally by Maji et al. base on 13C NMR studies of novolac resins,45 is schematically represented in Fig. 3. Through the carbonization process of Novolac at 600 °C, the characteristic peaks of para-, meta- and ortho-disubstitutions disappeared from FTIR results. Moreover, peaks related to the –COOH groups appeared in the FTIR spectrum of CA-600. Furthermore, the intensity of peak related to the linkage methylene groups decreased through the carbonization process at 600 °C. However, the presence of this band in the FTIR spectrum of CA-600 revealed that the rearrangement of the novolac structure at 600 °C was partial.
image file: c6ra12947a-f3.tif
Fig. 3 Molecular structure of the novolac-derived carbon aerogels.

The band related to the linkage methylene groups disappeared in the FTIR spectrum of CA-800. Moreover, the intensity of bands related to the –COOH groups increased noticeably through the carbonization at 800 °C. Consequently, the extent of rearrangement of novolac structure increased considerably through the pyrolysis at 800 °C, as shown schematically in Fig. 3. The carbonization of Novolac at higher temperatures led to an increase in the contents of C[double bond, length as m-dash]C bonds and –COOH edge-groups. XRD and Raman results were used to further investigate the structural variations of fabricated aerogels through the high-temperature carbonization process, as summarized in Table 1 (see ESI for XRD patterns and Raman spectra of fabricated aerogels).

Table 1 Microstructural characteristics of fabricated aerogelsa
Aerogel type XRD Raman
Peak center (°) FWHM (radian) La (Å) G position (cm−1) ID/IG
a FWHM: full-width at half-maximum.
Novolac 21.91 0.15 11.12 1585 1.17
CA-600 27.16 0.19 8.46 1589 1.56
CA-800 27.81 0.16 10.46 1589 1.73
CA-1000 27.33 0.17 9.63 1596 1.87
CA-1200 28.97 0.15 11.25 1589 1.88
CA-1400 24.94 0.16 10.25 1587 1.65
CA-1600 26.57 0.13 12.33 1591 1.44


The nanocrystallite size (La) represents the size of clustered crystallite sites of sp2 and sp3 carbon atoms, interconnected with sp3 amorphous carbons. The size of nanocrystallite sites increased with carbonization temperature. Moreover, Raman results revealed that the position of G peak (peak at ∼1585–1600 cm−1) shifted to higher values through the carbonization process of Novolac at higher temperatures.

Based on Raman studies of disordered and amorphous carbon structures by Ferrari and Robertson,46 position shift of the G peak from ∼1580 cm−1 to around 1600 cm−1 can be considered as a sign for the clustering of sp2 phases. Moreover, the variations of D peak (peak at ∼1350 cm−1) intensity can be also considered as a sign for such a clustering behavior.46 Ferrari and Robertson demonstrated that a nanocrystalline graphite structure has an ID/IG ratio of around 2, and a G peak at around 1600 cm−1.46 In addition, they revealed that the position-shift of the G peak (from ∼1600 cm−1 to the values around 1520 cm−1) and the value-decrease of the ID/IG ratio (from ∼2 to values around 0) are both expected when the amorphisation of graphitic structures to the disordered and amorphous carbon structures takes place.46 Based on their study, and the results presented in Table 1, it can be concluded that the carbonization of Novolac resulted in formation of nanocrystallite sites with both sp2 and sp3 carbon atoms, and that the carbonization process resulted in the clustering of sp2 phases, as schematically depicted in Fig. 3.

Textural and morphological studies

N2 adsorption and mercury porosimetry techniques were used to study the influences of the carbonization temperature on the texture of the novolac-derived carbon aerogels. Textural characteristics of fabricated aerogels, including: apparent density, BET surface area (SBET), pore volume and pore surface areas, are summarized in Table 2. The main textural features of carbon aerogels varied with the increase of carbonization temperature. The observed increase in the density of carbon aerogels with the carbonization temperature was expected, as higher carbonization temperatures resulted in rearrangement of the novolac structure (see discussions on FTIR results), and more sintering of spherical secondary particles.
Table 2 Textural and structural characteristics of fabricated aerogelsa
Aerogel type Mercury porosimetry N2 adsorption
Density (kg m−3) Porosity (%) SBET (m2 g−1) Vmeso (cm3 g−1) Smeso (m2 g−1) Vmicro (cm3 g−1) Smicro (m2 g−1) dmicro (nm)
a Vmeso: volume of mesopores, Smeso: surface of mesopores, Vmicro: volume of micropores, Smicro: surface of micropores, dmicro: mean diameter of micropores.
Novolac 143.59 92.21 28.64 0.2035 28.64
CA-600 85.11 95.27 421.84 0.2714 87.19 0.1768 384.93 0.68
CA-800 114.75 94.65 563.92 0.2423 81.54 0.2503 530.04 0.52
CA-1000 115.77 93.56 641.51 0.0929 60.62 0.2909 619.51 0.54
CA-1200 128.21 92.87 741.79 0.2865 258.38 0.3044 630.67 0.78
CA-1400 159.58 91.12 661.72 0.0734 54.08 0.2479 633.75 0.53
CA-1600 150.43 91.63 590.59 0.1089 82.74 0.2244 542.87 0.58


The contents of eliminated –OH groups increased with the carbonization temperature (see ESI for TGA thermogram of Novolac). Therefore, the content of pores in the structure of novolac-derived carbon aerogels increased as the carbonization temperature increased (Smicro in Table 2). Formation of more pores in the structure of aerogels resulted in an increase in the specific surface area of carbon aerogels with the carbonization temperature. As reported in Table 2, the specific surface area of carbon aerogels increased with increasing the carbonization temperature from 600 to 1200 °C. However, the specific surface areas of CA-1400 and CA1600 were lower than the surface area of CA-1200. This behavior was due to the sintering of secondary nanoparticles, discussed earlier. As the carbonization temperature increased from 1200 to 1400 °C, the rate of sintering process increased and the contents of groups leaving the structure of aerogels in the form of volatile gasses decreased. As a result, the volume of micropores and the specific surface area of CA-1400 and CA-1600 were lower than CA-1200.

Although the carbonization process of Novolac at higher temperatures resulted in a decrease in the overall content of pores, but the amount of micropores, formed through the carbonization process, increased with temperature, base-on N2 adsorption results in Table 2 (see ESI for N2 adsorption isotherms). The observed decrease in the porosity of novolac-derived carbon aerogels with the carbonization temperature was, therefore, mostly due to the reduction of the mesopores relative volume. However, the relative volume of micropores increased with carbonization temperature. These observations were probably related to the discussed elimination of the –OH groups from the novolac structure through the pyrolysis process, which increased with carbonization temperature. As the carbonization temperature increased, the amount of –OH groups leaving the carbon aerogel structure, in the form of volatile gases, increased and hence, more micropores formed. Additionally, higher carbonization temperatures resulted in the sintering of spherical secondary particles, which in turns resulted in a decrease in the content of mesopores. Therefore, the overall porosity of the carbon aerogels decreased with carbonization temperature, but the microporosity of these structures increased at the higher pyrolysis temperatures.

The influences of the carbonization temperature on the morphology of secondary nanoparticles were investigated using FESEM images, as shown in Fig. 4. The size of secondary nanoparticles increased with carbonization temperature. As discussed, this is mainly due to the sintering of secondary particles through the carbonization process. The number of sintered secondary particles increased with carbonization temperature and as a result the particle-size of carbon aerogels increased at the higher carbonization temperatures. Microstructural variations of the novolac-derived carbon aerogels at high carbonization temperatures (discussed earlier) resulted in more solidity and integrity of these materials (see ESI for Young's modulus of fabricated aerogels). These structural variations also resulted in the enhanced conductance performance of carbon aerogels at higher pyrolysis temperatures.


image file: c6ra12947a-f4.tif
Fig. 4 FESEM images of fabricated aerogels.

Conductivity studies

Electrical characteristics of fabricated aerogels, in both DC and AC modes, are summarized in Table 3. The electrical conductivity of Novolac was extremely lower than the reported conductivity performance of the resorcinol-formaldehyde aerogels (∼25–100 S cm−1 (ref. 15)).
Table 3 Electrical characteristics of fabricated aerogels
Aerogel type DC AC
Ave. DC conductivity (S m−1) Ave. DC resistivity (Ω m) Ave. AC conductivity (S m−1) Max. capacitance (F) Max. dielectric permittivity
Novolac 5.05 × 10⁻⁵ 1.98 × 10⁴ 1.04 × 10⁻⁴ 1.87 × 10⁻¹² 48.92674
CA-600 6.49 × 10⁻⁵ 1.54 × 10⁴ 1.80 × 10⁻⁴ 1.07 × 10⁻¹² 38.29235
CA-800 0.05 1.89 × 101 0.05 6.09 × 10⁻¹¹ 1742.481
CA-1000 17.40 5.75 × 10⁻² 17.18 1.44 × 10⁻⁹ 50[thin space (1/6-em)]682.23
CA-1200 7.63 1.31 × 10⁻¹ 7.35 6.47 × 10⁻¹⁰ 25[thin space (1/6-em)]613.05
CA-1400 101.02 9.90 × 10⁻³ 76.62 4.87 × 10⁻⁸ 1[thin space (1/6-em)]467[thin space (1/6-em)]931
CA-1600 134.63 7.43 × 10⁻³ 83.34 3.79 × 10⁻⁸ 801[thin space (1/6-em)]273.5


Although, the electrical conductivity of novolac-derived carbon aerogels increased noticeably through the carbonization process, but the conductivity of fabricated carbon aerogels was still below the reported conductance characteristics of the resorcinol-formaldehyde-derived carbon aerogels (for instance, the electrical conductivity of CA-1000 with a density of 115 kg m−3 was about 17 S m−1, and the electrical conductivity of a resorcinol-formaldehyde-derived carbon aerogel with a density of ∼115 kg m−3, pyrolyzed at 1050 °C, is reported to be around 100 S m−1 (ref. 2 and 47)). Therefore, besides pyrolysis temperature, fabrication conditions, and the density of carbon aerogel, the nature of organic precursor used for fabrication of carbon aerogels is another important factor, which can affect the conductance performance of aerogels, as this factor dictates the microstructural characteristics of the final product.

As discussed, the size of secondary nanoparticles increased through the carbonization process of the novolac-derived carbon aerogels with temperature, as shown in Fig. 5. Moreover, the contact length of carbon aerogels, which represents the mean value of contact length between two adjacent secondary nanoparticles in FESEM images, also increased with carbonization temperature (see ESI for detailed procedure used for calculation of contact length and particle size values). However, the contact length of particles remained almost constant at carbonization temperatures higher than 800 °C. Furthermore, as discussed, the size of nanocrystallites increased with carbonization temperature. Therefore, the main reason for the observed increase in the electrical conductivity of carbon aerogels with the pyrolysis temperature was the reduction of carrier scattering in the aerogel microstructure with the carbonization temperature.


image file: c6ra12947a-f5.tif
Fig. 5 (a) Particle-diameter and (b) contact length of secondary nanoparticles as a function of the carbonization temperature.

The model used widely for describing electron transport in a porous medium is the trapping/detrapping model, in which it is assumed that electrons undergo multiple trapping and detrapping events through the transport pathway.48 The time period electrons wander (through a series of trapping/detrapping events) in a porous medium strongly depends upon the network geometry, porosity and the characteristic length of the conduction pathways.49,50 The electrons undergo more trapping and detrapping events as the electron transport pathway increases. However, electron scattering due to the pore-surface increases significantly when the characteristic length scale of the conduction pathway reduces to nanoscale dimensions.49 Moreover, necking between particles reduces the interparticle electron transfer rate, as the interparticle contact length dictates the characteristic length of the conduction pathways.50

Boundary scattering can be considered as the dominant scattering-rate controlling mechanism in porous structures at low and mediate (room) temperatures.51 Boundary scattering includes both surface and grain boundary scattering effects. Impurity scattering, electron–phonon scattering and electron–electron scattering mechanisms are other scattering effects in porous structures. Boundary scattering rates in a porous medium can be about three orders of magnitude greater than the electron–electron and electron–phonon scattering rates, as reported in the literature.52 Interparticle contact length,50 particle size52 and porosity50 are three main factors affecting the boundary scattering rates in porous media. Moreover, nano-structuring leads to higher surface and grain boundary scattering rates. Furthermore, increasing the porosity, not only leads to a decrease in the density of a porous medium, but also results in an increase in the fraction of conduction-dead-end terminating particles.50

Considering our results, as the carbonization temperature increased, secondary nanoparticles sintered to form larger secondary particles and as a result, the boundary scattering of charge carriers decreased. Moreover, structural studies revealed that higher carbonization temperatures resulted in the more rearrangement of molecular structure and more elimination of –OH groups from the structure of carbon aerogels. Such a molecular rearrangement at higher carbonization temperatures resulted in a reduction of the impurity scattering in the structure of carbon aerogels. However, it should be noted here that, the higher carbonization temperatures also resulted in the formation of more edge-carboxyl groups. We believe that the electron impurity scattering caused by these groups was not important, as we believe these groups present at edges of nanocrystallite sites, where the boundary scattering should be the dominant scattering effect. However, there should be at least some extent of residual resistivity by these groups in the overall electrical resistivity, as the electric field of these impurities can affect electrons.

The only scattering mechanism which probably enhanced with the carbonization temperature was the electron–phonon scattering, which is not a pure elastic scattering process. As the carbonization temperature increased, the phonon mean-free-path of carbon aerogels increased (see ESI for phonon mean-free-path of fabricated aerogels). This is probably due to the observed increase in the nanocrystallite size of carbon aerogels with the pyrolysis temperature. The phonon scattering due to boundary scattering and point scattering mechanisms reduces with lattice growth and structural perfection. Therefore, the observed increase in the size of nanocrystallite sites through the clustering process (XRD and Raman discussions), and structural improvement of nanocrystallites through the carbonization process (Fig. 3), resulted in a reduction in both boundary and point scattering mechanisms. Consequently, the probability of electron–phonon scattering effect increases with carbonization temperature. It should be noted here that at room temperature, the electron–electron scattering mechanism in the structure of porous media is negligible.53

Regarding thermal conductivity, the very same transport mechanism is expected for the carrier (electrons and phonons) transport in a porous medium with a temperature gradient. Phonon–phonon scattering, boundary scattering and lattice imperfections (i.e., defects or impurities) scattering, are three main scattering mechanisms involved in the phonon transport. Phonon boundary scattering rate increases severely with the nano-structuring of a porous medium (which results in increasing interfaces54). Moreover, the pore sites and grain boundaries can cause additional scattering of carriers (phonons and electrons).54 Furthermore, phonon–phonon scattering in a porous material with low content of lattice imperfections can act as the dominant scattering mechanism at high temperatures. The influences of the different scattering effects on carrier transport in the structure of the novolac-derived carbon aerogels are depicted schematically in Fig. 6.


image file: c6ra12947a-f6.tif
Fig. 6 Schematic representation of scattering effects and trapping/detrapping model involved in carrier transport in a carbon aerogel.

The discussed scattering mechanisms can also be considered as the reason for the observed thermal conductivity behavior in Fig. 7. Based on electronic thermal conductivity studies (see ESI for electronic and phonon thermal conductivity results), the dominant thermal conductivity mechanism in the novolac-derived carbon aerogels was the phonon thermal conductivity. Therefore, phonon scattering rate dictated the rate of thermal conductivity in the novolac-derived carbon aerogel systems. As discussed, the scattering rate of the phonons decreased with carbonization temperature. Consequently, the total thermal conductivity of carbon aerogels increased with pyrolysis temperature.


image file: c6ra12947a-f7.tif
Fig. 7 Thermal conductivity of fabricated carbon aerogels: (a) measured experimental values, and (b) calculated values predicted using the MSP model.

It is noteworthy that the role of phonon–phonon resistivity (anharmonic interactions like three-phonon scattering events) on the thermal conductivity of graphite increases with temperature, based on literature.55 Therefore, this scattering mechanism can noticeably affect the total thermal conductivity of the novolac-derived carbon aerogels at high service temperatures (in this study, only the influences of high carbonization temperatures were discussed).

The predicted thermal conductivity values of the fabricated aerogels, calculated using the MSP model, were presented in Fig. 7(b) and compared with the measured experimental values. Results in Fig. 7(b) confirmed that the MSP model results agree well with the experimental data. The MSP model predicted the overall increasing trend of thermal conductivity values correctly. The gaseous and radiative thermal conductivity values used for the prediction of reported total thermal conductivity values in Fig. 7(b) were calculated at p = 1 bar and T = 333 K (conditions used for the experimental measurements). As discussed, the thermal conductivity of carbon aerogels is highly influenced by the phonon scattering rate. This important factor was seen in the MSP model in the definition of phonon mean-free-path (lpart) in eqn (17). We also used the MSP model for predicting the temperature-dependent total thermal conductivity of other carbon aerogel systems derived from different precursors (see ESI for the predicted thermal conductivity of resorcinol-formaldehyde-derived carbon aerogels), and results revealed that the MSP model can also predict the temperature-dependent thermal conductivity of carbon aerogels precisely. Therefore, the MSP model can be used for predicting the thermal conductivity of carbon aerogel systems derived from different organic precursors at different conditions.

Conclusions

In this study, the influences of the high-temperature pyrolysis process on the microstructure, and the conductance performance of the novolac-derived carbon aerogels were investigated. Structural studies revealed that the pyrolysis process of Novolac at high temperatures resulted in the rearrangement of molecular structure. In addition, high-temperature pyrolysis resulted in elimination of –OH groups. The level of molecular rearrangements increased with temperature, just like the contents of eliminated –OH groups. Moreover, the size of the nanocrystallite sites increased with pyrolysis temperature. Furthermore, the carbonization process of Novolac at higher temperatures increased the contents of the clustered sp2 phases. Based on discussed results, molecular structures of fabricated aerogels were proposed and discussed in details.

Textural and morphological studies revealed that, although, the total porosity of the novolac-derived carbon aerogels decreased with the pyrolysis temperature (the density of aerogels increased with the carbonization temperature), but the amount of micropores, formed through the carbonization process, increased with the temperature, as the content of –OH groups leaved the microstructure of aerogels in the form of volatile gases increased at higher carbonization temperatures. Moreover, due to the sintering of secondary nanoparticles, the size of nanoparticles increased with the carbonization temperature.

The electrical conductivity of the novolac-derived carbon aerogels increased with the carbonization temperature. Higher carbonization temperatures resulted in lower electron scattering rates, as the probability of carrier scattering through transport pathways decreased. The boundary scattering of carriers decreased at higher temperatures, as the particle size increased and porosity decreased with the carbonization temperature. Moreover, the characteristic length scale of the conduction pathway increased with the pyrolysis temperature, as the contact length of secondary nanoparticles increased through the carbonization at high temperatures. Similarly, thermal conductivity of the novolac-derived carbon aerogels increased with the pyrolysis temperature. In addition to decreased boundary scattering rates at higher carbonization temperatures, the contents of imperfections in the structure of nanocrystallites decreased with the pyrolysis temperature and as a result, lattice imperfections scattering rates decreased.

An analytical series–parallel thermal conductivity model, named as the MSP model, was presented in this study. Predicted thermal conductivity values confirmed that the MSP model can be used for predicting the thermal conductivity of carbon aerogels derived from different organic precursors, and at different service conditions. There were no fitting parameters in the MSP model, and dimensional characteristics of secondary nanoparticles (lcontact and dpart), dimensional characteristics of pores (SBET and Smicro), density of aerogel (ρa) and the ultrasonic sound velocity of aerogel (va), were microstructural parameters needed for predicting the thermal conductivity of carbon aerogels at different service conditions.

Acknowledgements

The authors would like to thank Tarbiat Modares University and Iran Nanotechnology Initiative Council (INIC) for supporting this research work.

Notes and references

  1. A. Allahbakhsh and A. R. Bahramian, Nanoscale, 2015, 7, 14139–14158 RSC.
  2. R. W. Pekala, C. T. Alviso, F. M. Kong and S. S. Hulsey, J. Non-Cryst. Solids, 1992, 145, 90–98 CrossRef CAS.
  3. R. W. Pekala, J. C. Farmer, C. T. Alviso, T. D. Tran, S. T. Mayer, J. M. Miller and B. Dunn, J. Non-Cryst. Solids, 1998, 225, 74–80 CrossRef CAS.
  4. T. Tsuchiya, T. Mori, S. Iwamura, I. Ogino and S. R. Mukai, Carbon, 2014, 76, 240–249 CrossRef CAS.
  5. Y. Xu, K. Sheng, C. Li and G. Shi, ACS Nano, 2010, 4, 4324–4330 CrossRef CAS PubMed.
  6. C. Wang, Y. Li, X. He, Y. Ding, Q. Peng, W. Zhao, E. Shi, S. Wu and A. Cao, Nanoscale, 2015, 7, 7550–7558 RSC.
  7. C. Moreno-Castilla and F. J. Maldonado-Hódar, Carbon, 2005, 43, 455–465 CrossRef CAS.
  8. J. Zhang, Z. Zhao, Z. Xia and L. Dai, Nat. Nanotechnol., 2015, 10, 444–452 CrossRef CAS PubMed.
  9. H. Kabbour, T. F. Baumann, J. H. Satcher, A. Saulnier and C. C. Ahn, Chem. Mater., 2006, 18, 6085–6087 CrossRef CAS.
  10. H. Y. Tian, C. E. Buckley, S. B. Wang and M. F. Zhou, Carbon, 2009, 47, 2128–2130 CrossRef CAS.
  11. C. Wang, Y. Ding, Y. Yuan, X. He, S. Wu, S. Hu, M. Zou, W. Zhao, L. Yang, A. Cao and Y. Li, J. Mater. Chem. C, 2015, 3, 11893–11901 RSC.
  12. M. Wiener, G. Reichenauer, S. Braxmeier, F. Hemberger and H. P. Ebert, Int. J. Thermophys., 2009, 30, 1372–1385 CrossRef CAS.
  13. M. Wiener, G. Reichenauer, F. Hemberger and H. P. Ebert, Int. J. Thermophys., 2006, 27, 1826–1843 CrossRef CAS.
  14. M. Wiener and G. Reichenauer, Microporous Mesoporous Mater., 2015, 203, 116–122 CrossRef CAS.
  15. A. M. ElKhatat and S. A. Al-Muhtaseb, Adv. Mater., 2011, 23, 2887–2903 CrossRef CAS PubMed.
  16. A. Hajizadeh, A. R. Bahramian and A. Sharif, J. Non-Cryst. Solids, 2014, 402, 53–57 CrossRef CAS.
  17. M. M. Seraji, A. Seifi and A. R. Bahramian, Mater. Des., 2015, 69, 190–196 CrossRef CAS.
  18. A. Hajizadeh, A. R. Bahramian, A. Seifi and I. Naseri, J. Sol-Gel Sci. Technol., 2014, 73, 220–226 CrossRef.
  19. N. S. Ghafoorian, A. R. Bahramian and M. M. Seraji, Mater. Des., 2015, 86, 279–288 CrossRef CAS.
  20. M. M. Seraji, N. S. Ghafoorian, A. R. Bahramian and A. Alahbakhsh, J. Non-Cryst. Solids, 2015, 425, 146–152 CrossRef CAS.
  21. M. M. Seraji, N. S. Ghafoorian and A. R. Bahramian, J. Non-Cryst. Solids, 2016, 435, 1–7 CrossRef CAS.
  22. Y. Hanzawa, H. Hatori, N. Yoshizawa and Y. Yamada, Carbon, 2002, 40, 575–581 CrossRef CAS.
  23. R. E. Franklin, Proc. R. Soc. London, Ser. A, 1951, 209, 196–218 CrossRef CAS.
  24. I. Naseri, A. Kazemi, A. R. Bahramian and M. Razzaghi Kashani, Mater. Des., 2014, 61, 35–40 CrossRef CAS.
  25. J.-J. Zhao, Y.-Y. Duan, X.-D. Wang and B.-X. Wang, J. Phys. D: Appl. Phys., 2013, 46, 015304 CrossRef.
  26. J.-J. Zhao, Y.-Y. Duan, X.-D. Wang and B.-X. Wang, J. Non-Cryst. Solids, 2012, 358, 1287–1297 CrossRef CAS.
  27. J.-J. Zhao, Y.-Y. Duan, X.-D. Wang and B.-X. Wang, J. Nanopart. Res., 2012, 14, 1024 CrossRef.
  28. K. Swimm, G. Reichenauer, S. Vidi and H. P. Ebert, Int. J. Thermophys., 2009, 30, 1329–1342 CrossRef CAS.
  29. S. Q. Zeng, A. Hunt and R. Greif, J. Non-Cryst. Solids, 1995, 186, 264–270 CrossRef CAS.
  30. S. Q. Zeng, A. Hunt and R. Greif, J. Heat Transfer, 1995, 117, 1055–1058 CrossRef CAS.
  31. Y.-L. He and T. Xie, Appl. Therm. Eng., 2015, 81, 28–50 CrossRef CAS.
  32. G. Wei, Y. Liu, X. Zhang, F. Yu and X. Du, Int. J. Heat Mass Transfer, 2011, 54, 2355–2366 CrossRef CAS.
  33. F. Hemberger, S. Weis, G. Reichenauer and H.-P. Ebert, Int. J. Thermophys., 2009, 30, 1357–1371 CrossRef CAS.
  34. S. R. Hostler, A. R. Abramson, M. D. Gawryla, S. A. Bandi and D. A. Schiraldi, Int. J. Heat Mass Transfer, 2009, 52, 665–669 CrossRef CAS.
  35. R. Caps and J. Fricke, in Aerogels, ed. J. Fricke, Springer Berlin Heidelberg, Berlin, 1986, vol. 6, pp. 110–115 Search PubMed.
  36. R. L. Hamilton and O. K. Crosser, Ind. Eng. Chem. Fundam., 1962, 1, 187–191 CAS.
  37. L. Gong, Y. Wang, X. Cheng, R. Zhang and H. Zhang, Int. J. Heat Mass Transfer, 2014, 68, 295–298 CrossRef.
  38. H.-S. Ma, A. P. Roberts, J.-H. Prévost, R. Jullien and G. W. Scherer, J. Non-Cryst. Solids, 2000, 277, 127–141 CrossRef CAS.
  39. H.-S. Ma, J.-H. Prévost, R. Jullien and G. W. Scherer, J. Non-Cryst. Solids, 2001, 285, 216–221 CrossRef CAS.
  40. H.-S. Ma, J.-H. Prévost and G. W. Scherer, Int. J. Solids Struct., 2002, 39, 4605–4614 CrossRef.
  41. J. C. M. Garnett, Philos. Trans. R. Soc., A, 1906, 205, 237–288 CrossRef CAS.
  42. G. Chen, J. Heat Transfer, 1996, 118, 539–545 CrossRef CAS.
  43. S. Brunauer, P. H. Emmett and E. Teller, J. Am. Chem. Soc., 1938, 60, 309–319 CrossRef CAS.
  44. C. Y. Ho, R. W. Powell and P. E. Liley, J. Phys. Chem. Ref. Data, 1974, 3, 1–796 CrossRef.
  45. S. Maji, O. Urakawa and T. Inoue, Polym. J., 2014, 46, 584–591 CrossRef CAS.
  46. A. C. Ferrari and J. Robertson, Phys. Rev. B: Condens. Matter, 2000, 61, 14095–14107 CrossRef CAS.
  47. X. Lu, O. Nilsson, J. Fricke and R. W. Pekala, J. Appl. Phys., 1993, 73, 581 CrossRef CAS.
  48. L. Liang, S. Dai, L. Hu, F. Kong, W. Xu and K. Wang, J. Phys. Chem. B, 2006, 110, 12404–12409 CrossRef CAS PubMed.
  49. M. T. Barako, A. Sood, C. Zhang, J. Wang, T. Kodama, M. Asheghi, X. Zheng, P. V. Braun and K. E. Goodson, Nano Lett., 2016, 16, 2754–2761 CrossRef CAS PubMed.
  50. K. D. Benkstein, N. Kopidakis, J. van de Lagemaat and A. J. Frank, J. Phys. Chem. B, 2003, 107, 7759–7767 CrossRef CAS.
  51. P. B. Kaul and V. Prakash, J. Appl. Phys., 2014, 115, 023520 CrossRef.
  52. P. E. Hopkins, J. Appl. Phys., 2009, 105, 093517 CrossRef.
  53. C. Uher, in Thermal Conductivity: Theory, Properties, and Applications, ed. T. M. Tritt, Kluwer Academic/Plenum Publishers, New York, 2004, ch. 1.2, pp. 21–88,  DOI:10.1007/b136496.
  54. H. Lee, D. Vashaee, D. Z. Wang, M. S. Dresselhaus, Z. F. Ren and G. Chen, J. Appl. Phys., 2010, 107, 094308 CrossRef.
  55. A. Alofi and G. P. Srivastava, Phys. Rev. B: Condens. Matter, 2013, 87, 115421 CrossRef.

Footnote

Electronic supplementary information (ESI) available. See DOI: 10.1039/c6ra12947a

This journal is © The Royal Society of Chemistry 2016
Click here to see how this site uses Cookies. View our privacy policy here.