Role of LiTFSI in high Tg triphenylamine-based hole transporting material in perovskite solar cell

An-Na Choa, Hui-Seon Kima, Thanh-Tuân Bui*b, Xavier Sallenaveb, Fabrice Goubardb and Nam-Gyu Park*a
aSchool of Chemical Engineering and Department of Energy Science, Sungkyunkwan University, Suwon 440-746, Korea. E-mail: npark@skku.edu; an.cho@skku.edu; hseon.kim@skku.edu
bLaboratoire de Physicochimie des Polymères et des Interfaces, Université de Cergy-Pontoise, 5 mail Gay Lussac, 95000 Neuville-sur-Oise, France. E-mail: tbui@u-cergy.fr; fabrice.goubard@u-cergy.fr; xavier.sallenave@u-cergy.fr

Received 14th May 2016 , Accepted 27th June 2016

First published on 29th June 2016


Abstract

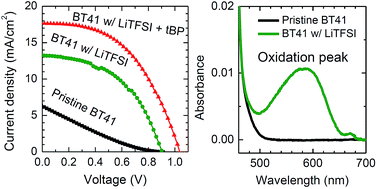
A hole transporting material based on triphenylamine with a high glass transition temperature (Tg) of 99 °C, coded as BT41, was synthesized and applied to a perovskite solar cell. The pristine BT41 showed a low power conversion efficiency (PCE) of 1.1% due to a low photocurrent density (Jsc) of ca. 6 mA cm−2 and an almost negligible fill factor of less than 0.2, which was significantly improved to 9.0%, however, owing mainly to the 3-fold improved Jsc of 17.6 mA cm−2, by adding both tert-butylpyridine (tBP) and lithium bis(trifluoromethane sulfonyl) imide (LiTFSI) as additives. The oxidation of BT41 was dominated by LiTFSI, which was responsible for the hole mobility increasing by one order of magnitude. The addition of the additive also reduced the recombination resistance, which correlates with the higher fill factor. Although both additives in BT41 contributed cooperatively to the improvement of the photovoltaic performance, LiTFSI played the major role in the enhancement.


1. Introduction

The organic–inorganic halide perovskite solar cell (PSC) has been in the spotlight since the report on a solid-state perovskite solar cell employing spiro-MeOTAD as a hole transporting material (HTM) in 2012 (ref. 1), following the reports on perovskite sensitized liquid junction solar cells in 2009 (ref. 2) and 2011.3 The report on the solid-state PSC in 2012 eventually triggered research on PSCs, and as a result, the power conversion efficiency (PCE) reached 22.1% in 2016.4

In a perovskite solar cell, needless to say, the perovskite layer is the most important component. However, equally important components are the materials for selective contacts, since the selective contacts serve the processes of electron and hole extraction. TiO2 has been commonly used for electron collecting, whereas various materials have been proposed as candidates for the hole transporting layer. Among the proposed HTMs, spiro-MeOTAD has been usually adapted for the perovskite solar cell since its successful use in a solid-state dye-sensitized solar cell in 1998.5 Compared to polymeric HTMs, molecular HTMs are beneficial in terms of reproducibility. Nevertheless, the relatively low conductivity and a highly complicated synthetic process are still issues to be addressed in spiro-MeOTAD. A donor–acceptor type DOR3T-TBDT6 and a tetrathiafulvalene derivative7 have been proposed as alternatives to spiro-MeOTAD because those materials demonstrated PCEs of 14.9% and 11.03%, respectively, even without additives, thanks to their high hole mobility.

Triphenylamine (TPA), an important constituent in spiro-MeOTAD, is regarded as a basic unit for a HTM. For instance, TPA linked with diphenyl led to a linear π-conjugated small molecule showing better pore filling and efficient hole mobility.8 Modification of the MeOTAD structure demonstrated comparable performance to a device with spiro-MeOTAD.9 Flattering of the core TPA was found to increase hole transport owing to the effective π–π interaction, which showed a PCE of 12.8% without adding additives to this HTM.10

Recently Bui et al., reported 5-(4-(bis(4-(5-(bis(4-methoxyphenyl)amino)thiophen-2-yl)phenyl)amino)phenyl)-N,N-bis(4-methoxyphenyl)thiophen-2-amine (coded as BT41) based on a triphenylamine core that is expected to be a candidate HTM in perovskite solar cells because of its high glass transition temperature (Tg = 99 °C) allowing good contact with the perovskite layer due to its amorphous state.11,12 In addition, BT41 is expected to be less expensive than spiro-MeOTAD because of the facile synthetic process with a relatively high yield. In the case of spiro-MeOTAD, its low conductivity13,14 can be overcome by the addition of additives such as lithium bis(trifluoromethane sulfonyl) imide (LiTFSI) and 4-tert-butylpyridine (tBP). The addition of both additives has been found to improve significantly perovskite solar cell performance. However, the roles of LiTFSI or tBP have not been clarified. In this work, the effects of additives in BT41 on the photovoltaic performance of a perovskite solar cell are investigated. The photovoltaic performance of pristine BT41 is compared with BT41 including additives. The performance of BT41 with only LiTFSI is far superior to that with only tBP, and is further improved by combining the two additives. The effects of the additives are analyzed by hole mobility, photoluminescence and impedance spectroscopy.

2. Experimental section

Synthesis of materials

BT41 was synthesized according to a method described elsewhere.11 In a typical procedure, tris(4-(5-bromothiophen-2-yl)phenyl)amine (628 mg, 0.8622 mmol), bis(4-methoxyphenyl)amine (890 mg, 3.88 mmol), palladium(II) acetate (19 mg, 0.08622 mmol), sodium tert-butoxide (497 mg, 5.1732 mmol), tri-tert-butylphosphine (35 mg, 0.1724 mmol, dissolved in 3 mL of dry toluene), and freshly distillated toluene (30 mL) were charged in a dry Schlenk tube equipped with a magnetic stir bar under an argon stream. The mixture was then degassed by a repeated vacuum evacuation/argon refill cycle (5 times) and was heated at 100 °C for 80 h. After cooling to room temperature, the mixture was diluted with chloroform (100 mL) and was filtered through a short plug of silica to yield a clear yellow liquid. This solution was concentrated to give a viscous oil (ca. 3–4 mL) to which methanol (250 mL) was added whilst stirring. The precipitate was then filtered, rinsed with methanol, and dried under vacuum to yield the product as a yellow solid (787 mg, 78% yield). 1H NMR (DMSO-d6, δ/ppm): 7.48 (d, 6H, J = 8.5 Hz), 7.18 (d, 3H, J = 3.8 Hz), 7.11 (d, 12H, J = 9.0 Hz), 7.00 (d, 6H, J = 8.5 Hz), 6.93 (d, 12H, J = 9.0 Hz), 6.42 (d, 3H, J = 4.3 Hz), 3.76 (s, 18H). 13C NMR (1,2-dichlorobenzene-d4, δ/ppm): 156.30, 152.92, 146.05, 141.66, 135.13, 122.99, 125.99, 124.90, 124.61, 121.41, 118.00, 114.82, 55.23. HRMS (ESI+): calculated for M+: 1172.3675, found 1172.3711. CH3NH3I was synthesized by reacting 27.8 mL of CH3NH2 (40 wt% in methanol, TCI) with 30 mL of HI (57 wt% in water, Aldrich) in a round bottomed flask under vigorous stirring for 2 h in an ice bath. The precipitated CH3NH3I was collected using a rotary evaporator at 50 °C for 1 h, washed with diethyl ether four times and finally dried under vacuum for 24 h. PbI2 (0.461 g), CH3NH3I (0.159 g) and N,N-dimethyl sulfoxide (DMSO) (0.078 g) in 0.4943 g of dimethylformamide (DMF) were prepared at room temperature for the spin-coating of MAPbI3 (MA = CH3NH3) (corresponding to 52 wt% solution).

Solar cell fabrication

The compact blocking TiO2 layer (bl-TiO2) was formed on the cleaned FTO glasses (Pilkington, TEC-8, 8 Ω sq−1) using a 0.15 M solution of titanium diisopropoxide bis(acetylacetonate) (75 wt% in 2-propanol, Aldrich) in 1-butanol (99.8%, Aldrich) as spin coated at 2800 rpm for 20 s, which was followed by drying at 125 °C for 5 min. The home-made nanocrystalline TiO2 (diameter of about 50 nm) paste was diluted (0.1 g paste per mL 1-butanol), which was spin-coated on the bl-TiO2 at 2000 rpm for 20 s and annealed at 550 °C for 1 h to form the mesoporous TiO2 (m-TiO2) layer. The m-TiO2 layer was further treated with 0.02 M aqueous TiCl4 (99.9%, Aldrich) solution at 70 °C for 10 min, followed by annealing at 500 °C for 30 min. The adduct method was used to prepare the perovskite layer,15 where a precursor solution containing CH3NH3I, PbI2 and DMSO that was dissolved in DMF was spin-coated on the mesoporous TiO2 film at 4000 rpm for 25 s and diethyl ether was dripped while spinning. The perovskite layer was formed by drying at 65 °C for 1 min and 100 °C for 9 min. BT41 was spin-coated on the top of the perovskite layer at 4000 rpm for 30 s using the BT41 solution with or without additives, where 59.04 mM BT41 was first prepared by dissolving 69.3 mg BT41 in 1 mL of chlorobenzene, to which 28.8 μL tBP (96%, Aldrich) was added and then 25 μL LiTFSI (99.95%, Aldrich) was finally added. The LiTFSI solution was prepared by dissolving 520 mg LiTFSI in 1 mL acetonitrile. Finally, a gold counter electrode was thermally deposited on the BT41 HTM layer at 1 × 10⁻⁶ torr.

Characterization

Toluene was dried by distillation from sodium metal just prior to use. NMR spectra were recorded on a Bruker DPX-250 FT-NMR spectrometer with deuterated solvent in all cases. The chemical shifts (δ) are given in ppm using the residual solvent signal as an internal reference. High-resolution mass spectrometry was performed by the small molecule mass spectrometry platform of the CNRS IMAGIF in Gif-sur-Yvette. Thermogravimetric analysis (TGA) was carried out on a TA Instrument Q50 TGA under argon flow at a heating rate of 20 °C min−1. The temperature of thermal degradation (Td) was measured at the point of 5% weight loss. Differential scanning calorimetry (DSC) was performed on a TA Instruments Q100 calorimeter, calibrated with indium and flushed with argon. Samples were scanned from −50 °C to 280 °C at a heating rate of 20 °C min−1 then rapidly cooled to −50 °C (quenching) and heated at the same rate to 280 °C. Absorbance was measured using a UV/vis spectrometer (lamda35, PerkinElmer). Time-integrated photoluminescence (PL) spectra were collected using a Quantaurus-Tau compact fluorescence lifetime spectrometer (HAMAMATSU) with a 450 W CW xenon lamp and a photomultiplier tube (PMT) detector (excitation wavelength 464 nm, repetition rate 10 MHz). Cyclic voltammetry (CV) was carried out using an Autolab (AUT128N, FRA2) electrochemical analyzer. A BT41 thin film was prepared by dropping and drying the BT41 chlorobenzene solution on a glassy carbon electrode, which was used as a working electrode, Pt and Ag/AgCl were used as counter and reference electrodes, respectively. These three electrodes were immersed in a CH2Cl2 solution with 0.1 M tetrabutylammonium hexafluorophosphate (NBu4PF6) and the oxidation potential was evaluated with respect to ferrocene (Fc) at a scan rate of 100 mV s−1. The hole mobility (μh) was estimated from the current density (J)–voltage (V) characteristics using the space charge limited current (SCLC) method. The Mott–Gurney equation, J = (9/8)ε0εrμh(V2/L3), was applied to obtain μh,16 where ε0 is the vacuum permittivity (8.857 × 10⁻¹² F m−1), εr is the dielectric constant of the film (εr = 3 was assumed17), and L is the thickness of the active layer. The device structure for SCLC measurement was ITO/BT41/Au and the BT41 film thickness was determined by an alpha-step IQ surface profiler system (KLA Tencor).

Photocurrent density (J)–voltage (V) spectra were measured with a solar simulator (Oriel Sol 3 A class AAA) equipped with a 450 W Xenon lamp (Newport 6279NS) and a Keithley 2400 source meter. The light intensity was adjusted with the NREL-calibrated Si solar cell having a KG-2 filter for approximating one sun light intensity (100 mW cm−2). The active area was covered with an aperture mask (0.125 cm2) during the measurement.

Impedance spectroscopy (IS) characterization was carried out with PGSTAT 128N (Autolab, Eco-Chemie). IS under illumination (80 mW cm−2) was measured by applying a small perturbation of AC 20 mV over a DC bias voltage with a frequency ranging from 1 MHz to 1 Hz where 1 s of equilibrium time was given between each scan. A DC bias voltage ranging from 0 V to 0.7 V was applied to the device with a potential step of 0.1 V. The obtained Nyquist plots were fitted using an equivalent circuit composed of a series resistance (Rs) and two or three R–C components (resistance and capacitance in parallel) depending on the HTM composition. In the high frequency region, impedance raw data were fit with two R–C components in series where the sum of two resistance values represents the resistance in the high frequency region (RHF). The last arc in the low frequency region was fitted with one R–C circuit indicating the recombination resistance (Rrec).

3. Results and discussion

The molecular structure of BT41 is shown in Fig. 1. The studied compound was synthesized from commercially available tris(4-bromophenyl)amine in three steps with an overall yield of 52%. Briefly, a Stille coupling reaction between 2-tributylstannylthiophene and tris(4-bromophenyl)amine gave tris(4-(thiophen-2-yl)pheny-l)amine, which was then brominated leading to tris(4-(5-bromothiophen-2-yl)phenyl)amine. The later was then subjected to threefold Pd-catalyzed Buchwald–Hartwig amination with di(4-methoxyphenyl)amine, leading to BT41. The structures of the intermediate and final compounds were confirmed by NMR and HRMS. As expected, BT41 has good solubility in common organic solvents, high thermal stability (Td = 428 °C) with a relatively high glass transition temperature (Tg = 99 °C).
image file: c6ra12574c-f1.tif
Fig. 1 The molecular structure of tris(4-(5-(4,4′-dimethoxydiphenylaminyl)-2-thiophenyl)phenyl)amine (BT41).

The absorption and emission properties of BT41 were measured, and BT41 in CH2Cl2 solution and in a thin solid film are compared in Fig. 2a. The maximum absorption appears similarly at 405 nm for the solution and 406 nm for the thin film, while the peak for the thin film is broader than that for the solution due to the enhanced overlap between molecules, leading to the splitting of HOMO and LUMO level.18 The photoluminescence (PL) spectrum for the solution shows an asymmetric single peak with a maximum at 466 nm, whereas the maximum shifts to 508 nm leaving a shoulder peak at 471 nm for the thin film case. The red-shift in the thin film form is related to the intermolecular π–π interaction that can be enhanced by tilting triphenylamine.19


image file: c6ra12574c-f2.tif
Fig. 2 (a) Normalized absorption and photoluminescence (PL) spectra for the BT41 solution dissolved in CH2Cl2 (black) and the BT41 film formed on plain glass (gray). (b) Cyclic voltammogram of BT41 with ferrocene as the reference (scan rate = 100 mV s−1).

A cyclic voltammogram (CV) was measured to determine the oxidation and reduction potential of BT41.20,21 Fig. 2b shows the CV result, where oxidation potential of BT41 is determined to be −0.14 V from the onset potential. The highest occupied molecular orbital (HOMO) of BT41 is calculated to be −4.96 eV from the relation of EHOMO = −5.1 − (Eox,HTM vs. Fc/Fc+).20

From the combined results of optical spectroscopy and CV, the HOMO and LUMO level of BT41 could be determined, and are displayed in Fig. 3 together with the conduction band (CB) and valence band (VB) positions of MAPbI3 and the CB of TiO2. The HOMO–LUMO gap of BT41 is obtained by the onset wavelength (467.9 nm) in absorption spectrum, which is equivalent to 2.65 eV. The LUMO level is then estimated to be −2.31 eV from the HOMO and gap energy. The HOMO of BT41 is well suited for hole transfer from MAPbI3.


image file: c6ra12574c-f3.tif
Fig. 3 Energy level diagram of TiO2, MAPbI3 and BT41. CB, VB, HOMO and LUMO represent the conduction band, the valence band, the highest occupied molecular orbital and the lowest unoccupied molecular orbital, respectively.

Fig. 4 compares photocurrent–voltage curves of perovskite solar cells employing pristine BT41, BT41 with tBP, BT41 with LiTFSI and BT41 with both tBP and LiTFSI. The device is composed of FTO/bl-TiO2/m-TiO2/MAPbI3/BT41/Au, where the thicknesses of the m-TiO2 layer and the perovskite capping layer are 100 nm and 400 nm, respectively. The photovoltaic parameters are listed in Table 1. Pristine BT41 without additive shows low performance due to the low photocurrent density (Jsc) of 6.28 mA cm−2 and an almost negligible FF of 0.2. The addition of tBP to BT41 deteriorates Jsc but improves Voc. Jsc and FF are significantly improved to 13.25 mA cm−2 and 0.48, respectively, by the addition of LiTFSI, which indicates that LiTFSI dominates the enhancement of photovoltaic performance rather than tBP. Jsc is further improved to 17.64 mA cm−2 and the FF is improved to 0.49 upon the co-existence of tBP and LiTFSI in BT41. This indicates that although tBP itself has little impact on the performance, a cooperative effect is demonstrated when tBP is combined with LiTFSI. tBP indirectly increases the power conversion efficiency by enabling LiTFSI to be dissolved in the solution. Chlorobenzene is used as a solvent for BT41. Nevertheless, LiTFSI itself is insoluble in chlorobenzene due to its low polarity. tBP is required to reveal the effect of LiTFSI. The PCE is significantly improved from 1.1% to 9.0% by the additive effect.


image file: c6ra12574c-f4.tif
Fig. 4 Current density (J)–voltage (V) curves of BT41-based perovskite solar cells depending on additives. Data are collected from the reverse scan (from Voc to Jsc) at a scan rate of 200 ms (voltage settling) under 1.5G one sun illumination.
Table 1 Photovoltaic parameters of BT41-based perovskite solar cells depending on additives. Jsc, Voc, FF and PCE represent the short-circuit photocurrent density, the open-circuit voltage, the fill factor and the power conversion efficiency, respectively. The data were collected from the reverse scan (from Voc to Jsc) at a scan rate of 200 ms
BT41 Jsc (mA cm−2) Voc (V) FF PCE (%)
Pristine 6.28 0.89 0.196 1.1
w/tBP 2.64 1.04 0.216 0.6
w/LiTFSI 13.25 0.90 0.483 5.8
w/tBP + LiTFSI 17.64 1.04 0.491 9.0


Time-integrated photoluminescence (PL) was measured to investigate the effect of the additives on the charge separation between MAPbI3 and hole transport. Fig. 5 shows the normalized PL with respect to bare MAPbI3. Upon contacting MAPbI3 with the pristine BT41, the PL intensity is significantly reduced. The PL intensity is also decreased for the MAPbI3 with BT41 containing both tBP and LiTFSI, however, PL quenching is less pronounced compared to the MAPbI3 with pristine BT41 without additive. This implies that the additives have little effect on charge separation. The PL peaks of MAPbI3 are slightly blue-shifted upon coming into contact with BT41, which is attributed to the PL of BT41. A small difference in PL quenching between the pristine BT41 and the BT41 with additives is indicative of a difference in the contact morphology at the MAPbI3/BT41 interface.


image file: c6ra12574c-f5.tif
Fig. 5 Time-integrated PL spectra for the glass/MAPbI3/PMMA (MAPbI3), the glass/MAPbI3/pristine BT41 (pristine BT41) and the glass/MAPbI3/BT41 with tBP and LiTFSI (tBP + LiTFSI). The data are normalized with respect to the PL data for MAPbI3.

Cross-sectional scanning electron microscopy (SEM) images are compared in Fig. 6. A pinhole-free HTM layer is formed from the pristine BT41 layer, whereas large pinholes in the HTM layer and small pinholes at the interface are developed upon adding the additives to BT41. The interfacial pinholes are likely to hinder charge separation, which might be responsible for the smaller PL quenching for the BT41 including additives than for the pristine BT41, as observed in Fig. 5. Nevertheless, the better photovoltaic performance achieved after the addition of additives may be related to a change in the carrier mobility in BT41.


image file: c6ra12574c-f6.tif
Fig. 6 Cross-sectional SEM images of the full cell layout with (a) pristine BT41 and (b) BT41 with tBP and LiTFSI additives. The scale bar is 100 nm.

We have carefully examined the absorption spectra of BT41 depending on the additives present. In Fig. 7a, BT41 solutions with and without additives are compared. A strong absorption at around 400 nm appears regardless of additives. The BT41 solution containing LiTFSI shows an additional small peak at around 590 nm, while no additional peak appears for the BT41 with tBP. For the case of spiro-MeOTAD, a sharp peak at around 400 nm is characteristic of neutral spiro-MeOTAD and a broad peak at around 500 nm is developed due to the oxidation of spiro-MeOTAD.22–25 The peak that appeared at a longer wavelength after oxidation is due to the fact that the destabilized bonding orbital by the removal of an electron probably leads to a decrease in the transition energy. Thus, the small and broad peak at around 590 nm, which is absent in the pristine BT41, is indicative of the oxidation of BT41. On the other hand, tBP does not have ability to oxidize BT41. The evolution of oxidation of BT41 is monitored in the presence of LiTFSI in Fig. 7b. A gradual evolution of the peak at around 590 nm is indicative of the oxidation of BT41 by LiTFSI. Compared to the very low performance in the presence of only tBP, as observed in Fig. 4, a much higher photocurrent in the presence of only LiTFSI indicates strongly that the oxidation of BT41 plays an important role in hole conduction in the HTM.26


image file: c6ra12574c-f7.tif
Fig. 7 (a) Absorption spectra of BT41 with and without additives. Materials were dissolved in chlorobenzene in a glove box under an argon atmosphere. Measurements were performed for the samples aged for 80 min in an air atmosphere. Inset shows the absorbance in the 500–700 nm region. (b) Evolution of oxidation of BT41 in the presence of LiTFSI. Absorption spectra were measured with chlorobenzene solution of 0.031 mM BT41 and 0.0037 mM LiTFSI every 5 min in the dark at a scan speed of 480 nm min−1.

The space charge limited current (SCLC) was measured to estimate hole mobility. Hole only devices with an ITO/BT41/Au layout were prepared for measuring SCLC.27 The hole mobility is obtained by fitting the Mott–Gurney equation (see Experimental section) to the SCLC data in Fig. 8. The film thickness was 366 nm for pristine BT41, and was 893 nm for BT41 with tBP and LiTFSI. The hole mobility of pristine BT41 is estimated to be 3.06 × 10⁻⁴ cm2 V−1 s−1, which is increased by 20 times to 7.19 × 10⁻³ cm2 V−1 s−1 upon the addition of tBP and LiTFSI to BT41. Such a dramatic improvement of the hole mobility correlates to the oxidation of BT41 that is mainly dominated by LiTFSI. It leads to an increase in the hole mobility because the injected hole fills the deepest trap sites, which induces a smooth potential landscape. This results in an increase of the intra-molecular charge transfer.22,28 Along with the improved hole mobility, the increased density by oxidation consequently enhances the conductivity which is proportional to the hole density and hole mobility (σ = n × e × μ, σ = electrical conductivity, n = the number density of charge carriers, e = the elementary charge, μ = charge carrier mobility).13,28


image file: c6ra12574c-f8.tif
Fig. 8 Current as a function of applied voltage obtained by the SCLC method. The HTM thickness in ITO/HTM/Au was 366 nm for pristine BT41, and 893 nm for BT41 with tBP and LiTFSI.

Impedance spectroscopy was measured to analyze the effect of additives on the resistance. Fig. 9a presents Nyquist plots obtained at an applied voltage of 0.2 V where the solid line indicates the fitted results using an equivalent circuit as described in the Experimental section. In Fig. 9b and c, the Nyquist plots obtained in the applied voltage region ranging from 0 V to 0.7 V were used to determine the resistances as a function of bias voltage in the high and low frequency ranges. Fig. 9b shows the resistance observed in the high frequency region (RHF), which is attributed to the resistance of the selective contacts such as compact TiO2 and hole transport material (HTM).29,30 Because the only difference between the devices was the composition of the HTM where additives were artificially added to the pristine BT41, it is expected that the RHF is dominantly determined by the HTM layer. Moreover, it is noted that almost bias-independent RHF features are obtained, which is frequently observed when the charge transport resistance governs RHF.31 As can be seen in Fig. 9b, BT41 containing additives shows an overall lower RHF in the region of low applied voltage (0–0.4 V) compared to the pristine BT41. Therefore, the addition of additives improves the charge transport in BT41 resulting in a higher photocurrent density, especially in the low applied voltage region where the recombination process is not evident. Fig. 9c represents the recombination resistance (RLF) obtained in the low frequency region. RLF was maintained constantly in the low applied voltage region and began to decrease in the high applied voltage region due to the increased Fermi level. BT41 with additives (tBP + LiTFSI) shows higher recombination resistance compared to the pristine BT41, which is in good consistency with the increased Voc for the BT41 with additives.


image file: c6ra12574c-f9.tif
Fig. 9 (a) Nyquist plots of the devices employing pristine BT41 and BT41 with additives (tBP + LiTFSI) under 0.8 sun. Nyquist plots measured at a DC bias voltage of 0.2 V were shown as an example. (b) Resistances obtained in the high frequency range (RHF) and (c) recombination resistance obtained in the low frequency range (RLF) with respect to the applied voltage.

4. Conclusions

A high Tg triphenylamine based hole transporting material, BT41, was synthesized and applied to a perovskite solar cell. High photovoltaic performance was not achieved using pristine BT41, however, this dramatically improved with the presence of tBP and LiTFSI in BT41. tBP itself had little effect but played a cooperative role when combined with LiTFSI. LiTFSI played a major role in the oxidation of BT41 and enhancing hole mobility, which was responsible for the improved photovoltaic performance in the BT41-based perovskite solar cell.

Acknowledgements

This work was supported by the National Research Foundation of Korea (NRF) grants funded by the Ministry of Science, ICT & Future Planning (MSIP) of Korea under contract no. NRF-2015K1A3A1A21000315 (International Research & Development Program) and in part NRF-2012M3A6A7054861 (Global Frontier R&D Program on Center for Multiscale Energy System), NRF-2015M1A2A2053004 (Climate Change Management Program) and NRF-2012M3A7B4049986 (Nano Material Technology Development Program). The authors also thank the French Ministry of Foreign Affairs, the French Ministry of National Education and Ministry of Higher Education and Research, the Korean Ministry of Science, ICT & Future Planning for financially supporting this French-Korean research collaboration through the Hubert Curien Partnership (PHC STAR) under the project number 34301QH.

References

  1. H.-S. Kim, C.-R. Lee, J.-H. Im, K.-B. Lee, T. Moehl, A. Marchioro, S.-J. Moon, R. Humphry-Baker, J.-H. Yum, J. E. Moser, M. Grätzel and N.-G. Park, Sci. Rep., 2012, 2, 591 Search PubMed.
  2. A. Kojima, K. Teshima, Y. Shirai and T. Miyasaka, J. Am. Chem. Soc., 2009, 131, 6050–6051 CrossRef CAS PubMed.
  3. J.-H. Im, C.-R. Lee, J.-W. Lee, S.-W. Park and N.-G. Park, Nanoscale, 2011, 3, 4088–4093 RSC.
  4. http://www.nrel.gov/ncpv/images/efficiency_chart.jpg.
  5. U. Bach, D. Lupo, P. Comte, J. E. Moser, F. Weissortel, J. Salbeck, H. Spreitzer and M. Grätzel, Nature, 1998, 395, 583–585 CrossRef CAS.
  6. Y. Liu, Q. Chen, H.-S. Duan, H. Zhou, Y. Yang, H. Chen, S. Luo, T.-B. Song, L. Dou, Z. Hong and Y. Yang, J. Mater. Chem. A, 2015, 3, 11940–11947 CAS.
  7. J. Liu, Y. Wu, C. Qin, X. Yang, T. Yasuda, A. Islam, K. Zhang, W. Peng, W. Chen and L. Han, Energy Environ. Sci., 2014, 7, 2963–2967 CAS.
  8. J. Wang, S. Wang, X. Li, L. Zhu, Q. Meng, Y. Xiao and D. Li, Chem. Commun., 2014, 50, 5829–5832 RSC.
  9. H. J. Choi, S. H. Paek, N. W. Lim and Y. H. Lee, Chem.–Eur. J., 2014, 20, 10894–10899 CrossRef CAS PubMed.
  10. P. Qin, S. H. Paek, M. I. Dar, N. Pellet and J. J. Ko, J. Am. Chem. Soc., 2014, 136, 8516–8519 CrossRef CAS PubMed.
  11. T.-T. Bui, L. Beouch, X. Sallenave and F. Goubard, Tetrahedron Lett., 2013, 54, 4277–4280 CrossRef CAS.
  12. T.-T. Bui, S. K. Shah, X. Sallenave, M. Abbas, G. Sini, L. Hirsch and F. Goubard, RSC Adv., 2015, 5, 49590 RSC.
  13. J. Burschka, A. Dualeh, F. Kessler, E. Baranoff, N.-L. Cevey-Ha, C. Yi, M. K. Nazeeruddin and M. Grätzel, J. Am. Chem. Soc., 2011, 133, 18042–18045 CrossRef CAS PubMed.
  14. T. Leijtens, I.-K. Ding, T. Giovenzana, J. T. Bloking, M. D. McGehee and A. Sellinger, ACS Nano, 2012, 6, 1455–1462 CrossRef CAS PubMed.
  15. N. Ahn, D.-Y. Son, I.-H. Jang, S. M. Kang, M. Choi and N.-G. Park, J. Am. Chem. Soc., 2015, 137, 8696–8699 CrossRef CAS PubMed.
  16. Y. Li, R. G. Clevenger, L. Jin, K. V. Kilway and Z. Peng, J. Mater. Chem. C, 2014, 2, 7180–7183 RSC.
  17. A. Kemal Havare, M. Can, N. Yagmurcukardes, M. Z. Yigit, H. Aydın, S. Okur, S. Demic and S. Iclie, ECS J. Solid State Sci. Technol., 2016, 5, 239–244 CrossRef.
  18. V. Jain, G. Bhattacharjya, A. Tej, C. K. Suman, R. Gurunath, B. Mazhari and S. S. K. Iyer, Proc. of ASID ’06, 8–12 Oct, New Delhi, 2006, pp. 244–247 Search PubMed.
  19. P. Moonsin, N. Prachumrak, S. Namuangruk, S. Jungsuttiwong, T. Keawin, T. Sudyoadsuka and V. Promarak, J. Mater. Chem. C, 2014, 2, 5540–5552 RSC.
  20. C. M. Cardona, W. Li, A. E. Kaifer, D. Stockdale and G. C. Bazan, Adv. Mater., 2011, 23, 2367–2371 CrossRef CAS PubMed.
  21. T. Krishnamoorthy, F. Kunwu, P. P. Boix, H. Li, T. M. Koh, W. L. Leong, S. Powar, A. Grimsdale, M. Grätzel, N. Mathews and S. G. Mhaisalkar, J. Mater. Chem. A, 2014, 2, 6305–6309 CAS.
  22. A. Abate, T. Leijtens, S. Pathak, J. Teuscher, R. Avolio, M. E. Errico, J. Kirkpatrik, J. M. Ball, P. Docampo, I. McPherson and H. J. Snaith, Phys. Chem. Chem. Phys., 2013, 15, 2572–2579 RSC.
  23. W. H. Nguyen, C. D. Bailie, E. L. Unger and M. D. McGehee, J. Am. Chem. Soc., 2014, 136, 10996–11001 CrossRef CAS PubMed.
  24. S. Guarnera, A. Abate, W. Zhang, J. M. Foster, G. Richardson, A. Petrozza and H. J. Snaith, J. Phys. Chem. Lett., 2015, 6, 432–437 CrossRef CAS PubMed.
  25. S. Wang, W. Yuan and Y. S. Meng, ACS Appl. Mater. Interfaces, 2015, 7, 24791–24798 CAS.
  26. D.-Y. Chen, W.-H. Tseng, S.-P. Liang, C.-I. Wu, C.-W. Hsu, Y. Chi, W.-Y. Hung and P.-T. Chou, Phys. Chem. Chem. Phys., 2012, 14, 11689–11694 RSC.
  27. E. M. Barea, G. Garcia-Belmonte, M. Sommer, S. Hüttner, H. J. Bolink and M. Thelakkat, Thin Solid Films, 2010, 518, 3351–3354 CrossRef CAS.
  28. H. J. Snaith and M. Grätzel, Appl. Phys. Lett., 2016, 89, 262114 CrossRef.
  29. H.-S. Kim, I. Mora-Sero, V. Gonzalez-Pedro, F. Fabregat-Santiago, E. J. Juarez-Perez, N.-G. Park and J. Bisquert, Nat. Commun., 2013, 4, 2242 Search PubMed.
  30. V. Gonzalez-Pedro, E. J. Juarez-Perez, W. A. Arsyad, E. M. Barea, F. Fabregat-Santiago, I. Mora-Sero and J. Bisquert, Nano Lett., 2014, 14, 888–893 CrossRef CAS PubMed.
  31. E. J. Juarez-Perez, M. Wuβler, F. Fabregat-Santiago, K. Lakus-Wollny, E. Mankel, T. Mayer, W. Jaegermann and I. Mora-Sero, J. Phys. Chem. Lett., 2014, 5, 680–685 CrossRef CAS PubMed.

This journal is © The Royal Society of Chemistry 2016
Click here to see how this site uses Cookies. View our privacy policy here.