Effects of chitin nanowhiskers on the thermal, barrier, mechanical, and rheological properties of polypropylene nanocomposites

Sharon Chi-Yan Liabc, Yu-Chen Sunabc, Qi Guand and Hani Naguib*abc
aDepartment of Mechanical and Industrial Engineering, University of Toronto, 5 King's College Road, Toronto, Ontario M5S 3G8, Canada. E-mail: naguib@mie.utoronto.ca
bDepartment of Materials Science and Engineering, University of Toronto, 27 King's College Circle, Toronto, Ontario M5S 1A1, Canada
cInstitute of Biomaterials and Biomedical Engineering, University of Toronto, 164 College Street, Toronto, Ontario M5S 3G9, Canada
dBOCO Technology Inc., 40 Pullman Court, Toronto, Ontario M1X 1E4, Canada

Received 4th May 2016 , Accepted 22nd July 2016

First published on 25th July 2016


Abstract

Chitin nanowhisker (CNW)/polypropylene (PP) composites with various CNW loadings fabricated through melt blending were characterized for their morphology, thermal properties, water barrier properties, mechanical properties, and rheological properties. The effects of CNWs and compatibilizer on these properties were investigated. Morphological studies of the composites revealed good dispersion of CNWs within the polymer matrix, which translated into improvements in elastic modulus, ultimate tensile strength, and water barrier properties. These results were further supported by thermal and rheological properties showing increase in crystallinity and extensional viscosity of the composites respectively. Moreover, the addition of a compatibilizer suggested reinforcement and enhanced interaction between the CNW and PP as a significant improvement in water barrier properties was observed. Based on the results, the multiple properties that were explored in this study can be tailored with the addition of CNWs, which is a biodegradable filler, for various sustainable packaging and industrial applications.
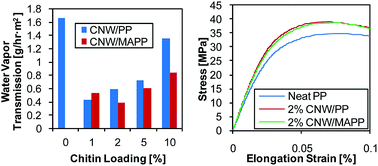

1. Introduction

The use of inorganic nanofillers in polymer nanocomposite films and coatings has dominated the packaging industry and continue to expand through seeking more environmentally viable options by using biopolymers.1 Even though employing biopolymers can improve its environmental impact, the use of inorganic fillers is still questionable. Traditional fillers such as talc,2–4 mica,5–7 montmorillonite,8–10 calcium carbonate,3 calcium sulfate,11–13 and zinc oxide8,14 have been shown to enhance mechanical, thermal, and barrier properties when added into a polymer matrix. However, using these inorganic nanofillers poses environmental and health hazards for humans through exposure during processing or usage.15 Therefore there is a drive towards safer additives and fillers that are biodegradable and abundant. This study will focus on using chitin, which is the second most abundant, because its edge over cellulose with its inherent antimicrobial properties and limited studies.16

Chitin can be sourced from shells of arthropods, such as crabs, shrimps, fish, lobster, fish, and insects, and is a suitable resource for biomedical, packaging, and industrial applications due to its biodegradability, biocompatibility, and low toxicity.16 Chitosan, a derivative of chitin, has been widely study due to its effective antimicrobial properties as a matrix or even when incorporated into various polymer matrices.17–20 Nonetheless, very limited studies have investigated the potential of chitin nanowhisker (CNW) in high performance composites despite showing antimicrobial activity and superior mechanical properties to chitosan due to its crystallinity.16,21,22 The major issue with the composite processing of natural nanofillers such as cellulose or chitin is its incompatibility with commonly used polymers due to their differences in polarity. Chitin, as its chemical structure is shown below in Fig. 1, has many hydroxyl groups, therefore is hydrophilic and tends to self-agglomerate by forming hydrogen bonds in a dehydrated state.


image file: c6ra11623j-f1.tif
Fig. 1 Chemical structure of chitin.

As a result, previous studies have focused on the incorporation of natural nanofillers in either hydrophilic polymers to match the polarities of the filler–matrix system23,24 or polylactic acid (PLA) with compatibilizers to account for a fully biodegradable and biocompatible composite.25–27 However, the most frequently used industrial polymers, such as polyethylene, polypropylene (PP), polystyrene, and PLA, are all hydrophobic polymers.28 Moreover, there are drawbacks of using PLA as it is brittle and has its limited applications due to its low service temperature and its susceptibility to degradation. A common approach taken to accommodate for the filler–matrix incompatibility is to strengthen the filler–matrix interaction by introducing surfactants or modifying filler surfaces.29–32 Through the incorporation of surfactants, the fillers are able to disperse better throughout the matrix, but can in return degrade the polymer matrix. Furthermore, surface treatment of fillers can be performed to make them behave more hydrophobic so that they can adhere better to hydrophobic matrices. Although both techniques have shown to improve mechanical properties based on tensile and dynamic mechanical analysis, the main disadvantage with adding surfactants and surface modifications of fillers is that they can alter the biodegradability and properties of the overall composite.

In order to overcome the ability to disperse the fillers for the ease of processing, dried forms of bio-nanofillers were developed through various drying processes such as freeze drying, spray drying, and supercritical drying,33 and attempts have been made to directly melt compound them with polymer. However, due to the agglomeration issue stated earlier, it was found that the hydrogen bonds formed between dried bio-nanofillers are difficult to redisperse and breakdown.34 This was further correlated to the deteriorating mechanical properties and poor resistance against water vapor diffusion. Alternatively, processing these natural nanofillers in a hydrated state, by solvent casting, has been previously studied due to the ability of achieving a good dispersion of the nanofillers within a matrix.23,24,35 As a result, significant improvements in mechanical, barrier properties were obtained, but solvent casting is not a process that can currently be implemented into an industrial scale for mass production. Additionally, a problem associated with solvent casting is the effects of solvent on the overall properties of the end product and efficiency of solvent removal. Another method that has shown to produce well dispersion of bio-nanofillers in PLA through electrospinning, but more investigation is needed for the optimization of its properties.22,34

More recently, to address the complications of dispersing dried fillers and scalability of processing, melt mixing of bio-nanofiller suspensions in PLA have been previously examined to analyze filler dispersion, and thermal and mechanical properties.25–27 Nanowhisker loadings ranging from 0.5 to 5 wt% were investigated. Thermal degradation was found to be an issue during processing as a result of the solvolytic degradation of N,N-dimethylacetamide, which was used as a swelling and separation agent, and hydrolysis of PLA. Morphology of the composites revealed some dispersion of nanowhiskers accompanied by agglomerates. There was a noticeable change in the size of the agglomerates as they increased with nanowhisker loading. Some improvements in the elastic modulus and tensile strength were observed with the addition of the nanowhiskers, however, addition of certain compatibilizers and modifications had also caused weakening of the neat matrix. Since PLA is a common polymer used for packaging, barrier properties is an important aspect of the material that should be examined, but it was not reported in these studies.

It is generally found that the incorporation of fillers into polymers lead to an increase in the degree of crystallinity of the composite because the fillers can influence the nucleation of crystals.26,36,37 Furthermore, previous studies have investigated the effects of crystallinity on the diffusion of water vapor and discovered that a rise in crystallinity can reduce the diffusion coefficient of water vapor.38,39 This was explained by the structure of crystalline domains and the orientation of polymer chains, which in turn affects the mobility of water vapor through the composite. Additionally, incorporating fillers into a polymer forms a more tortuous path for water vapor to travel across the composite. As a result, nanocomposites usually show better water vapor resistance than the neat polymer matrix by itself, but is also dependent on the type of filler.24,40,41 Poor filler–matrix interfacial properties results in air gaps within the composite that can allow water vapor to diffuse easily through the material. A past research studied the water absorption of composites with macro sized chitin waste incorporated into polypropylene and showed an increase in water absorption with increasing chitin loading as expected from the hydrophilicity of chitin.42 Fillers that can absorb, interact, or react with the permeating gas molecule can have an effect on promoting or resisting the diffusion of vapor permeance through the composite.

The combination of various studies has shown the potential of bio-nanofillers to replace existing inorganic fillers as they are able to provide effective enhancement in different material properties. However, current studies lack the examination of CNW composites in a polymer matrix that is not susceptible to degradation and the investigations of water vapor barrier properties, which is crucial to many applications. This study aims to explore the use of direct melt blending of CNW/PP composites to analyze the effects of the incorporation of CNW and compatibilizer into polypropylene on its thermal, barrier, mechanical, and rheological properties. Moreover, connections between the properties at high and low weight percentages of CNW will be detailed to provide a better understanding of the behaviors that they exhibit. Lastly, the scalability of the process based on the performance of the composites will be evaluated.

2. Experimental

2.1. Materials

CNW supplied by BOCO Technology Inc. was used as the composite filler and its chemical structure is provided in Fig. 1. Its aspect ratio and density are approximately 20–50 and 1.45 g cm−3 respectively. The composite matrix used in this study was a homopolymer PP (ExxonMobil Achieve™ 3854) with a density of 0.9 g cm−3 and the compatibilizer was a maleated PP (MAPP) (Eastman™ G-3003 Polymer).

2.2. Processing of CNW/PP composites

A co-rotating twin screw micro compounder (DSM Xplore® MC 15) was used to melt blend the CNW/PP composites. The PP and MAPP was first fed into the compounder operating at 170 °C and 200 rpm, then the CNWs were added into the melt. The four main compositions processed were 1, 2, 5, and 10 wt% CNW in PP. Additionally, two sets of the four compositions, with and without compatibilizer, were prepared to investigate both the effects of the CNW and the compatibilizer on the composite. In this study, the composites with and without compatibilizer are denoted by CNW/PP and CNW/MAPP respectively following their weight percentages. A set of neat PP was also processed before testing to have consistent thermal and processing history with the other compositions for comparison. The compounded material extruded from the compounder was then pelletized for further processing.

The pelletized compound containing CNW and PP were either compression molded using a hydraulic hot press (Carver, Inc.) or injection molded using a micro injection molding machine (DSM Xplore® IM 5.5). Composite films, less than 200 μm in thickness, were prepared by compression molding at 180 °C and 1000 psi in a thin mold for water barrier testing. The samples for rheological testing were also compression molded under the same conditions but slow cooled and using a different mold that provided rectangular samples with the dimensions of 10 mm by 18 mm by 0.7 mm. For mechanical testing, the samples were prepared by injection molding at 180 °C and 100 psi to produce type IV specimens. A schematic of all the processing methods used in this study are shown in Fig. 2.


image file: c6ra11623j-f2.tif
Fig. 2 Schematic of melt compounding (a), compression molding (b), and injection molding (c) processing methods.

2.3. Characterization of CNW and CNW/PP composites

2.3.1. Morphological analysis. Morphology of the CNWs and melt compounded CNW/PP and CNW/MAPP composites were analyzed using scanning electron microscopy (SEM) and atomic force microscopy (AFM) to see the dispersion of the CNWs in the PP matrix. A scanning electron microscope (FEI Quanta™ 250 FEG ESEM) was used for examining dried CNWs and nitrogen fractured cross section surfaces of the composites. These specimens were sputter coated with platinum prior to SEM imaging to minimize charging at the surface of the sample. An atomic force microscope (Bruker) was used to further confirm observations from the SEM imaging for the dried CNWs and microtomed cross sections of the composites.
2.3.2. Thermal analysis. The thermal stability of the PP and CNW/PP composites were observed through thermogravimetric analysis (TGA) by using the TGA Q50 (TA Instruments) under nitrogen atmosphere. Samples were heated at a rate of 20 °C min−1 from room temperature (25 °C) to 600 °C to ensure complete thermal degradation. The degradation temperatures of each composition were determined from the weight change curves. Further thermal analysis of the PP and CNW/PP composites were performed through differential scanning calorimetry (DSC) by using the DSC Q2000 (TA Instruments) under nitrogen atmosphere. This helped measure the enthalpy of fusion, and melting and crystallization temperature of the composites. A heat–cool cycle between room temperature (25 °C) and 200 °C at a rate of 10 °C min−1 was used so that the composites were tested below their degradation temperatures.
2.3.3. Water vapor barrier test. Water permeance of the CNW/PP and CNW/MAPP composite films were measured using the water method mentioned in ASTM E96 by monitoring the weight change the test dishes over a period of one to three weeks to ensure steady weight loss was achieved. Each test dish contained the same volume of water to begin with and had the compression molded films mounted on top of them. The test dishes were kept in an incubator at a controlled temperature and humidity, which were 50 °C and 0% RH respectively, throughout the duration of the test. Three samples of each composition were prepared for comparison and the rate of water loss was extracted from a linear fit of the plot of weight change with respect to time at the end of each test. Further calculations were performed to obtain the values for water vapour transmission and permeance.
2.3.4. Mechanical analysis. The Microtester 5848 (Intstron) was used for tensile testing based on ASTM D638 standard using a Type IV tensile specimen. An average of four to six samples for each composition was taken to ensure consistency of the results. The elastic modulus, ultimate tensile strength, and elongation strain at break were extracted from the tensile curves for comparison.
2.3.5. Rheological analysis. A extensional viscosity test was performed on the ARES rheometer (TA Instruments) with an extensional viscosity fixture to measure the extensional viscosity of the composites at a temperature and strain rate of 180 °C and 1.0 s−1 respectively. An average of three samples for each composition was taken for the test.

3. Results and discussion

3.1. Morphology of CNW and CNW/PP composites

Morphological analysis of the composites was important because it provided information on the quality of the material produced from the specified processing method based on filler dispersion. It also helped predict some of the material properties. The initial AFM and SEM images shown in Fig. 3(a) and (b) presents the dried form of CNW fillers used in this study.
image file: c6ra11623j-f3.tif
Fig. 3 AFM (a) and SEM (b) images of the morphology of dried CNWs.

The height image from the AFM of the dried CNWs confirmed the nanoscale of the nanowhiskers based on their observed high aspect ratios. A higher magnification of the dried CNWs under SEM showed the agglomeration of the CNWs as stated before from the hydrogen bonds that they form with each other when dehydrated, hence a fibrous mat is formed.

As for the AFM of the CNW composites, a constant force, that was able to deform the PP matrix, was applied throughout the sample to perform a modulus mapping of the surface since it was known that the modulus of CNWs is higher than neat PP. This helped confirm the existence of the CNWs and its dispersion observed in the SEM images of the composites. Comparisons between the morphologies of the various CNW/PP compositions using AFM and SEM are shown below in Fig. 4.


image file: c6ra11623j-f4.tif
Fig. 4 AFM images of the cross sections of neat PP (a), 1% (b), 2% (c), 5% (d), and 10% (e) CNW/MAPP, and SEM images of the cross sections of 1% (f), 2% (g), 5% (h), and 10% (i) CNW/MAPP, and 10% CNW/PP (j).

In the AFM images, the light and dark areas indicated higher and lower modulus respectively. Since CNWs have a higher modulus, therefore, they appeared as the lighter areas where as the darker areas were representative of the PP matrix. AFM of the neat PP was provided as a control sample to verify the integrity of what is observed in the composites containing CNWs. The AFM images of Fig. 4(b)–(e) corresponded to the SEM images of Fig. 4(f)–(j). In the AFM images, it was evident that the dispersion of the CNWs were not completely uniform and slight agglomeration of the CNWs had occurred. In the SEM images, the CNW agglomerates appeared as nanosized circular particles because of two possible reasons. The first being that the agglomerates are seen as the cross sections of the CNW sand the second being the actual formation of dried spherical particles as a result of the processing method. The latter reasoning is more likely as it can be explained by the drying of a droplet of CNW suspension.33 This is because during melt blending, it was possible for the suspension to break up into droplets from the shear forces and subsequent water removal.

The AFM images of the 1% CNW/MAPP and 2% CNW/MAPP composite did not show any large CNW particles, which suggested a good dispersion but with minimal agglomeration as seen in its SEM image. At 5% CNW loading, a noticeable amount of agglomerates are dispersed throughout the PP matrix, but the size of the agglomerates are still comparable with the agglomerates at 2% CNW loading. In the images of the composites at 10% CNW loading, there was a substantial increase in the size of the agglomerates when compared with the composites at lower CNW loadings, however, dispersion of the agglomerates was maintained.

Between the 10% CNW/MAPP and CNW/PP composites, no significant differences were observed since the dispersion and agglomeration looked similar. Moreover, based on the AFM and SEM images, the interfacial interaction between the CNW and PP was difficult to detect due to the limitations of the probe tip size of the AFM and the issues with charging at high magnifications for polymer composites, which are nonconductive, in the SEM. Although a considerable amount of agglomerates were formed, the dispersion of the agglomerates may still serve as an advantage for certain properties. Therefore, the dispersion of the CNWs in the composites is a critical aspect to know as it will be seen the effects it has on the properties addressed in the following sections.

3.2. Thermal properties

Thermal stabilities of the CNW/PP and CNW/MAPP composites were analyzed using their respective TGA and DSC curves. The onset temperature of degradation was determined using the TA Universal Analysis software. For the analysis of the crystallinity, and melting and crystallization temperature of the composites, the first heating and cooling curve from the DSC was used for analysis for comparing the materials as processed. The degree of crystallinity of the composites were calculated based on the enthalpy of fusion values obtained from the melting curves of each composition using the TA Universal Analysis software and the following equation:
 
image file: c6ra11623j-t1.tif(1)

In eqn (1), Xc (%) and ΔHf (J g−1) are the degree of crystallinity and the enthalpy of fusion of the experimental sample respectively, and ΔHof (J g−1) is the enthalpy of fusion of the 100% crystalline polymer. The enthalpy of fusion of a 100% crystalline polypropylene used in this study was 207 J g−1, which was retrieved from the literature.43 Fig. 5 and Table 1 below shows the TGA and DSC curves for analyzing the thermal properties of all the composites.


image file: c6ra11623j-f5.tif
Fig. 5 TGA curves for CNW/PP composites (a) and CNW/MAPP composites (b), and heat–cool DSC curves for CNW/PP composites (c) and CNW/MAPP composites (d).
Table 1 Thermal properties extracted from the TGA and DSC curves
Sample Degradation onset temperature [°C] Melting temperature [°C] Crystallization temperature [°C] Crystallinity [%]
PP 469.37 156.97 109.05 28.79
1% CNW/PP 481.80 151.67 116.60 36.98
2% CNW/PP 475.39 151.29 116.59 35.13
5% CNW/PP 473.10 152.69 116.46 36.06
10% CNW/PP 471.36 152.70 116.86 35.90
1% CNW/MAPP 480.80 150.76 115.70 38.62
2% CNW/MAPP 474.70 151.03 115.66 36.92
5% CNW/MAPP 472.91 152.94 114.65 35.46
10% CNW/MAPP 474.19 157.14 114.99 34.89


From the TGA curves, the onset of degradation was at a higher temperature for both the CNW/PP and CNW/MAPP composites in contrast with the neat PP. An increase of up to 12 °C was observed, which may have resulted from the enhanced heat transfer provided by the CNW dispersed within the matrix to help dissipate the heat. This correlated with the rate of degradation that was reduced with the addition of CNW. Therefore, the addition of CNW showed improvements in the thermal stability of the composite, but at CNW loadings greater than 1 wt%, the thermal stability of the composite gradually decreased and approached the thermal degradation properties of neat PP. This was possibly due to the increase in CNW agglomeration resulting in the dispersion of larger particles, which provided less effective heat dissipation. Although the addition of the compatibilizer could have improved CNW dispersion, the onset of degradation temperatures of the CNW/MAPP composites were still slightly lower than CNW/PP composites. This was as a result of the lower onset of degradation temperature of neat MAPP, which was determined to be 466.64 °C.

Similarly, the crystallization temperature and degree of crystallinity of both the CNW/PP and CNW/MAPP composites were higher than the neat PP. This suggested that the CNWs acted as nucleation sites in promoting crystallization, however, the crystallinity of the composites did not increase after the addition of 1 wt% CNW due to the agglomeration of the CNWs at higher wt%. The ability of fillers to induce crystallization in PP has been shown by past studies through the formation of a transcrystallinity layers at the filler–matrix interface.44 Since the PP used in this study did not inherently have a high crystallinity, the potential of crystal growth restriction was minimized. Although agglomerates formed at higher wt%, the degree of crystallization still increased because the larger particulates remained as nucleation sites for crystallization. On the other hand, the melting temperature of both the CNW/PP and CNW/MAPP composites decreased when compared to the neat PP. The reason for this is because CNWs can act as impurities in the matrix and allow polymer chains to move more freely, therefore increasing the entropy of fusion of the composite and lowering the melting temperature. Between the CNW/PP and CNW/MAPP composites, no significant differences were observed with the added compatibilizer in terms of the overall thermal properties.

3.3. Water vapor barrier properties

The plots of weight change against time for each set of compositions were generated from the weight measurements gathered and are shown in Fig. 6(a) and (b). A linear fit was applied to each set of data and the slope, which represented the rate of water vapor travelling across the film, was obtained for calculations of the water vapor transmission (WVT) and permeance (WVP) using the equations below:
 
image file: c6ra11623j-t2.tif(2)
 
image file: c6ra11623j-t3.tif(3)

image file: c6ra11623j-f6.tif
Fig. 6 Water loss vs. time curves of CNW/PP (a) and CNW/MAPP (b) composites, and water vapor permeance vs. CNW loading of CNW/PP and CNW/MAPP composites (c).

In eqn (2), G (g) is the weight change, t (hours) is the time, and A (m2) is the test area of the specimen. This equation helped determine the rate at which the water vapor was flowing through the sample. In eqn (3), S (Pa) is the saturation vapour pressure of at the test temperature, R1 is the relative humidity inside the test dish expressed as a fraction, and R2 is the relative humidity of the test chamber expressed as a fraction. Similar to eqn (2), eqn (3) quantified the rate of water vapor transmission through the film, but it also considered the pressure difference induced by the temperature and humidity. The water vapor permeance of all the compositions plotted with respect to CNW loading is shown in Fig. 6(c).

Based on the weight change curves of both CNW/PP and CNW/MAPP composites, the addition of chitin was observed to decrease the amount of water loss over time. Furthermore, the CNW/MAPP composites showed a smaller decrease overall when compared to the CNW/PP composites. Upon examination of the change in WVP with chitin loading, it was found that the minimum WVP occurred at low weight percentages of CNW and began to increase at higher weight percentages. This was consistent with a previous study that had observed a similar trend in WVP of chitin nanoparticles in starch where the addition of chitin nanoparticles showed a decrease in WVP at low loading and then began to increase, which was explained due to the formation of agglomerates.24 The optimal WVP of the composites were at 1 and 2% CNW loading for CNW/PP and CNW/MAPP respectively. This can be explained by the dispersion of CNW over a large surface area in the PP impeding the diffusion of water vapor across the film. Additionally, the effects of compatibilizer was not as pronounced at lower CNW loadings whereas the decrease was more significant at higher CNW loadings, which suggested that the compatibilizer was more effective at higher CNW loadings.

From the results obtained, the three main factors that could have contributed to the decrease in WVP of the composites includes the effects of the filler, crystallinity, and compatibilizer. Firstly, the inclusion of the CNW in PP created a more tortuous path for the water vapour to pass through. At higher CNW loadings, the WVP did not continue to reduce due to larger agglomerates of the CNW as observed from the SEM and AFM images shown previously. This lowered the amount of particles, which blocked the paths for water vapor to pass through. Furthermore, CNW is hydrophilic, therefore it was possible for the CNWs entrapped in the matrix to absorb the water vapour as it tried to pass through the composite film. As a result, the rate of diffusion of the water vapour through the composite was reduced. Additionally, the CNW in the PP influenced the crystallization of the polymer causing an increase in the crystallinity of the composite as shown from the DSC data earlier. As mentioned earlier, due to the morphology of crystalline domains, small molecules generally cannot penetrate through them.38 Since the degree of crystallinity of the composites at higher CNW loading were comparable to the lower CNW loading composites because of the CNW particles inducing crystallization, therefore the WVP remained below the neat PP. Lastly, the addition of the compatibilizer had two possible effects to lower the WVP of the composites. The partial hydrophilic nature of the compatibilizer could have interacted with the water to slow its diffusion pass the composite. Moreover, the purpose of the compatibilizer was to help enhance the interaction between the filler and the matrix since poor interaction can lead to interfacial gaps resulting in an increase in WVP. Therefore the compatibilizer indicated improvements in CNW and PP interaction as the WVP of the CNW/MAPP composites were lower than the CNW/PP composites.

3.4. Mechanical properties

Tensile properties of the CNW/PP and CNW/MAPP composites in terms of elastic modulus, ultimate tensile strength, and elongation strain at break were extracted and plotted against their respective compositions in Fig. 7.
image file: c6ra11623j-f7.tif
Fig. 7 Elastic modulus (a), ultimate tensile strength (b), and elongation strain at break (c) of CNW/PP and CNW/MAPP composites at 1, 2, 5, and 10 wt% CNW loading.

The elastic modulus of both the CNW/PP and CNW/MAPP composites showed an improvement compared to the neat PP. This increase in elastic modulus was expected since it typically improves with the incorporation of rigid fillers in a polymer matrix.2,3,11,25 The optimal compositions were at found to be at 2 and 5 wt% CNW loading for the CNW/PP and CNW/MAPP respectively as an increase of up to 20% in the stiffness was observed. Similarly, the ultimate tensile strength of the CNW/PP and CNW/MAPP composites also showed an increase compared to the neat PP and had the same optimal compositions as the elastic modulus. An increase of 17% in the ultimate tensile strength was observed. The increase in mechanical properties suggested that the CNW showed some reinforcement of the PP from its ability to take on the stress transferred from the matrix. Furthermore, it was possible for transcrystallinity to occur at the CNW–PP interface, which causes crystals to grow perpendicular to the fiber axis, and increase its interfacial strength.44 It was also suspected that the partially well dispersed CNWs helped strengthened the mechanical properties by forming a stress distribution throughout the composite oppose to one localized area. The low standard deviation within the values for each composition further supported the uniformity of the dispersion of the CNWs throughout the matrix. Moreover, the purpose of adding a compatibilizer was to improve the bonding between CNW and PP and the dispersion of CNW in PP. However, the use of the compatibilizer did not show effective reinforcement until 5 wt% loading, where the elastic modulus and tensile strength surpassed the composite without compatibilizer. At lower CNW loading, the use of compatibilizer seemed to hinder oppose to enhance the mechanical properties of the composite. Additionally, at 10 wt% CNW loading, the elastic modulus and ultimate tensile strength began to greatly decrease due to a rise in agglomeration and agglomerate size acting as stress concentrators and deteriorating the overall mechanical properties of the composites. This was consistent with many other polymer composites studied previously.17,25,26,41 Although the elastic modulus and ultimate tensile strength at 10 wt% CNW was not at high as the optimal values, the mechanical properties were still comparable to the neat PP possibly due to the partially well dispersed agglomerates.

As for the elongation strain at break, there was a dramatic reduction upon the slightest addition of CNW for both the CNW/PP and CNW/MAPP composites. They continued to decrease with further CNW addition because the composite became rigid and started behaving like a brittle material. There are two different phenomena that can explain this trend. At low CNW loading, the reinforcing fillers restrained the movement of the matrix causing limited elongation at break. Alternatively, at high CNW loading, the introduction of larger agglomerates created localized stress concentration within the composite, which caused the composite to fail early without exhibiting much reinforcement. Further analysis of the composites was done using a rheological test in the next section to verify some of the behaviors exhibited by the composites.

3.5. Rheological properties

A uniaxial extension test was performed on the composites to determine their elongation viscosities, which is defined as the extensional stress over the strain rate. The rheological properties of the CNW/PP and CNW/MAPP composites based on elongation viscosity are presented in Fig. 8.
image file: c6ra11623j-f8.tif
Fig. 8 Extensional viscosity vs. elongation time curves of CNW/PP (a) and CNW/MAPP (b) composites.

The extensional viscosity of the CNW/PP composites did not show much change from one composition to another since it is suspected that there were minimal interactions between the hydrophilic CNW and hydrophobic PP. In contrast, extensional viscosity of the CNW/MAPP composites increased with increasing CNW loading. This meant that a higher stress was required for deformation. This indicated reinforcement between the CNWs and PP matrix because of the enhanced interfacial bonding between them with help of the compatibilizer. As a result, the composite showed resistance against flow of the when the strain was applied. Similar to a previous study, comparisons between composites with and without compatibilizers were investigated using a rheological test.45 No improvements were observed in its rheological properties without the compatibilizer, whereas it improved with increasing filler content of the compatibilized composites. The results from the extensional viscosity test is useful for future development in identifying the optimal processing conditions of the composites. More specifically, it is important for the processing of the composites using fiber spinning, film blowing, or blow molding.

4. Conclusions

In this paper, the morphological, thermal, barrier, mechanical, and rheological properties of melt blended CNW/PP and CNW/MAPP composites with CNW loading ranging from 1 to 10 wt% have been investigated. Results have shown the potential of using CNW to replace current inorganic fillers in polymers for packaging applications. These composites are suitable for environmentally friendly industrial packaging applications as proven by its improved thermal stability, water barrier properties, and strength when compared to neat PP. The significant enhancement in the material properties of the composites were supported by the partially well dispersion of CNWs in the PP matrix observed by AFM and SEM and the reinforcement of the CNW and PP bonding through the use of a compatibilizer. Additionally, the CNWs had a positive impact on the degree of crystallinity of the composites, which greatly improved its water vapor barrier properties. Based on the water vapor transmission test results, it was proposed that the water vapor barrier properties of the composites can be tailored via adjusting the CNW loading in the polymer. The mechanical properties of the composites at their optimal compositions exhibited a significant improvement in its elastic modulus and ultimate tensile strength. This was further backed by the rheological test, which revealed an increase in the extensional viscosity with the addition of CNW for the compatibilized composites. It was evident that the addition of CNW and compatibilizer helped strengthen the composite. Although agglomeration was observed at higher CNW loading, the dispersion of the agglomerates. It is possible that further processing, such as a dilution process, can help to break down the agglomerates. Also, since melt compounding is a scalable process, therefore it can be easily incorporated into an industrial scale production. Lastly, through the knowledge obtained from this study, further optimization studies of the composites can be performed to maximize their respective properties for tailoring towards specific applications.

Acknowledgements

The authors would like to thank Natural Science and Engineering Research Council of Canada (NSERC), Canada Research Chairs program (CRC), Ontario Centers of Excellence (OCE) for providing the financial support to this research work. The authors would also like to give a special thanks to BOCO Technology Inc. for supplying the raw materials used in this study.

References

  1. I. U. Unalan, G. Cerri, E. Marcuzzo, C. A. Cozzolino and S. Farris, RSC Adv., 2014, 4, 29393–29428 RSC.
  2. L. A. Castillo, O. V. López, J. Ghilardi, M. A. Villar, S. E. Barbosa and M. A. García, Food Hydrocolloids, 2015, 51, 432–440 CrossRef CAS.
  3. J. I. Weon and H. J. Sue, J. Mater. Sci., 2006, 41, 2291–2300 CrossRef CAS.
  4. Y. Zhou, V. Rangari, H. Mahfuz, S. Jeelani and P. K. Mallick, Mater. Sci. Eng., A, 2005, 402, 109–117 CrossRef.
  5. V. D. Alves, N. Costa and I. M. Coelhoso, Carbohydr. Polym., 2010, 79, 269–276 CrossRef CAS.
  6. S. Jang, J. Kim and J. Chang, Cellulose, 2009, 16, 445–454 CrossRef CAS.
  7. W. J. Ward, G. L. Gaines, M. M. Alger and T. J. Stanley, J. Membr. Sci., 1991, 55, 173–180 CrossRef CAS.
  8. P. Atayev and M. Oner, J. Plast. Film Sheeting, 2014, 30, 248–265 CrossRef CAS.
  9. M. Sirousazar, M. Yari, B. F. Achachlouei, J. Arsalani and Y. Mansoori, e-Polym., 2007, 7, 305–313 Search PubMed.
  10. M. Kato, M. Matsushita and K. Fukumori, Polym. Eng. Sci., 2004, 44, 1205–1211 CAS.
  11. W. Yuan, J. Cui, Y. Cai and S. Xu, J. Polym. Res., 2015, 22, 1–9 CrossRef CAS.
  12. J. Wang, X. Pan, Y. Xue and S. Cang, J. Elastomers Plast., 2012, 44, 55–66 CrossRef CAS.
  13. M. J. Sobkowicz, J. L. Feaver and J. R. Dorgan, Clean: Soil, Air, Water, 2008, 36, 706–713 CrossRef CAS.
  14. N. Lepot, M. K. Van Bael, H. Van den Rul, J. D'Haen, R. Peeters, D. Franco and J. Mullens, J. Appl. Polym. Sci., 2011, 120, 1616–1623 CrossRef CAS.
  15. L. Reijnders, J. Mater. Sci., 2012, 47, 5061–5073 CrossRef CAS.
  16. M. Rinaudo, Prog. Polym. Sci., 2006, 31, 603–632 CrossRef CAS.
  17. A. Diez-Pascual and A. Diez-Vicente, RSC Adv., 2015, 5, 93095–93107 RSC.
  18. C. D. Tran, S. Duri and A. L. Harkins, J. Biomed. Mater. Res., Part A, 2013, 101, 2248–2257 CrossRef PubMed.
  19. P. C. Srinivasa and R. N. Tharanathan, Food Rev. Int., 2007, 23, 53–72 CrossRef CAS.
  20. E. Khor and L. Y. Lim, Biomaterials, 2003, 24, 2339–2349 CrossRef CAS PubMed.
  21. A. Tareq, M. Alam, S. Raza, T. Sarwar, Z. Fardous, A. Z. Chowdhury and S. Hossain, J. Virol. Microbiol., 2013, 2013, b1–b9 CrossRef.
  22. J. Wei, J. Liu, J. Qiang, L. Yang, Y. Wan, H. Wang, W. Gao and F. Ko, Adv. Sci. Lett., 2012, 10, 649–651 CrossRef CAS.
  23. Y. Ji, X. Wang and K. Liang, RSC Adv., 2014, 4, 41357–41363 RSC.
  24. P. R. Chang, R. Jian, J. Yu and X. Ma, Carbohydr. Polym., 2010, 80, 420–425 CrossRef CAS.
  25. Q. Guan and H. Naguib, J. Polym. Environ., 2014, 22, 119–130 CrossRef CAS.
  26. R. Rizvi, B. Cochrane, H. Naguib and P. Lee, J. Cell. Plast., 2011, 47, 283–300 CAS.
  27. K. Oksman, A. P. Mathew, D. Bondeson and I. Kvien, Compos. Sci. Technol., 2006, 66, 2776–2784 CrossRef CAS.
  28. Y. Zhang, C. Rempel and D. McLaren, Innovations in food packaging, ed. J. H. Han, Academic Press, Amsterdam, 2014, ch. 16, pp. 391–408 Search PubMed.
  29. Y. Huang, M. He, A. Lu, W. Zhou, S. D. Stoyanov, E. G. Pelan and L. Zhang, Langmuir, 2015, 31, 1641–1648 CrossRef CAS PubMed.
  30. A. N. Frone, S. Berlioz, J. Chailan, D. M. Panaitescu and D. Donescu, Polym. Compos., 2011, 32, 976–985 CrossRef CAS.
  31. D. Bondeson and K. Oksman, Compos. Interfaces, 2007, 14, 617–630 CrossRef CAS.
  32. L. Petersson, I. Kvien and K. Oksman, Compos. Sci. Technol., 2007, 67, 2535–2544 CrossRef CAS.
  33. Y. Peng, D. J. Gardner and Y. Han, Cellulose, 2011, 19, 91–102 CrossRef.
  34. M. Martínez-Sanz, A. Lopez-Rubio and J. M. Lagaron, Biomacromolecules, 2012, 13, 3887–3899 CrossRef PubMed.
  35. N. Ljungberg, C. Bonini, F. Bortolussi, C. Boisson, L. Heux and J. Y. Cavaillé, Biomacromolecules, 2005, 6, 2732–2739 CrossRef CAS PubMed.
  36. B. Wang and H. Huang, Polym. Degrad. Stab., 2013, 98, 1601–1608 CrossRef CAS.
  37. F. Amri, S. Husseinsyah and K. Hussin, Composites, Part A, 2013, 46, 89–95 CrossRef CAS.
  38. G. Gorrasi, R. Anastasio, L. Bassi and R. Pantani, Macromol. Res., 2013, 21, 1110–1117 CrossRef CAS.
  39. N. Delpouve, G. Stoclet, A. Saiter, E. Dargent and S. Marais, J. Phys. Chem. B, 2012, 116, 4615–4625 CrossRef CAS PubMed.
  40. K. Nevalainen, S. Auvinen, O. Orell, P. Eteläaho, R. Suihkonen, J. Vuorinen and P. Järvelä, Polym. Compos., 2013, 34, 554–569 CrossRef CAS.
  41. R. Choi, C. Cheigh, S. Lee and M. Chung, J. Food Sci., 2011, 76, N62–N67 CrossRef CAS PubMed.
  42. N. Mohamad, A. A. Latiff, H. E. A. Maulod, M. A. Azam and M. E. A. Manaf, Polym.–Plast. Technol. Eng., 2014, 53, 167–172 CrossRef CAS.
  43. B. Wunderlich, Thermal analysis, Academic Press, Boston, 1990, pp. 417–431 Search PubMed.
  44. R. A. Shanks, Green composites: polymer composites and the environment, ed. C. Baillie, Woodhead Pub., Cambridge, England, 2004, pp. 100–122 Search PubMed.
  45. M. Horst, L. Quinzani and M. Failla, J. Thermoplast. Compos. Mater., 2014, 27, 106–125 CrossRef CAS.

This journal is © The Royal Society of Chemistry 2016
Click here to see how this site uses Cookies. View our privacy policy here.