DOI:
10.1039/C6RA11451B
(Paper)
RSC Adv., 2016,
6, 54785-54792
Enhanced mechanical properties of olefin block copolymer by adding a quaternary ammonium salt functionalized graphene oxide
Received
3rd May 2016
, Accepted 1st June 2016
First published on 2nd June 2016
Abstract
As a promising substitute for traditional thermoplastic elastomers, olefin block copolymers (OBCs) exhibit a marvelous application potential in many fields. To further improve the mechanical properties of OBCs, in this paper, quaternary ammonium salt cetyltrimethyl ammonium bromide (CTAB) was firstly introduced as a modifier for the non-covalent functionalization of graphene oxide (GO), then the modified GO (CTAB-GO) was used as a reinforcing agent for OBCs. With the incorporation of CTAB, a fine dispersion of GO in organic solvent and later in the OBC matrix have been achieved. As a result, the mechanical performance is largely improved, e.g., the increases of tensile strength, elongation at break and Young's modulus are 30%, 13% and 78%, respectively, with 1.0 wt% CTAB-GO incorporation. It is also observed that CTAB-GO exhibits a stronger nucleation ability on crystallization of OBC than pristine GO, which leads to a higher crystallization temperature and smaller size of crystals.
1. Introduction
As olefin polymerization catalyst technology developed during last 50 years, polyolefins have gradually become the most common synthetic polymers. Recently, novel polyolefin-based block copolymers were synthesized by the Dow Chemical Company, using a novel catalyst technology, namely chain shutting technology.1,2 A chain shutting agent was introduced to the catalyst system, which can transfer the growing polymer chains between two catalysts with high and low monomer selectivity.3,4 The olefin block copolymer (OBC) consists of crystallizable ethylene–octene blocks with a low 1-octane comonomer content as hard segments, alternating with amorphous ethylene–octene blocks with high incorporation of octene (soft segments). Furthermore, by controlling the concentration of the chain shutting agent, the length and distributions of both hard and soft segments can be regulated.5,6 Thus the tunable chains structure may impart different apparent performance. The structure–property relationship of OBCs has been studied by many researchers.7–18 Han et al. investigated a stereo-hindrance effect of mesophase separation on the crystallization of OBCs, and they found that crystal lamellae could only grow in mesophase-separated domains, thus no large and compact crystals formed.12 Zuo et al. investigated the structure and morphology development of OBCs (ethylene–octene block copolymers) and ORCs (ethylene–octene random copolymers) with similar overall density during deformation. It was demonstrated that OBC had better crystallization ability than ORC while ORC showed the better connectivity and more effective network due to the molecular weight distribution and chain architecture.13
Due to the outstanding elastic properties, low cost, heat resistance, easy processability and eco-friendly, OBCs are used as a promising substitute for traditional thermoplastic elastomers (TPE). Therefore, OBCs exhibit tremendous application potential in many fields, such as elastic films, toughening agents and damping devices. However, as a potential thermoplastic elastomers, the poor mechanical properties such as low tensile strength and poor dimensional stability resulting from their low crystallinity restrict the OBCs practical application fields. To improve the mechanical properties of OBCs with the aim of broadening its applications, polymer blending and filler reinforcing are the two most commonly used methods.19–30 For example, in our group we blended OBC with poly(lactic acid) (PLA) through melt mixing using ethylene-glycidyl methacrylate (EGMA) as a compatibilizer. EGMA connects OBC through physical interaction, and at the same time, chemical interaction occurs between EGMA and PLA. It was found that by controlling the EGMA amount, the blend sequence and time, some different substructures of dispersed-phase such as core–shell, subinclusions, salami and co-continuous were achieved. However, we didn't research the relation of substructures and properties.19 In our another work we introduced short Kevlar fiber into OBC matrix to improve its mechanical properties.20 We used hydrolysis and polydopamine coating to modify the fiber surface and added it into OBC matrix using the maleic anhydride-grafted polypropylene (PP-g-MAH) as the reactive compatibilizer. As a result, the mechanical properties of OBC had been significantly improved, but the elongation at break dramatically decreased. Tong et al. prepared OBC/clay nanocomposites by co-precipitation with excess ethanol.23,24 Organically modified montmorillonite (OMMT) presents different dispersion states in the nanocomposites, including collapsed OMMT (c-OMMT) and intercalated OMMT (i-OMMT). It was demonstrated that c-OMMT had stronger nucleation effect than i-OMMT, resulting in different hierarchical structures and mechanical properties. However, the reinforcing effect was not as good as expected.
Since graphene was first exfoliated from graphite by Geim and Novoselov,31 it has attracted tremendous attention of scientific researchers. It is a two-dimensional monolayer sheet, made up of sp2 carbon atoms constructing a honeycomb structure. Graphene possesses high thermal, electronic conductivity and extraordinary mechanical properties, exhibiting tremendous potential applications such as super-capacitors,32 photoelectric products, microelectronic devices,33,34 Li-ion batteries,35,36 biotechnology37 and nanocomposites.38–44 When graphene is used as a kind of nanofiller, the dispersion state, interfacial interaction and crystal morphology play dominate roles in the performance of the composites. Furthermore, these crucial influencing factors are all related to the surface properties of graphene. There are two main strategies of surface modification of grapheme: covalent modification and non-covalent modification.45–47 Covalent modification consists of grafting polymer or organic molecules to graphene through chemical reaction; non-covalent modification is achieved through π–π stacking interaction or van der Waals forces. As an important derivative of graphene, graphene oxide (GO) is covered with hydroxyl, epoxy and carboxyl groups, making it easily modified with functional groups and polymer chains. However, the introduction of functional groups of graphene destroyed the original structure, thus affecting the electrical conductivity and the thermal conductivity. Wang et al. introduced a kind of quaternary phosphorus salt called (1-hexadecyl) triphenylphosphonium bromide for the noncovalent functionalization of graphene, achieving a fine dispersion of graphene in DMAC solvent and in PVDF matrix. As a result, the composite exhibits excellent electric and dielectric properties.48 Li et al. used polyvinyl pyrrrolidone (PVP) and reduction to modify the surface of graphene and then prepared thermoplastic polyurethane (TPU)/graphene nanocomposites. Consequently, the mechanical properties and electrical conductivity had been significantly improved.49
As mentioned above, GO has already been proved as an effective reinforcing agent for polymer composites. Thus it is logical for us to use GO as a modifier for the mechanical property enhancement of OBC. Our goal is to improve its tensile strength and modulus while maintaining its good elongation. The key is to achieve a good dispersion of GO and strong interaction between OBC and GO. Since OBC is hydrophobic and GO is hydrophilic, the surface modification of GO is necessary. In this work, a kind of quaternary ammonium salt called cetyltrimethyl ammonium bromide (CTAB) was introduced to modify the surface of GO. CTAB with a long methylene chain presents hydrophobicity and positively charged CTAB might attach themselves to negatively charged GO sheets via electrostatic interaction, thus improving the interfacial interaction between GO and OBC matrix. The original GO and CTAB modified GO (CTAB-GO) were incorporated into OBC by solution mixing. To demonstrate CTAB can improve the dispersion of GO in OBC matrix and enhance the interfacial interaction between GO and OBC, the microstructures and macroscopic properties were systematically investigated.
2. Experimental section
2.1 Materials
The OBC (trade name D9530) was kindly provided by Dow Chemical Company. The weight-average molecular mass, polydispersity (Mw/Mn) and melt flow index of OBC are 78
640 g mol−1, 2.6 and 5 g/10 min, respectively. The overall octene content in OBC is 10.4% and the weight percentage of the hard block is 35.0%. Graphite powders were purchased from Qingdao Black Dragon graphite Co., Ltd., China. Potassium permanganate (KMnO4), sulfuric acid (H2SO4 98%), hydrogen peroxide (H2O2) and sodium nitrate (NaNO3), sodium hydroxide (NaOH) were purchased from Kermel Chemical reagent plant (Chengdu, China). Hexadecyl trimethyl ammonium bromide (CTAB) was purchased from Alfa Aesar. All reagents were used as received.
2.2 Methods
2.2.1 Preparation of graphite oxide (GO). GO was prepared from graphite by a modified Hummers method. In a typical reaction, graphite (2 g) was mixed with NaNO3 (1 g) and H2SO4 (50 mL) at 0 °C in an ice bath, then KMnO4 (6 g) was slowly added into the system over 1 h while kept stirred. The mixture was kept at 0 °C for 2 h. After removal of the ice-bath, the mixture was stirred in a 35 °C water bath for 30 min. Then, distilled water (100 mL) was gradually added into the system, and the temperature was kept at 98 °C for 3 h. The resulting mixture was further treated with 5% H2O2 (50 mL) to reduce the residual permanganate and manganese dioxide, stirred for one night at room temperature. At last, it was filtered and washed by centrifugation with deionized water for several times until it reached neutral. After sonicated for 60 min, graphite oxide was exfoliated down to single sheets and formed a uniform dispersion.
2.2.2 Preparation of CTAB non-covalent modified graphite oxide (CTAB-GO). First, GO aqueous solution (0.5 mg mL−1) was sonicated for 30 min and CTAB was dissolved in deionized water stirred in another beaker (1 mg mL−1). Then, the CTAB solution was gradually added into the stirred GO solution. This mixture was kept stirred for 2 h at 50 °C. Suspended solids gradually emerged in the mixture as the stirring time increased due to the electrostatic self-assembly between GO and CTAB (GO is negatively charged while CTAB is positive charged in aqueous solution). Finally, the product was filtered and then washed with deionized water until the filtrate was clear. The remaining product was freeze-dried in vacuum.
2.2.3 Preparation of OBC/CTAB-GO and OBC/GO nanocomposites. A series of nanocomposites containing 0.5, 1.0, and 2.0 wt% CTAB-GO were prepared via solution mixing. Firstly, the OBC was dissolved in xylene solution at 125 °C by magnetic stirring in an oil bath. On the other hand, the CTAB-GO was dispersed in xylene and sonicated for 30 min. The CTAB-GO/xylene mixture was dropwisely added into the OBC/xylene solution under vigorous agitation. Then, the solution was stirred for 2 h at 125 °C. Subsequently, the hot solution was poured into excess ethanol, so that OBC and CTAB-GO were co-precipitated from the solution. The precipitates were filtered and dried in a vacuum oven at 50 °C for 24 h to remove the residual solvent. For comparison, a series of nanocomposites containing 0.5, 1.0 and 2.0 wt% GO were prepared using the same procedure. All nanocomposite samples were molded into films of about 1 mm in thickness at 150 °C. For convenience, the nanocomposites with 0.5 wt%, 1.0 wt% and 2.0 wt% CTAB-GO were designated as OBC/CTAB-GO05, OBC/CTAB-GO1, and OBC/CTAB-GO2, respectively, while those nanocomposites with 0.5 wt%, 1.0 wt% and 2.0 wt% GO were named as OBC/GO05, OBC/GO1 and OBC/GO2, respectively.
2.3 Characterization
2.3.1 Fourier transform infrared analyses (FTIR). The FTIR spectrum of CTAB, GO and CTAB-GO was collected to characterize the functional groups on Nicolet FTIR spectrometer (Nicolet FTIR 6700, Thermo Electron Co., USA) over the wavenumber range 500–4000 cm−1 at room temperature.
2.3.2 Thermal gravimetric analysis (TGA). TGA of CTAB, GO and CTAB-GO was performed on a TA Q500 with a heating rate of 10 °C min−1 up to 600 °C in nitrogen atmosphere. All the loaded samples were about 8–10 mg.
2.3.3 Wide angle X-ray diffraction (WAXD). The interlayer spacing of GO and CTAB-GO was measured using a Philips X'Pert pro MPD apparatus with conventional Cu Kα X-ray (λ = 0.154 nm) at a voltage of 40 kV and a current of 40 mA. The scanning diffraction angle 2θ range was from 5° to 30° at a rate of 0.02° per second.
2.3.4 Scanning electron microscope (SEM). The morphologies and dispersion states of GO and CTAB-GO in aqueous solvent and xylene solvent as well as the fresh-fractured cross-section of the OBC and its nanocomposites surfaces were directly observed using a scanning electron microscope instrument (SEM, JEOL JSM-5900LV). All specimens were sputter-coated with gold powder before SEM examination.
2.3.5 Mechanical property measurements. The tensile experiments under uniaxial tension were carried out on an Instron 5567 universal testing instrument at room temperature. All the tensile specimens were cut from the compression molded films with the thickness of about 1 mm. The displacement rate was 50 mm min−1. At least five specimens were tested repeatedly for each sample.
2.3.6 Polarizing optical microscopy (POM). Polarizing optical microscope observations were performed on a Leica DMIP machine equipped with a hot stage. All the samples were melted in 200 °C and held for 5 min, then the temperature was cooled at a rate of 10 °C min−1. The morphological photographs of non-isothermal crystallization were recorded with the aid of a digital camera.
2.3.7 Differential scanning calorimetry (DSC). A Perkin-Elmer diamond-II differential scanning calorimeter (DSC USA) was used to determine the crystallization and melting behaviors of neat OBC and its nanocomposites. Specimens weighing 4–6 mg were cut from compression-molded films for thermal analysis and all the DSC measurements were performed under dry nitrogen atmosphere. The samples were firstly heated to 200 °C at a rate of 10 °C min−1 and held for 5 min to eliminate the thermal history. Subsequently, the samples were cooled to 30 °C at a rate of 10 °C min−1 to record the non-isothermal crystallization behavior. Thereafter, the specimens were heated again to 200 °C at a rate of 10 °C min−1 and the DSC melting curves were recorded. The temperature was calibrated with indium (Tm = 156.6 °C, ΔHm = 28.45 kJ kg−1) and zinc (Tm = 419.47 °C, ΔHm = 108.37 kJ kg−1). The degree of crystallinity (Xc) of all samples is reckoned according to the commonly adopted equation:
where ΔHm and ΔH0m are the enthalpies of the melting of crystalline phase of OBC and the prefect PE crystals (ΔH0m = 290 J g−1), respectively.
3. Results and discussion
3.1 Surface modification of GO via CTAB
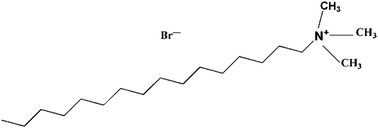
The chemical structure of CTAB is shown in Fig. 1. From Fig. 1, we can reasonably infer that the methylene chain of CTAB endows it with hydrophobicity and positively charged CTAB might attach themselves to negatively GO sheets via electrostatic interaction.
 |
| Fig. 1 Chemical structure of CTAB. | |
To investigate if GO really has been non-covalent modified by CTAB, the FTIR spectra of CTAB, GO and CTAB-GO were measured and shown in Fig. 2. From the FTIR spectrum of CTAB, we notice that multiple characteristic adsorption peaks are evident. Two strong peaks at 2918 and 2850 cm−1 correspond to absorptions of the methylene (–CH2), and the peaks at 1466 and 1376 cm−1 arise from the methyl (–CH3), and the peak at 720 cm−1 reflects the vibration of the methylene chain (–(CH2)n–). The FTIR spectrum of GO exhibits four characteristic peaks at 3439, 1720, 1638 and 1087 cm−1 corresponding to O–H, C
O, C
C and C–O vibrations, indicating the successful oxidation of graphite by the Hummers method. As expected, we notice that the characteristic adsorption peaks of CTAB and GO mentioned above, such as the adsorption peaks of –(CH2)n–, –CH3, O–H and C
O, are all presented at the FTIR spectrum of CTAB-GO.
 |
| Fig. 2 FTIR spectra of CTAB, GO, and CTAB-GO. | |
Since CTAB-GO was collected after washed many times with deionized water and the existence of unreacted CTAB should be excluded. Thus it can be concluded that CTAB has been successfully non-covalent functionalized on GO sheets, which can be attributed to electrostatic interaction between negatively charged GO and positively charged CTAB.
To further determine the mass fraction of CTAB in CTAB-GO, thermogravimetric analysis (TGA) of CTAB-GO was performed. From Fig. 3, one observes that the weight loss that occurs during thermal decomposition of CTAB-GO is attributed to the removal of the CTAB and the pyrolysis of oxygen-containing groups such as –COOH and –OH in the plane of GO. The residual weight of GO and CTAB-GO after the decomposition is 55 wt% and 49 wt%, respectively. CTAB is completely decomposed when heated up to 260 °C, which means that the residual substance of GO and CTAB-GO after the decomposition is the same. Thus it is calculated that CTAB-GO consisted of 89 wt% (49%/55%) GO and 11 wt% CTAB.
 |
| Fig. 3 TGA tests of CTAB, GO, and CTAB-GO, measured under N2 atmosphere. | |
WAXD was also carried out to compare the interlayer spacing of GO and CTAB-GO, to further confirm that GO had been modified by CTAB through electrostatic interaction. Fig. 4 shows the WAXD patterns of GO and CTAB-GO. GO has a characteristic diffraction peak at 2θ = 10.6° corresponding to an interlayer spacing of 0.84 nm; while the WAXD pattern of CTAB-GO shows a peak at 2θ = 8.8° with 1.00 nm d-spacing. The interlayer spacing increasing from 0.84 nm to 1.00 nm could be caused by the intercalation of CTAB between the GO layers. Positively charged CTAB is attracted to the plane of negatively charged GO due to the electrostatic interaction, thus enlarging the inter-layer spacing.
 |
| Fig. 4 WAXD patterns of GO and CTAB-GO. | |
The stability of dispersions of GO sheets and CTAB-GO sheets in H2O or xylene were investigated and shown in Fig. 5. From Fig. 5a, GO exhibits stable and homogeneous dispersion without any precipitation in H2O. However, some black precipitates at the bottom and supernatant at top are observed in xylene, as shown in Fig. 5b. In contrast to GO sheets, CTAB-GO sheets exhibit fine dispersion without any precipitation in xylene solvent (Fig. 5d) while its agglomerates suspend in H2O are observed (Fig. 5c), indicating a change of its surface property from hydrophilic to hydrophobic.
 |
| Fig. 5 Digital pictures of GO/H2O (a), GO/xylene (b), CTAB-GO/H2O (c) and CTAB-GO/xylene (d). The concentration of all solutions is 0.1 mg mL−1. | |
To further confirm the difference of surface property between GO and CTAB-GO, scanning electron microscope (SEM) was carried out. As shown in Fig. 6a, monolayer CTAB-GO sheets nearly without any multi-layer sheets are clearly observed in xylene solvent and it exhibits fine dispersion. Nevertheless, several GO sheets aggregate forming multi-layer structure thus precipitated from xylene solvent, as Fig. 6b shows. All above confirms that CTAB endues a change of GO surface property from hydrophilic to hydrophobic, which is beneficial for improving the interfacial interaction and mechanical properties of OBCs.
 |
| Fig. 6 SEM images of CTAB-GO/xylene (a) and GO/xylene (b). | |
3.2 Tensile properties
In this study, we incorporated pristine GO and chemical modification CTAB-GO into OBC, with the purpose of getting a high-performance composite. Stress–strain curves for OBC and its nanocomposites as well as tensile strength, Young's modulus and elongation at break of the composites as a function of GO and CTAB-GO content are presented in Fig. 7 and 8, respectively. The mechanical data are summarized in Table 1.
 |
| Fig. 7 Stress–strain curves of the neat OBC and its nanocomposites. | |
 |
| Fig. 8 Effects of GO and CTAB-GO contents on tensile strength (a), elongation at break (b), Young's modulus (c) respectively. | |
Table 1 Mechanical properties of the neat OBC and its composites
Sample |
Tensile strength (MPa) |
Elongation at break (%) |
Young's modulus (MPa) |
OBC |
7.92 ± 0.21 |
2253 ± 24 |
21.72 ± 0.37 |
OBC/CTAB-GO05 |
9.11 ± 0.32 |
2232 ± 32 |
30.40 ± 0.48 |
OBC/CTAB-GO1 |
10.41 ± 0.38 |
2539 ± 16 |
38.73 ± 0.25 |
OBC/CTAB-GO2 |
7.17 ± 0.46 |
1923 ± 28 |
30.06 ± 0.42 |
OBC/GO05 |
8.12 ± 0.27 |
2035 ± 43 |
25.24 ± 0.53 |
OBC/GO1 |
7.27 ± 0.33 |
1850 ± 18 |
24.95 ± 0.48 |
OBC/GO2 |
6.56 ± 0.41 |
1722 ± 24 |
19.75 ± 0.36 |
From Fig. 7, the stress–strain curves of neat OBC and its nano-composites appears to be similar, exhibiting typical characteristics of elastomer, i.e., a yield plateau at low strains and strain-hardening at the late stage. The detailed comparison of two types of composites are presented in Fig. 8. From Fig. 8a, we notice that the tensile strength of OBC/CTAB-GO is always higher than OBC/GO. The tensile strength for OBC/CTAB-GO with 1.0 wt% filler content is 10.41 MPa, which is much higher than 7.9 MPa of neat OBC. With the incorporation of 2.0 wt% CTAB-GO, the tensile strength decreases instead. This phenolmenon could be attributed to the fact that small amount of CTAB-GO could disperse well in the OBC matrix but when the filler content reached 2.0 wt%, CTAB-GO might also be inclined to aggregate together, resulting in a poor stress transfer. For pristine GO blended composites, with the mass fraction of GO increasing, the tensile strength decreases monotonously. The tensile strength for OBC/GO with 0.5 wt% filler content is 8.12 MPa, nearly equal to that of neat OBC. With the GO load of 1.0 wt% and 2.0 wt%, the tensile strength are even lower than that of neat OBC. In addition, we notice that the similar tendency occurs from Fig. 8b and c, i.e., the elongation at break and Young's modulus of OBC/CTAB-GO are always higher than those of OBC/GO. For CTAB-GO enhanced composites, the elongation at break and Young's modulus increased first and then decreased with the increase of mass fraction of CTAB-GO, and OBC/CTAB-GO with 1.0 wt% filler content possesses the highest values of the tensile strength, Young's modulus and elongation at break, which are 10.41 MPa, 38.73 MPa and 2539%, respectively. For pristine GO blended composites, the elongation at break and Young's modulus decreases monotonously as the content of GO increases.
It should be noted that among the CTAB-GO blended composites, OBC/CTAB-GO1 with 1.0 wt% CTAB-GO possesses the best tensile properties; for GO blended composites, with the increase of the content, the tensile properties show a decreasing trend. We choose 0.5 wt% as the minimum content, for the reason that too small content of GO (CTAB-GO) might not improve the tensile properties of OBC significantly. In addition, too small content of GO could disperse well in OBC matrix so that it doesn't need to modify the surface of GO. To achieve the best property enhancement, a future work will be focused on the OBC/CTAB-GO composites with filler contents between 0.5 and 1.0 wt% as well as between 1.0 and 2.0 wt%.
3.3 Morphologies and dispersion of GO/CTAB-GO in nanocomposites
As is known, the dispersion of nanofillers in the polymer matrix plays a crucial role in the physical properties of polymers. In order to find out the reason of the different enhancement effect of CTAB-GO and GO on OBC matrix, polarizing optical microscopy was used to observe the dispersion of CTAB-GO and GO in OBC matrix, and the result is shown in Fig. 9. From Fig. 9c, it can be observed that some big dark masses (as highlighted by the red circles) exist in POM photographs of OBC/GO1. It is speculated that these dark masses should be the agglomerates of GO, as a result of poor compatibility with matrix OBC. However, there is no similar dark masses for CTAB-GO enhanced composites (Fig. 9b), showing a better dispersion than pristine GO, thus indicating the introduction of CTAB indeed improve the dispersion of GO in OBC matrix. From Fig. 9, one also observes that the size of spherulites of neat OBC and its composites present a great difference. With 1.0 wt% CTAB-GO, the crystalline morphology of OBCs becomes tiny grains and the number of crystallites is so many that the boundaries are vague to distinguish (Fig. 9b), showing the strong nucleation effect of CTAB-GO on OBC matrix. On the other hand, we notice that different from OBC/CTAB-GO composites, the morphologies of OBC/GO composites show larger size of crystallite and clear boundaries, which implies the less nucleation sites. All above mentioned reveals that CTAB-GO has stronger nucleation ability on crystallization of OBC, which is a result of better dispersion and interfacial interaction between CTAB-GO and the OBC matrix. The good dispersion of CTAB-GO in OBCs can be further observed from SEM observation. Showing as example, the SEM images of the fracture surface of OBC/CTAB-GO1 and OBC/GO1 are shown in Fig. 10. It can be easily seen from Fig. 10a that with 1.0 wt% CTAB-GO, it disperses finely in the OBC matrix and is wrapped with OBC matrix, indicating strong interfacial interaction between CTAB-GO and OBC matrix. However, as Fig. 10b shows, the aggregates of GO sheets are observed. These results once again certify that the introduction of CTAB leads to a better dispersion state in OBC matrix compared with the pristine GO.
 |
| Fig. 9 POM images of the neat OBC and its nanocomposites. (a) Neat OBC; (b) OBC/CTAB-GO1; (c) OBC/GO1. | |
 |
| Fig. 10 SEM images of the fracture surface of OBC/CTAB-GO1 with 1.0 wt% CTAB-GO (a), OBC/GO1 with 1.0 wt% GO (b). | |
3.4 Thermal behavior and X-ray crystal structural study
Fig. 11 shows the non-isothermal crystallization and subsequent heating DSC curves of the neat OBC and its nanocomposites at various filler contents. The values of melting temperatures (Tm), onset crystallization temperatures (Tc,onset), crystallization peak temperatures (Tc,peak), and crystallinity (Xc) are listed in Table 2. It is easy to see that compared with neat OBC, both types of composites have higher onset crystallization temperatures and crystallization peak temperatures, indicating that both GO and CTAB-GO have a strong heterogeneous nucleating effect on crystallization of OBC. With 1.0 wt% CTAB-GO, the value of Tc,peak of OBC/CTAB-GO1 is 5.54 °C higher than that of neat OBC. However, further increase in the filler CTAB-GO content causes decrease in Tc,peak. Such a phenomenon is frequently reported in the nanocomposites of semicrystalline polymers with low-dimensional carbonaceous nanofiller. In this study, CTAB-GO plays two competing roles in the polymer crystallization: providing more nucleation sites; and confining the mobility of polymer chains to retard crystallization. When the content of CTAB-GO is small, the dominant role is to provide more nucleation sites for OBC crystallization, leading to higher Tc,onset and Tc,peak. With the increasing CTAB-GO content, the geometrical constraint becomes the primary influencing factor, hindering the growth of crystals. However, for OBC/GO composites, both Tc,onset and Tc,peak decrease monotonically with increasing content of GO. This is again attributed to its poor dispersion in OBC matrix. In addition, we find that at the same content, both Tc,onset and Tc,peak of OBC/CTAB-GO composites are higher than those of OBC/GO composites. It should be noted that all the samples have more or less the same crystallinity, disregarding the addition of GO filler and the modification of GO.
 |
| Fig. 11 DSC thermograms of the crystallization (a) and melting process (b) of OBC and its composites. | |
Table 2 Non-isothermal crystallization and melting data of OBC and its nanocomposites
Sample |
Tm (°C) |
Tc,onset (°C) |
Tc,peak (°C) |
Xc (%) |
OBC |
117.73 |
108.12 |
101.46 |
14.62 |
OBC/CTAB-GO05 |
117.77 |
110.53 |
106.05 |
14.61 |
OBC/CTAB-GO1 |
117.91 |
110.75 |
107.00 |
15.09 |
OBC/CTAB-GO2 |
118.07 |
110.46 |
106.34 |
14.69 |
OBC/GO05 |
118.06 |
109.42 |
104.51 |
15.07 |
OBC/GO1 |
118.07 |
109.16 |
104.07 |
15.04 |
OBC/GO2 |
118.24 |
108.85 |
103.71 |
14.90 |
The crystal structure after non-isothermal crystallization of neat OBC and its composites was explored by WAXD. The WAXD patterns of OBC/CTAB-GO composites and OBC/GO composites are shown in Fig. 12. All the WAXD curves show three typical diffraction peaks. The first broad diffraction peak at 2θ = 19.15° is the amorphous peak, and the two distinct diffraction peaks at higher angles represent the (110) and (200) reflections of the orthorhombic crystal structure. From Fig. 11, we notice that the peak positions of both (110) and (200) planes are almost the same, indicating that both CTAB-GO and GO have no effect on crystal structure regardless of the amounts of fillers.
 |
| Fig. 12 WAXD patterns of neat OBC and its composites. The patterns are vertically shifted for clarity. | |
Not only the same crystal structure, we also observe that both CTAB-GO and GO blended composites show the similar crystallinity as judged from the area of the peaks. Thus the improvement of tensile properties should be attributed to the better dispersion and interaction between CTAB modified GO (CTAB-GO) and the OBC matrix.
4. Conclusions
In our work, OBC/CTAB-GO and OBC/GO nanocomposites were prepared through solution blending. A kind of quaternary ammonium salt CTAB was introduced as a modifier for GO, and the dispersion of GO sheets had been improved in OBC matrix, which led to an effective stress transfer and enhancement of tensile properties. With 1.0 wt% CTAB-GO incorporation, the increases of tensile strength, elongation at break and Young's modulus are 30%, 13% and 78%, respectively. Served as heterogeneous nucleating agents, the nucleation ability of CTAB-GO on crystallization of OBC is stronger than GO, resulting in a higher crystallization temperature and smaller crystallites, with no change in crystal form.
Acknowledgements
This work was supported by the National Natural Science Foundation of China (51421061 and 51210005).
Notes and references
- D. J. Arriola, E. M. Carnahan, P. D. Hustad, R. L. Kuhlman and T. T. Wenzel, Science, 2006, 312, 714–719 CrossRef CAS PubMed.
- P. S. Chum and K. W. Swogger, Prog. Polym. Sci., 2008, 33, 797–819 CrossRef CAS.
- A. Valente, A. Mortreux, M. Visseaux and P. Zinck, Chem. Rev., 2013, 113, 3836–3857 CrossRef CAS PubMed.
- R. L. Kuhlman and T. T. Wenzel, Macromolecules, 2008, 41, 4090–4094 CrossRef CAS.
- H. E. Park, J. M. Dealy, G. R. Marchand, J. Wang, S. Li and R. A. Register, Macromolecules, 2010, 43, 6789–6799 CrossRef CAS.
- H. Wang, D. Khariwala, W. Cheung, S. Chum, A. Hiltner and E. Baer, Macromolecules, 2007, 40, 2852–2862 CrossRef CAS.
- G. Liu, Y. Guan, T. Wen, X. Wang, X. Zhang, D. Wang, X. Li, J. Loos, H. Chen and K. Walton, Polymer, 2011, 52, 5221–5230 CrossRef CAS.
- T. Wen, G. Liu, Y. Zhou, X. Zhang, F. Wang, H. Chen, J. Loos and D. Wang, Macromolecules, 2012, 45, 5979–5985 CrossRef CAS.
- J. Jin, J. Du, H. Chen and C. C. Han, Polymer, 2011, 52, 6161–6172 CrossRef CAS.
- J. Jin, C. Zhao, J. Du and C. C. Han, Macromolecules, 2011, 44, 4326–4334 CrossRef CAS.
- P. Dias, Y. Lin, B. Poon, H. Chen, A. Hiltner and E. Baer, Polymer, 2008, 49, 2937–2946 CrossRef CAS.
- J. Jin, J. Du, Q. Xia, Y. Liang and C. C. Han, Macromolecules, 2010, 43, 10554–10559 CrossRef CAS.
- F. Zuo, C. Burger, X. Chen, Y. Mao, B. S. Hsiao, H. Chen, G. R. Marchand, S.-Y. Lai and D. Chiu, Macromolecules, 2010, 43, 1922–1929 CrossRef CAS.
- Y. Zhao, Y. Zhu, G. Sui, F. Chen, Q. Zhang and Q. Fu, RSC Adv., 2015, 5, 82535–82543 RSC.
- S. Li, R. A. Register, J. D. Weinhold and B. G. Landes, Macromolecules, 2012, 45, 5773–5781 CrossRef CAS.
- T. Wen, Y. Zhou, G. Liu, F. Wang, X. Zhang, D. Wang, H. Chen, K. Walton, G. Marchand and J. Loos, Polymer, 2012, 53, 529–535 CrossRef CAS.
- H. Wang, S. Chum, A. Hiltner and E. Baer, J. Appl. Polym. Sci., 2009, 113, 3236–3244 CrossRef CAS.
- H. Wang, S. Chum, A. Hiltner and E. Baer, J. Polym. Sci., Part B: Polym. Phys., 2009, 47, 1313–1330 CrossRef CAS.
- M. Wu, K. Wang, Q. Zhang and Q. Fu, RSC Adv., 2015, 5, 96353–96359 RSC.
- S. Fu, B. Yu, L. Duan, H. Bai, F. Chen, K. Wang, H. Deng, Q. Zhang and Q. Fu, Compos. Sci. Technol., 2015, 108, 23–31 CrossRef CAS.
- Z. Li, Y.-J. Shi, C.-X. Sun, Q. Zhang and Q. Fu, Compos. Sci. Technol., 2015, 115, 34–42 CrossRef CAS.
- Z. Li, C. Sun, X. Li, Q. Zhang and Q. Fu, RSC Adv., 2015, 5, 85442–85445 RSC.
- Z.-Z. Tong, B. Zhou, J. Huang, J.-T. Xu and Z.-Q. Fan, RSC Adv., 2014, 4, 15678–15688 RSC.
- Z.-Z. Tong, B. Zhou, J. Huang, J.-T. Xu and Z.-Q. Fan, Compos. Sci. Technol., 2013, 85, 111–117 CrossRef CAS.
- S. Wu, H. Li, G. Huang and J. Wu, RSC Adv., 2014, 4, 19024–19033 RSC.
- T. Li, J.-H. Pu, L.-F. Ma, R.-Y. Bao, G.-Q. Qi, W. Yang, B.-H. Xie and M.-B. Yang, Polym. Chem., 2015, 6, 7160–7170 RSC.
- X. Zhang, X. Yan, Q. He, H. Wei, J. Long, J. Guo, H. Gu, J. Yu, J. Liu and D. Ding, ACS Appl. Mater. Interfaces, 2015, 7, 6125–6138 CAS.
- Y. Li, J. Zhu, S. Wei, J. Ryu, Q. Wang, L. Sun and Z. Guo, Macromol. Chem. Phys., 2011, 212, 2429–2438 CrossRef CAS.
- Q. He, T. Yuan, X. Zhang, Z. Luo, N. Haldolaarachchige, L. Sun, D. P. Young, S. Wei and Z. Guo, Macromolecules, 2013, 46, 2357–2368 CrossRef CAS.
- H. Gu, C. Ma, J. Gu, J. Guo, X. Yan, J. Huang, Q. Zhang and Z. Guo, J. Mater. Chem. C, 2016 10.1039/C6TC01210H.
- K. S. Novoselov, A. K. Geim, S. Morozov, D. Jiang, Y. Zhang, S. a. Dubonos, I. Grigorieva and A. Firsov, Science, 2004, 306, 666–669 CrossRef CAS PubMed.
- S.-Y. Yang, K.-H. Chang, H.-W. Tien, Y.-F. Lee, S.-M. Li, Y.-S. Wang, J.-Y. Wang, C.-C. M. Ma and C.-C. Hu, J. Mater. Chem., 2011, 21, 2374–2380 RSC.
- D. A. Brownson and C. E. Banks, Analyst, 2010, 135, 2768–2778 RSC.
- Y. Sun, Q. Wu and G. Shi, Energy Environ. Sci., 2011, 4, 1113–1132 CAS.
- J. K. Lee, K. B. Smith, C. M. Hayner and H. H. Kung, Chem. Commun., 2010, 46, 2025–2027 RSC.
- Y. Zou and Y. Wang, Nanoscale, 2011, 3, 2615–2620 RSC.
- Y. Wang, Z. Li, J. Wang, J. Li and Y. Lin, Trends Biotechnol., 2011, 29, 205–212 CrossRef CAS PubMed.
- J. Zhu, M. Chen, Q. He, L. Shao, S. Wei and Z. Guo, RSC Adv., 2013, 3, 22790–22824 RSC.
- A. K. Geim and K. S. Novoselov, Nat. Mater., 2007, 6, 183–191 CrossRef CAS PubMed.
- A. K. Geim, Science, 2009, 324, 1530–1534 CrossRef CAS PubMed.
- T. Kuilla, S. Bhadra, D. Yao, N. H. Kim, S. Bose and J. H. Lee, Prog. Polym. Sci., 2010, 35, 1350–1375 CrossRef CAS.
- J. Gu, N. Li, L. Tian, Z. Lv and Q. Zhang, RSC Adv., 2015, 5, 36334–36339 RSC.
- J. Gu, X. Yang, Z. Lv, N. Li, C. Liang and Q. Zhang, Int. J. Heat Mass Transfer, 2016, 92, 15–22 CrossRef CAS.
- J. Gu, Z. Lv, X. Yang, G. e. Wang and Q. Zhang, Sci. Adv. Mater., 2016, 8, 972–979 CrossRef.
- H. Bai, Y. Xu, L. Zhao, C. Li and G. Shi, Chem. Commun., 2009, 1667–1669 RSC.
- V. Georgakilas, M. Otyepka, A. B. Bourlinos, V. Chandra, N. Kim, K. C. Kemp, P. Hobza, R. Zboril and K. S. Kim, Chem. Rev., 2012, 112, 6156–6214 CrossRef CAS PubMed.
- J. Liu, J. Tang and J. J. Gooding, J. Mater. Chem., 2012, 22, 12435–12452 RSC.
- J. Wang, J. Wu, W. Xu, Q. Zhang and Q. Fu, Compos. Sci. Technol., 2014, 91, 1–7 CrossRef CAS.
- X. Li, H. Deng, Z. Li, H. Xiu, X. Qi, Q. Zhang, K. Wang, F. Chen and Q. Fu, Composites, Part A, 2015, 68, 264–275 CrossRef CAS.
|
This journal is © The Royal Society of Chemistry 2016 |
Click here to see how this site uses Cookies. View our privacy policy here.