
 Open Access Article
 This Open Access Article is licensed under a
 Creative Commons Attribution 3.0 Unported Licence
Lighting up the gold nanoparticles quenched fluorescence by silver nanoparticles: a separation distance study†
Shuang
Li
ac,
Taishi
Zhang
ab,
Zhijun
Zhu
a,
Nengyue
Gao
a and
Qing-Hua
Xu
*ab
aDepartment of Chemistry, National University of Singapore, 3 Science Drive 3, Republic of Singapore 117543. E-mail: chmxqh@nus.edu.sg
bNUS Graduate School for Integrative Sciences and Engineering, National University of Singapore, Republic of Singapore 117456
cState Key Laboratory of Luminescent Materials and Devices, South China University of Technology, Guangzhou 510640, P. R. China
First published on 13th June 2016
Abstract
Contrast ratios of “turn-on” fluorescence probes determine the detection sensitivity of fluorescence-based assays and detections. Conventional fluorescence turn-on methods are generally based on recovery of quenched fluorescence to its initial intensity. Here we designed a nano-platform in which the fluorescence intensity of a pre-quenched fluorophore was enhanced up to the level significantly higher than the intensity of the unquenched fluorophores by utilization of plasmon coupling enhanced fluorescence. In this approach, the fluorescence of rhodamine B isothiocyanate (RiTC), which was pre-quenched by gold nanoparticles (Au NPs), was subsequently enhanced by silver nanoparticles (Ag NPs) upon formation of Ag@SiO2–Au–RiTC nanostructures. The thickness of SiO2 spacer shell can be adjusted to tune the gap size between Au NPs and Ag NPs to control the plasmon coupling strength to achieve the optimum fluorescence enhancement. Among the series of Ag@SiO2–Au–RiTC NPs with SiO2 shell thickness of 4, 10, 13, 20, 25, 36, 43 and 50 nm, the optimum florescence of the coupled nanostructure was found to occur at silica shell thickness of 13 nm with its fluorescence intensity 101 times that of the Au–RiTC NPs, 4.4 times that of free RiTC. In addition to plasmon enhanced excitation efficiency and quantum yields due to metal–chromophore interactions, huge local electric field amplification at the gap region induced by plasmon coupling between Au NP and Ag NPs contributes additionally to further enhance the excitation efficiency to achieve the observed fluorescence enhancement. This plasmon coupling enhanced fluorescence concept should offer a new design strategy to give rise to a “turn-on” fluorescence responses with improved signal-to-background ratios.
Introduction
Fluorescence-based assays and detections are important research tools for various applications such as chemical and biological sensing,1 live-cell imaging,2 rapid diagnosis,3 flow cytometry,4 and DNA sequencing,5 owing to its high sensitivity, simplicity, and low cost.6–8 The detection sensitivity of fluorescence based methods can be improved by increasing the contrast ratio by either increasing detectable fluorescence signal strength or reducing the non-specific background level using fluorescence quenchers. Gold nanoparticles (Au NPs) have been known as efficient fluorescence quenchers, 9–10 orders of magnitude more efficient than typical small molecule dye–quencher pairs.9 Lots of activatable probes have been designed to detect the analytes by using dye–Au NP pairs.10–12 However, the contrast ratios of most of dye–Au NP based assays rely on the difference between reduced background fluorescence quenched by Au NPs and recovered fluorescence to its initial intensity by forcing Au NP and dye molecules apart. Further improved signal-to-background ratio could be achieved if the reduced fluorescence could be enhanced to the level higher than that of initial fluorescence intensity, which could be realized by metal-enhanced fluorescence.Noble metal NPs, such as Au and Ag NPs, exhibit unique optical properties known as localized surface plasmon resonance (SPR).13–16 Interactions between metal NPs and fluorophores in close proximity could either quench17,18 or enhance19 the fluorescence of chromophores through the modification of its excitation efficiency and fluorescence quantum yield.20 This phenomenon has attracted intense attention in both fundamental studies and practical applications.21 Most studies on metal enhanced fluorescence are based on silver island films or silver nanoparticle overlayers on the glass substrates.22–25 Fluorescence enhancement of tens of folds was obtained in these studies.24,25 However, it is very difficult to achieve fluorescence enhancement by using metal NPs in the colloid solution.19,26,27 Plasmon coupling interactions between closely spaced metal NPs have been known to result in a significantly enhanced local electric field within the gap region,28,29 which is responsible for giant enhancement in surface enhanced Raman scattering (SERS).30 Plasmon coupling between adjacent metal NPs could also be utilized to increase the excitation efficiency and radiative decay rates, thereby enhancing the overall fluorescence of nearby chromophores.13,31 Smart design on coupled nanostructures is of great interest to achieve large fluorescence enhancement. Fluorescence enhancement in the coupled nanostructures has been investigated on substrate,32 ensemble solutions,33,34 and on single molecule level20,35,36 based on various assembly methods such as electrostatic interactions, molecular interactions, bond formation and lithography. Previous reports demonstrated 1340-fold enhancement in emission intensity of TPQDI in a bowtie nanoantenna structure,20 170-fold of Atto-665 in aggregated Ag NPs,37 470-fold of Atto-665 in a tip-to-tip Au nanorod dimer,38 2530-fold of an IR dye-labelled streptavidin in aggregated Ag NPs,39 and 7400-fold of IgG in plasmonic nanodot arrays.40
In this work, we designed a nano-platform (Scheme 1) in which the fluorescence intensity of a pre-quenched fluorophore was enhanced to the level of a few times higher than the original intensity of the unquenched fluorophores by utilization of plasmon coupling enhanced fluorescence. The fluorescence of a fluorophore rhodamine B isothiocyanate (RiTC) was pre-quenched by Au NPs upon formation of Au–RiTC NPs, which was subsequently enhanced by Ag@SiO2 NPs due to formation of Ag@SiO2–Au–RiTC composite nanostructures. The coupled nanostructures were prepared by conjugation of Au NPs and SiO2 coated Ag NPs via gold–sulfur interaction. The thickness of SiO2 spacer shell can be adjusted to tune the gap size between Au NPs and Ag NPs to investigate the effects of plasmon coupling strength on the fluorescence enhancement. The optimum florescence of the coupled nanostructure was found to occur at silica shell thickness of 13 nm with its fluorescence intensity 101 times that of dyes quenched by Au NPs, 4.4 times that of free dyes. This plasmon coupling enhanced fluorescence concept should offer a new design strategy to give rise to a “turn-on” fluorescence response with improved signal-to-background ratios.
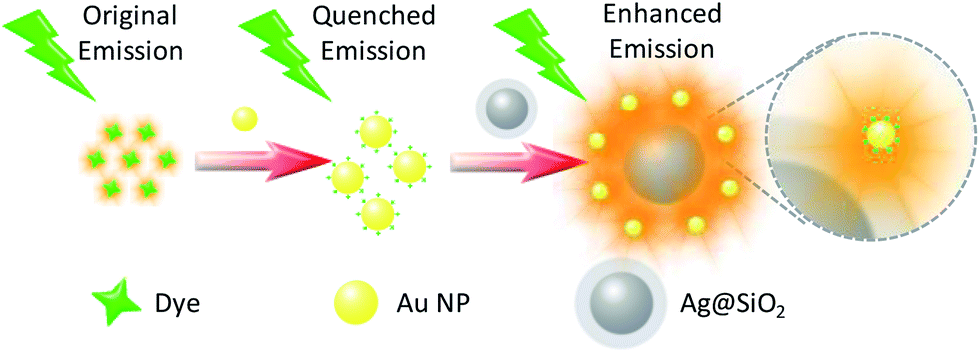 | ||
| Scheme 1 Schematic illustration of plasmon coupling induced fluorescence enhancement of the chromophore that is pre-quenched by Au NPs. | ||
Experimental
Materials and instrumentation
Silver nitrate (AgNO3), hydrogen tetrachloroaurate(III) trihydrate (HAuCl4·3H2O), tri-sodium citrate dehydrate, tetraethoxysilane (TEOS), sodium dodecyl sulfate (SDS), DL-dithiothreitol (DTT), sodium hydrate (NaOH), rhodamine B isothiocyanate (RiTC), polyvinylpyrrolidone (PVP, MW 40![[thin space (1/6-em)]](https://www.rsc.org/images/entities/char_2009.gif) 000), (3-mercaptopropyl)trimethoxysilane (MPTMS), (3-amino-propyl)trimethoxysilane (APTMS) were purchased from Sigma Aldrich. All solvents are analytical grade and used as received without further purification. All aqueous solutions are prepared in de-ionized water.
000), (3-mercaptopropyl)trimethoxysilane (MPTMS), (3-amino-propyl)trimethoxysilane (APTMS) were purchased from Sigma Aldrich. All solvents are analytical grade and used as received without further purification. All aqueous solutions are prepared in de-ionized water.
Absorption and fluorescence spectra were measured on a Hitachi UH5300 UV-vis spectrophotometer and a Horiba Jobin-Yvon FluoroMax-4 Spectrophotometer, respectively. Transmission electron microscopic (TEM) images were taken on a JEOL 2010 microscope operating at 200 kV. Fourier transform infrared (FTIR) measurements were performed by using an Excalibur 3100 FT-IR spectrometer (Varian, USA) in the transmission mode at room temperature.
Preparation of Au NPs and Au–RiTC NPs
13 nm Au NPs were prepared by using a modified Turkevich method.41 Briefly, an aqueous solution of HAuCl4 (50 mL, 1.0 mM) was first heated to boiling under stirring before addition of tri-sodium citrate (5.0 mL, 38.8 mM) in water. The mixture solution was further boiled for 15 min. The solution was slowly cooled to room temperature after the color changed from pale yellow to deep red, indicating formation of Au NPs. The obtained Au NPs had an average diameter of (13.0 ± 1.1) nm based on the TEM images. The concentration of as-prepared Au NPs colloid solution was determined by measuring their extinction at 520 nm (ε = 2.7 × 10⁸ L mol−1 cm−1).42Citrate stabilized Au NPs are extremely prone to aggregation due to weak interactions between citrate ions and Au NPs. SDS was therefore utilized to stabilize Au NPs. SDS solution (100 μL, 1 wt%) was added into 1.0 mL as-prepared Au NPs before centrifugation (13200 rpm, 15 min) to remove extra SDS and citrate. Different amounts of freshly prepared RiTC solution (100 μM, H2O) were added into the above dispersion and stirred at room temperature overnight. The Au–RiTC NPs dispersions were subsequently diluted to a total volume of 1.0 mL and kept in fridge at 4 °C for further use.
Preparation of Ag NPs and Ag@SiO2 NPs
Ag NPs were prepared by using the polyol process developed by Xia and co-workers.43 Briefly, ethylene glycol (5.0 mL) was heated in an oil bath to 160 °C before addition of AgNO3 solution (0.12 M, 3.0 mL) and PVP in ethylene glycol solution (0.18 M, 3.0 mL) simultaneously under vigorous stirring. The mixture was kept at 160 °C for 1 h under continuous stirring before cooling down to the room temperature. The obtained Ag NPs were purified by centrifugation (30 min, 9000 rpm) and then re-dispersed into ethanol. The Ag NPs were further purified by 3000 rpm centrifugation for 30 min to remove Ag NPs with smaller sizes and 20 min at 500 rpm to remove those with larger sizes. The mean size of the obtained Ag NPs is (81.3 ± 16.9) nm in diameter.Ag@SiO2 NPs were prepared by following a modified Stöber method.44 Ag NPs solution (1.0 mL, 0.5 nM in ethanol) was injected into the mixture of ethanol (19.0 mL), H2O (5.0 mL) and NaOH (250 μL, 0.1 M) under stirring. Different amounts of TEOS (1% in ethanol) were subsequently injected three times at a 30 min interval under continuous gentle stirring to initiate the formation of SiO2. The reactions proceeded at room temperature for 24 h. A silica layer formed on the surface of Ag NPs through hydrolysis and condensation of silane. The thickness of SiO2 layer was controlled by the amount of TEOS. The obtained Ag@SiO2 NPs were isolated by centrifugation at 8000 rpm for 3 min, washed with ethanol several times, and then re-dispersed in ethanol for further use.
Preparation of Ag@SiO2@Au–RiTC NPs
Ag@SiO2 NPs were first functionalized with sulfhydryl (–SH) groups using MPTMS following a previous report.45 Briefly, 30 μL of MPTMS was added into Ag@SiO2 (0.5 nM, 3.0 mL) in ethanol solution and kept for 45 min under stirring. The mixture solution was heated to 80 °C and then kept for 2 h under a nitrogen atmosphere. The Ag@SiO2 NPs were then washed three times with absolute ethanol and kept in fridge for further use. The functionalization with –SH was confirmed by FTIR.To couple Au–RiTC NPs and Ag@SiO2–SH NPs, mixtures of aliquots of Au–RiTC NPs (10 nM in term of Au NPs) in H2O with different amounts of Ag@SiO2–SH NPs (0.4 nM, H2O) were rotated (300 rpm) in the dark at room temperature overnight and diluted to a concentration of 0.5 nM (in terms of Au NPs) prior to use.
Preparation of Ag@SiO2–RiTC NPs
Ag@SiO2 NPs were first modified with –NH2 groups through hydrolysis and condensation of APTMS. Briefly, a solution of APTMS (100 μL, 25% v/v, chloroform) was added into Ag@SiO2 NPs (10 mL, 0.8 nM) in ethanol. The mixture reacted overnight under stirring at room temperature. The as-prepared Ag@SiO2–NH2 NPs were isolated by centrifugation, washed with ethanol several times, and then dispersed in ethanol prior to use. The successful surface functionalization can be verified by the change of zeta-potential of silica surface from negative to positive. Ag@SiO2–RiTC NPs were subsequently prepared by mixing RiTC solution (0.3 μM, H2O) with different amounts of Ag@SiO2–NH2 NPs in H2O. The mixture was kept rotating overnight before the measurements.Results and discussion
The strategy for plasmon coupling enhanced fluorescence of a pre-quenched fluorophore is shown in Scheme 1. Rhodamine B isothiocyanate (RiTC) was chosen as the model fluorophore because the absorption and fluorescence spectra of RiTC have reasonable overlap with the extinction spectrum of metal NPs (Fig. 2a) to ensure resonance interactions. RiTC is a water-soluble chromophore with strong affinity to Au.46 The fluorescence quantum yield of RiTC in methanol is ∼0.7.47 Plasmon enhanced fluorescence of rhodamine molecules have been previously reported in the silver nanoparticles overlayers.24,25 It is generally difficult to achieve plasmon enhanced fluorescence in the colloid solution. Here we utilize plasmon coupling induced additional excitation enhancement to achieve fluorescence enhancement by using coupled Ag@SiO2 NPs and Au–RiTC NPs. The extinction spectrum of Au–RiTC NPs is approximately a superposition of absorption spectrum of RiTC and extinction spectrum of Au NPs. The relative molar ratio between Au NPs and RiTC molecules has been optimized to ensure efficient quenching of the RiTC fluorescence (Fig. S1 and S2†). Au–RiTC NP with approximately ∼600 RiTC molecules in each nanoparticle was used in the subsequent studies, in which the fluorescence of Au–RITC NPs is about 23 times quenched compared to that of the same amount of free RiTC molecules in solution. The significantly quenched fluorescence of RiTC in Au–RiTC NPs is due to energy transfer from RiTC to the Au NP owing to good spectral overlap between absorption spectrum of Au NPs and emission spectrum of RiTC (Fig. 1).11,48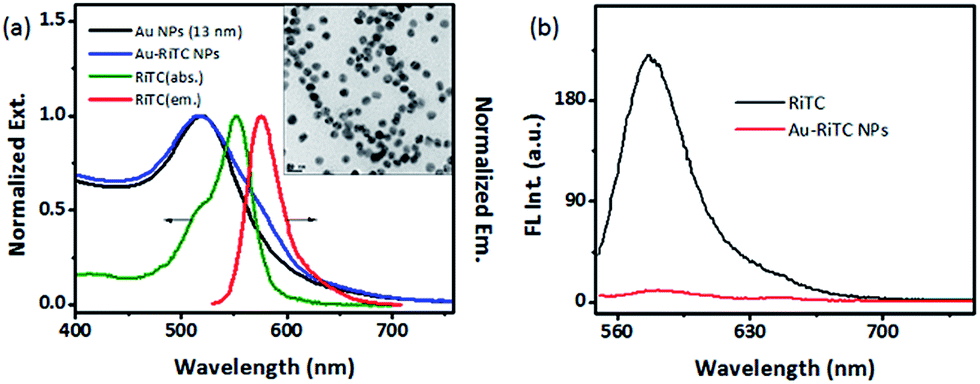 | ||
| Fig. 1 (a) Normalized extinction spectra of Au NPs (13 nm), RiTC, and Au–RiTC NPs in H2O; (b) fluorescence of RiTC (0.3 μM) with and without Au NPs (0.5 nM). The inset in (a) is TEM images of Au NPs (13 nm). | ||
SiO2 coated Ag NPs (Ag@SiO2 NPs) was utilized to light up the fluorescence of Au–RiTC NPs. Ag NPs generally display larger fluorescence enhancement effects than Au NPs.31 Larger sized metal NPs generally have higher scattering-to-absorption ratios, which are beneficial for metal enhanced fluorescence.49 Ag NPs with a diameter of 81 ± 17 nm are therefore prepared to act as the metal core. Thickness of SiO2 shell plays a critical role in the lighting-up effect. On the one hand, SiO2 shell will be utilized to optimize the separation distance between RiTC molecules and Ag NPs since metal enhanced fluorescence is strongly dependent on the metal–chromophore separation distance. On the other hand, plasmon coupling interactions between Au NP and Ag NP also strongly depend on their separation distance. The overall fluorescence intensity of the coupled nanostructures can be optimized by adjusting the thickness of SiO2 shell. Upon coating with SiO2 shell, the SPR band of Ag NPs in H2O displayed a gradual redshift owing to higher refractive index of silica than that of aqueous media.50 The redshift increased to ca. 20 nm when the silica shell thickness increased to 50 nm (Fig. S3†). TEM images (Fig. 2 & S4†) confirm the formation of Ag@SiO2 NPs with uniform SiO2 shells. Ag@SiO2 NPs was further surface-modified with thiol groups by condensation of siloxane with MPTMS. Successful attachment of thiol groups onto the Ag@SiO2 NPs were verified by the FTIR analysis (see Fig. S5†).
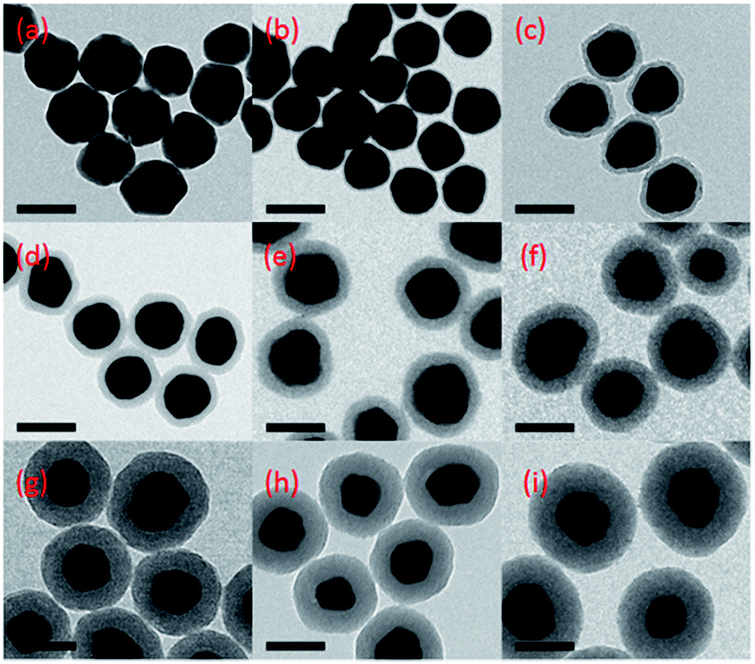 | ||
| Fig. 2 TEM images of Ag NPs (a) and Ag@SiO2 NPs with silica shell thickness of 4 nm (b), 10 nm (c), 13 nm (d), 20 nm (e), 25 nm (f), 36 nm (g), 43 nm (h) and 50 nm (i). Scale bars in all images are 100 nm. | ||
Ag@SiO2–Au–RiTC NPs were formed by attaching Ag@SiO2 NPs and Au–RiTC NPs via the gold–sulfur interactions. Comparison of the extinction spectrum of Ag@SiO2–Au–RiTC NPs (blue lines) and the superposition of the extinction spectra of its individual components (Ag@SiO2 NPs + Au–RiTC NPs) showed decreased extinction in the short wavelength region and simultaneously increased extinction at the longer wavelength region (Fig. 3), which is a signature of plasmon coupling between Au–RiTC NPs and Ag@SiO2 NPs. Formation of Ag@SiO2–Au–RiTC NPs can be directly visualized by their TEM images (Fig. 3 inset). As plasmon coupled noble metal nanoparticles generally give strong two-photon photoluminescence,48,51,52 plasmon coupling interactions between the Ag NP core and surrounding Au NPs within each Ag@SiO2–Au–RiTC NPs were further confirmed by significantly increased two-photon photoluminescence of Ag@SiO2–Au–RiTC NPs upon the attaching Au–RiTC NPs to the surface of Ag@SiO2 NPs (Fig. S6†).
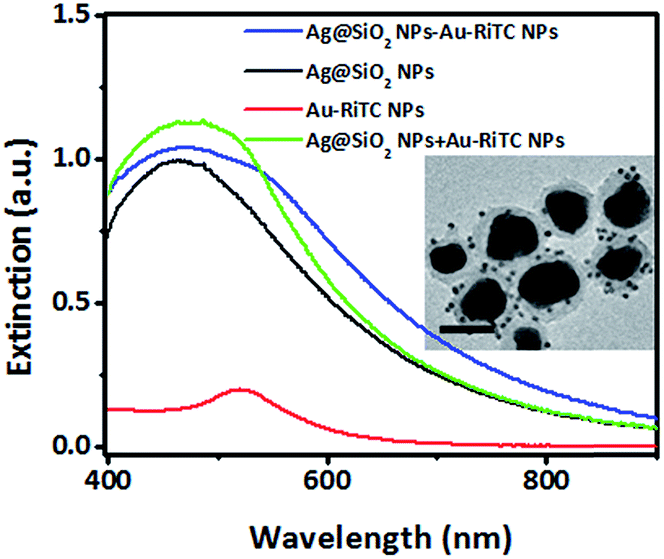 | ||
| Fig. 3 Extinction spectra of Ag@SiO2 NPs, Au–RiTC NPs, Ag@SiO2–Au–RiTC NPs (coupled), Ag@SiO2 NPs + Au–RiTC NPs (non-coupled). The SiO2 thickness is 13 nm. Inset is the TEM image of Ag@SiO2–Au–RiTC NPs. | ||
The results of lighting up of the quenched fluorescence of Au–RiTC NPs by Ag@SiO2 NPs are shown in Fig. 4. Fig. 4a shows the change in fluorescence spectra of Au–RiTC NPs upon gradual addition of Ag@SiO2 NPs with SiO2 shell thickness of 13 nm. Upon gradual addition of Ag@SiO2 NPs, the fluorescence intensity of Au–RiTC NPs under excitation at 530 nm steadily increased until reaching a plateau (Fig. 4a inset). Upon formation of Ag@SiO2–Au–RiTC NPs, the fluorescence of Au–RiTC NPs was found to be enhanced by up to 101-fold, which is 4.4 times enhanced compared to that of the same amount of free RiTC molecules. The possible contribution of the observed fluorescence recovery/enhancement due to release of RiTC molecule into the solution during the experiments can be excluded by various control experiments (Fig. S7†). The fact that fluorescence intensity of Ag@SiO2–Au–RiTC NPs is a few times larger than that of free RiTC molecules confirms the vital role of plasmon coupling in the observed fluorescence enhancement, since fluorescence intensity increase due to release of RiTC cannot go beyond that of free RiTC molecules. Fluorescence lifetime measurements (Fig. S8†) have been performed to understand the origin of the observed fluorescence enhancement. The fluorescence lifetime of free RiTC molecules in H2O was measured to be ∼1.5 ns. Upon binding to Au NPs, the fluorescence lifetime of Au–RiTC NPs was shorter than the instrument response function of ∼100 ps and cannot be accurately determined. After attaching Au–RiTC NPs to the surface of Ag@SiO2 NPs, the fluorescence lifetime of Ag@SiO2–Au–RiTC NPs with thickness of 13 nm remained shorter than the instrument response function (∼100 ps) instead of increasing back to 1.5 ns. The observation of significantly enhanced fluorescence intensity and short fluorescence lifetime at the same time further confirm that the observed fluorescence increase is due to the plasmonic interactions between Au–RiTC NPs and Ag@SiO2 NPs rather than release of RiTC molecules.
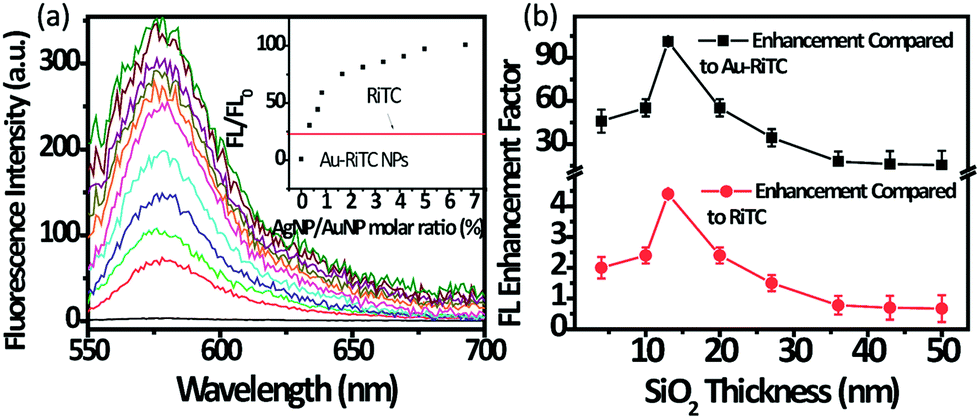 | ||
| Fig. 4 (a) Fluorescence spectra and intensities of Au–RiTC NPs upon gradual addition of Ag@SiO2 with SiO2 thickness of 13 nm. The red line in the inset is the intensity level of free RiTC; (b) fluorescence enhancement factors of Ag@SiO2–Au–RiTC NPs with different SiO2 shell thicknesses compared to Au–RiTC NPs and free RiTC molecules. | ||
Ag@SiO2–Au–RiTC NPs with a series of shell thicknesses (4, 10, 13, 20, 25, 36, 43 and 50 nm) have been prepared to optimize the fluorescence enhancement and investigate the underlying enhancement mechanisms. The extent of optimum fluorescence enhancement was found to strongly depend on the thickness of SiO2 shell (Fig. 4b and S9†), which controls the separation distance between Au–RiTC NPs and Ag NP core. Among a few shell thickness studied in our work, the optimum fluorescence enhancement for the Ag@SiO2–Au–RiTC NPs was observed at the SiO2 shell thickness of 13 nm. Less fluorescence enhancement was found for shell thickness either less or larger than 13 nm.
Fluorescence intensity of chromophores is proportional to the product of excitation efficiency and fluorescence quantum yield, both of which will be modulated by metal–chromophore interactions.13,21,53–56 In general, three types of metal–chromophore interactions will modulate the fluorescence intensities when a chromophore is in close proximity of a metal nanoparticle. First, local electric field amplification on the surface of metal nanoparticles will result in enhanced excitation efficiency if the excitation wavelength is resonant with the plasmon resonance. Second, the radiative decay rate of the chromophore will increase under the influence of plasmon resonance of metal nanoparticles. Third, non-radiative energy transfer will occur from the chromophore to the metal nanoparticle, which will introduce an additional non-radiative deactivation channel and result in a decreased fluorescence quantum yield of the chromophore. The fluorescence quantum yield is determined by the competition of the change in radiative and non-radiative decay rates. All three factors depend on the separation distance between the metal and chromophore. As the separation distance decreases, local electric field amplification increases monotonically, which contributes to an improved excitation efficiency. However, the competition of increased radiative and increased non-radiate decay rates will cause a complicated change in the fluorescence quantum yield. When a chromophore with a moderate quantum yield approaches a metal NP, the increase in the radiative decay rate plays a dominant role and its fluorescence quantum yield and intensity will generally increases first as the separation distance decreases until reaching an optimum separation distance. When the metal–chromophore separation distance further decreases, the increase in the nonradiative energy transfer rate will play a dominant role and result in a decreased fluorescence quantum yield that may not be compensated by increased excitation efficiency (if any), then overall fluorescence intensity will decreases when the separation distance is too short.19,50,57
The above trend was generally observed for a simple metal–spacer–chromophore core–shell structure. The current system of Ag@SiO2–Au–RiTC NPs is a little bit more complicated. Here RiTC is pre-quenched by the Au NPs in Au–RiTC NPs. Au–RiTC NP could be simply considered as a nano-chromophore entity with a much lower quantum yield compared to free RiTC molecules themselves. Their excitation efficiency and quantum yield will be modulated when they are attached to the surface of Ag@SiO2 NPs. Generally, a chromophore with a lower fluorescence quantum yield will experience larger enhancement in its fluorescence quantum yield.20 The fluorescence quantum yield of Au–RiTC NPs is then expected to experience a larger enhancement by Ag@SiO2 NPs. Furthermore, plasmon coupling will occur between the SPR bands of Au NPs and Ag NPs when Au–RiTC NPs were attached to the surface of Ag@SiO2. Plasmon coupling between metal nanoparticles have been known to create giant electric field amplification in the gap region, which has been previously known to result in giant enhancement in SERS.30 RiTC molecules at the gap region of the Ag@SiO2–Au–RiTC NPs will experience a larger local electric field amplification (Fig. S10†), which provides extra enhancement in its excitation efficiency. The extra contribution due to plasmon coupling will cause extra fluorescence enhancement at shorter separation distances. To clarify plasmon coupling effects on the observed fluorescence enhancement, Ag@SiO2–RiTC NPs with different SiO2 shell thickness were prepared as the control experiments (Fig. S11†). The overall fluorescence of Ag@SiO2–RiTC NPs was found quenched compared to free RiTC molecules. It has been previously reported that fluorescence of rhodamine molecules can be enhanced by Ag NP overlayers on the substrate.24,25 Here the fluorescence quenching was observed in the colloid solution probably due to unfavorable spectral overlap between the SPR band of non-aggregated Ag NPs and RiTC as well as different sizes and aggregation states of Ag NPs, which are crucial to achieve fluorescence enhancement.24 Despite these differences, the relative fluorescence intensities of Ag@SiO2–RiTC NPs and Ag@SiO2–Au–RiTC NPs displayed a similar trend: the fluorescence intensities increased first and then decreased as the SiO2 shell thickness decreased. The optimum fluorescence of Ag@SiO2–RiTC NPs was observed at a silica shell thickness of 20 nm, which is larger than that for Ag@SiO2–Au–RiTC NPs (13 nm). A thinner SiO2 thickness, i.e. smaller separation distance between Au NP and Ag NP, will result in stronger plasmon coupling between Au NP and Ag NP, and consequently larger local electric field amplification and further enhancement in the excitation efficiency. The optimum fluorescence of Ag@SiO2–Au–RiTC NPs is expected to occur at shorter separation distance compared to that of Ag@SiO2–RiTC, which is consistent with our experimental results. Furthermore, plasmon coupling in the Ag@SiO2–Au–RiTC NPs structures is expected to exhibit stronger local electric field,38,52 and a larger excitation enhancement than that of Ag@SiO2–RiTC NPs. Consequently, larger fluorescence enhancements were observed for Ag@SiO2–Au–RiTC NPs than that for Ag@SiO2–RiTC NPs for the same shell thickness. The optimum florescence intensity of Ag@SiO2–Au–RiTC NPs was 101 times that of Au–RiTC NPs, 4.4 times that of free RiTC.
Conclusions
In summary, we have designed a coupled plasmonic nanostructure, Ag@SiO2–Au–RiTC NPs, in which fluorescence of RiTC molecules that were pre-quenched by Au NPs were recovered or even enhanced through interactions with Ag@SiO2 NPs. Ag@SiO2–Au–RiTC NPs with a series of SiO2 shell thicknesses (4, 10, 13, 20, 25, 36, 43 and 50 nm) have been prepared to optimize the fluorescence enhancement and investigate the enhancement mechanisms. As SiO2 shell thickness decreased, the fluorescence enhancement factor was found to increase first and then decrease for nanoparticles with very thinner SiO2 shell. The optimum fluorescence enhancement was found at SiO2 shell thickness of 13 nm, at which the fluorescence intensity of Ag@SiO2–Au–RiTC NPs was 101 times that of Au–RiTC NPs and 4.4 times that of free RiTC. The enhancement factors are much larger than that of the simple Ag@SiO2–RiTC core–shell nanoparticle system with the same SiO2 shell thickness. The difference can be ascribed to extra enhancement in its excitation efficiency due to the plasmon coupling between Au NP and Ag NP within each Ag@SiO2–Au–RiTC NP. Detection sensitivity of conventional fluorescence turn-on probes mostly relies on the contrast ratio between initial and quenched fluorescence intensity. The current strategy demonstrated a transition from strong fluorescence quenching to fluorescence enhancement, which could be utilized for development of fluorescence turn-on based detection platforms with enhanced contrast ratio and sensitivity.Acknowledgements
This work is supported by the Ministry of Education, Singapore (Tier 1, R-143-000-607-112), the National Research Foundation, Prime Minister's Office, Singapore under its Competitive Research Program (CRP Award No. NRF-CRP10-2012-04), and the Guangdong Innovative Research Team Program of China (201101C0105067115).Notes and references
- L. Chen, D. W. McBranch, H.-L. Wang, R. Helgeson, F. Wudl and D. G. Whitten, Proc. Natl. Acad. Sci. U. S. A., 1999, 96, 12287–12292 CrossRef CAS.
- M. Fernandez-Suarez and A. Y. Ting, Nat. Rev. Mol. Cell Biol., 2008, 9, 929–943 CrossRef CAS PubMed.
- R. Jackson, R. P. Oda, R. K. Bhandari, S. B. Mahon, M. Brenner, G. A. Rockwood and B. A. Logue, Anal. Chem., 2014, 86, 1845–1852 CrossRef CAS PubMed.
- P. K. Chattopadhyay, D. A. Price, T. F. Harper, M. R. Betts, J. Yu, E. Gostick, S. P. Perfetto, P. Goepfert, R. A. Koup, S. C. De Rosa, M. P. Bruchez and M. Roederer, Nat. Med., 2006, 12, 972–977 CrossRef CAS PubMed.
- P. K. Chattopadhyay, T. M. Gierahn, M. Roederer and J. C. Love, Nat. Immunol., 2014, 15, 128–135 CrossRef CAS PubMed.
- D. Agard, Y. Hiraoka, P. Shaw and J. W. Sedat, Methods Cell Biol., 1989, 30, 353–377 CrossRef CAS PubMed.
- M. G. L. Gustafsson and W. W. Webb, Proc. Natl. Acad. Sci. U. S. A., 2005, 102, 13081–13086 CrossRef CAS PubMed.
- M. Gu, C. J. R. Sheppard and X. Gan, J. Opt. Soc. Am. A, 1991, 8, 1755–1761 CrossRef.
- C. Fan, S. Wang, J. W. Hong, G. C. Bazan, K. W. Plaxco and A. J. Heeger, Proc. Natl. Acad. Sci. U. S. A., 2003, 100, 6297–6301 CrossRef CAS PubMed.
- M. Swierczewska, S. Lee and X. Chen, Phys. Chem. Chem. Phys., 2011, 13, 9929–9941 RSC.
- D. Liu, S. Wang, M. Swierczewska, X. Huang, A. A. Bhirde, J. Sun, Z. Wang, M. Yang, X. Jiang and X. Chen, ACS Nano, 2012, 6, 10999–11008 CAS.
- D. Liu, X. Huang, Z. Wang, A. Jin, X. Sun, L. Zhu, F. Wang, Y. Ma, G. Niu, A. R. Hight Walker and X. Chen, ACS Nano, 2013, 7, 5568–5576 CrossRef CAS PubMed.
- V. Giannini, A. I. Fernández-Domínguez, S. C. Heck and S. A. Maier, Chem. Rev., 2011, 111, 3888–3912 CrossRef CAS PubMed.
- H. Ehrenreich and H. R. Philipp, Phys. Rev., 1962, 128, 1622–1629 CrossRef CAS.
- K. L. Kelly, E. Coronado, L. L. Zhao and G. C. Schatz, J. Phys. Chem. B, 2003, 107, 668–677 CrossRef CAS.
- S. Link and M. A. El-Sayed, J. Phys. Chem. B, 1999, 103, 8410–8426 CrossRef CAS.
- P. Reineck, D. Gómez, S. H. Ng, M. Karg, T. Bell, P. Mulvaney and U. Bach, ACS Nano, 2013, 7, 6636–6648 CrossRef CAS PubMed.
- E. Dulkeith, A. C. Morteani, T. Niedereichholz, T. A. Klar, J. Feldmann, S. A. Levi, F. C. J. M. van Veggel, D. N. Reinhoudt, M. Möller and D. I. Gittins, Phys. Rev. Lett., 2002, 89, 203002 CrossRef CAS PubMed.
- D. Cheng and Q.-H. Xu, Chem. Commun., 2007, 248–250 RSC.
- A. Kinkhabwala, Z. Yu, S. Fan, Y. Avlasevich, K. Muellen and W. E. Moerner, Nat. Photonics, 2009, 3, 654–657 CrossRef CAS.
- C. Geddes and J. Lakowicz, J. Fluoresc., 2002, 12, 121–129 CrossRef.
- K. Ray, R. Badugu and J. R. Lakowicz, J. Am. Chem. Soc., 2006, 128, 8998–8999 CrossRef CAS PubMed.
- B. B. Blizanac, P. N. Ross and N. M. Marković, J. Phys. Chem. B, 2006, 110, 4735–4741 CrossRef CAS PubMed.
- A. Suslov, P. T. Lama and R. Dorsinville, Opt. Commun., 2015, 345, 116–119 CrossRef CAS.
- S. Pan, Z. Wang and L. J. Rothberg, J. Phys. Chem. B, 2006, 110, 17383–17387 CrossRef CAS PubMed.
- K. Aslan, J. R. Lakowicz, H. Szmacinski and C. D. Geddes, J. Fluoresc., 2004, 14, 677–679 CrossRef CAS.
- O. G. Tovmachenko, C. Graf, D. J. van den Heuvel, A. van Blaaderen and H. C. Gerritsen, Adv. Mater., 2006, 18, 91–95 CrossRef CAS.
- L. Polavarapu, J. Perez-Juste, Q.-H. Xu and L. M. Liz-Marzan, J. Mater. Chem. C, 2014, 2, 7460–7476 RSC.
- S. Nie and S. R. Emory, Science, 1997, 275, 1102–1106 CrossRef CAS PubMed.
- J. H. Lee, M. H. You, G. H. Kim and J. M. Nam, Nano Lett., 2014, 14, 6217–6225 CrossRef CAS PubMed.
- M. Rycenga, C. M. Cobley, J. Zeng, W. Li, C. H. Moran, Q. Zhang, D. Qin and Y. Xia, Chem. Rev., 2011, 111, 3669–3712 CrossRef CAS PubMed.
- L. Zhou, F. Ding, H. Chen, W. Ding, W. Zhang and S. Y. Chou, Anal. Chem., 2012, 84, 4489–4495 CrossRef CAS PubMed.
- I. O. Osorio-Roman, A. R. Guerrero, P. Albella and R. F. Aroca, Anal. Chem., 2014, 86, 10246–10251 CrossRef CAS PubMed.
- M. D. Furtaw, D. L. Steffens, T. M. Urlacher and J. P. Anderson, Anal. Chem., 2013, 85, 7102–7108 CrossRef CAS PubMed.
- M. P. Busson, B. Rolly, B. Stout, N. Bonod and S. Bidault, Nat. Commun., 2012, 3, 962 CrossRef PubMed.
- J. Zhang, Y. Fu, M. H. Chowdhury and J. R. Lakowicz, Nano Lett., 2007, 7, 2101–2107 CrossRef CAS PubMed.
- R. Gill, L. Tian, W. R. C. Somerville, E. C. Le Ru, H. van Amerongen and V. Subramaniam, J. Phys. Chem. C, 2012, 116, 16687–16693 CAS.
- T. Zhang, N. Gao, S. Li, M. J. Lang and Q.-H. Xu, J. Phys. Chem. Lett., 2015, 6, 2043–2049 CrossRef CAS PubMed.
- M. Furtaw, J. Anderson, L. Middendorf and G. Bashford, Plasmonics, 2014, 9, 27–34 CrossRef CAS.
- L. Zhou, F. Ding, H. Chen, W. Ding, W. Zhang and S. Y. Chou, Anal. Chem., 2012, 84, 4489–4495 CrossRef CAS PubMed.
- G. Frens, Nature (London), Phys. Sci., 1973, 241, 20–22 CrossRef CAS.
- D. S. Seferos, D. A. Giljohann, H. D. Hill, A. E. Prigodich and C. A. Mirkin, J. Am. Chem. Soc., 2007, 129, 15477–15479 CrossRef CAS PubMed.
- B. Wiley, Y. Sun, B. Mayers and Y. Xia, Chem.–Eur. J., 2005, 11, 454–463 CrossRef CAS PubMed.
- J. F. Hund, M. F. Bertino, G. H. Zhang, C. Sotiriou-Leventis, N. Leventis, A. T. Tokuhiro and J. Farmer, J. Phys. Chem. B, 2003, 107, 465–469 CrossRef CAS.
- E. M. Claesson and A. P. Philipse, Langmuir, 2005, 21, 9412–9419 CrossRef CAS PubMed.
- X. Qian, S. R. Emory and S. Nie, J. Am. Chem. Soc., 2012, 134, 2000–2003 CrossRef CAS PubMed.
- R. F. Chen, Arch. Biochem. Biophys., 1969, 133, 263–276 CrossRef CAS PubMed.
- Z. Guan, L. Polavarapu and Q.-H. Xu, Langmuir, 2010, 26, 18020–18023 CrossRef CAS PubMed.
- T. Ming, H. Chen, R. Jiang, Q. Li and J. Wang, J. Phys. Chem. Lett., 2012, 3, 191–202 CrossRef CAS.
- T. T. Zhao, K. Yu, L. Li, T. S. Zhang, Z. P. Guan, N. Y. Gao, P. Y. Yuan, S. Li, S. Q. Yao, Q.-H. Xu and G. Q. Xu, ACS Appl. Mater. Interfaces, 2014, 6, 2700–2708 CAS.
- X.-F. Jiang, Y. Pan, C. Jiang, T. Zhao, P. Yuan, T. Venkatesan and Q.-H. Xu, J. Phys. Chem. Lett., 2013, 4, 1634–1638 CrossRef CAS PubMed.
- Z. Guan, N. Gao, X. F. Jiang, P. Yuan, F. Han and Q.-H. Xu, J. Am. Chem. Soc., 2013, 135, 7272–7277 CrossRef CAS PubMed.
- J. R. Lakowicz, Anal. Biochem., 2005, 337, 171–194 CrossRef CAS PubMed.
- W. L. Barnes, J. Mod. Opt., 1998, 45, 661–699 CrossRef CAS.
- T. V. Shahbazyan, Nano Lett., 2013, 13, 194–198 CrossRef CAS PubMed.
- R. F. Aroca, Phys. Chem. Chem. Phys., 2013, 15, 5355–5363 RSC.
- P. Yuan, Y. H. Lee, M. K. Gnanasammandhan, Z. Guan, Y. Zhang and Q.-H. Xu, Nanoscale, 2012, 4, 5132–5137 RSC.
Footnote |
| † Electronic supplementary information (ESI) available: Two-photon photo-luminescence and extinction spectra of Au NPs and Au–RiTC NPs; optimization of molar ratio of Au NP to RiTC; TEM images and normalized extinction spectra of Ag@SiO2 NPs with various silica shell thicknesses; FTIR spectra of Ag@SiO2 before and after MPTMS condensation; emission spectra and two-photon luminescence of coupled nanostructures; DTT treatment of Ag@SiO2–Au–RiTC NPs dispersion; fluorescence lifetime measurement; simulation results; fluorescence enhancement in Ag@SiO2–RiTC NPs. See DOI: 10.1039/c6ra11265j |
| This journal is © The Royal Society of Chemistry 2016 |