
Probing high temperature ferromagnetism and its paramagnetic phase change due to Eu3+ incorporation in ZnO nanophosphors
K. Jayanthi Rajan*a,
Kausalya Ganesana,
Satyanaryana Lankaa,
Swati Bishnoib and
Manorama V. Sunkara*a
aNanomaterials Laboratory, Inorganic and Physical Chemistry Division, CSIR-Indian Institute of Chemical Technology, Hyderabad-500007, India. E-mail: k.jayanthirajan@gmail.com; manorama@iict.res.in
bLuminescent Materials and Devices Group, CSIR-National Physical Laboratory, New Delhi-110012, India
First published on 3rd August 2016
Abstract
Ferromagnetic oxide semiconductors exhibiting efficient luminescent properties together with robust ferromagnetism above room temperature form an exclusive class of spintronic materials endowed with both charge and spin degrees of freedom. Herein, we report on the occurrence of high temperature ferromagnetism (>600 K) in zinc oxide nanophosphors attributed to the presence of defects in the host lattice and wherein incorporation of rare earth ions contributed to a gradual reduction in the ferromagnetic character and steady transformation to paramagnetic behavior. Although undoped ZnO nanophosphors exhibit a high coercive field and saturation magnetization along with a prominent green emission (536 nm) attributed to the presence of oxygen vacancies Vo, Eu3+ doping results in a decrease in green emission along with coercivity as well as magnetization efficient line emission in the orange red region (618–622 nm) pointing to a definite correlation between the Vo and ferromagnetism. The temperature dependence of the magnetization shows stable ferromagnetism with Curie temperature above 600 K for undoped ZnO and a ferromagnetic to paramagnetic transition with an increase in Eu3+ concentration that has been explained through an F+ center exchange mechanism.
1. Introduction
Among the several semiconducting oxide materials, zinc oxide (ZnO) has gained widespread popularity due to its demonstrated applications in several areas including optoelectronics, such as solid state light emitting devices (LEDs), gas sensors, piezoelectric transducers, optical waveguides, ultra violet (UV) laser emitters, solar cells, etc.1–3 ZnO is a wide bandgap semiconductor with an Eg around 3.37 eV and the photoluminescence spectrum of ZnO exhibits a near-band-edge UV emission and a broad defect-related visible emission, prominently in the green region due to the presence of oxygen defects. It is anticipated that the luminescence properties of ZnO nanophosphors (NPs) could be tailored by doping with different luminescent centers. In addition, ZnO is known to exhibit a magnetic behavior showing ferromagnetism (FM) at room temperature (RT) that is stable even above 600 °C.In the present work the ZnO NPs were doped with increasing amounts of Eu3+ from 0.01 to 0.25 M% with the aim of obtaining red emission. It was observed that along with the sharp red emission line intensity, the RTFM that existed in undoped ZnO NPs decreased in terms of coercivity and saturation magnetization with increasing Eu3+ concentration. Further at a particular Eu3+ concentration in the ZnO NPs a definite ferromagnetic to paramagnetic transition is observed. The present studies are aimed at understanding this variation in the magnetic properties of ZnO NPs with Eu3+ incorporation along with the red emission and establish a correlation between these two phenomena, if it exists.
Thus far, diverse magnetic properties have been reported in ZnO based dilute magnetic semiconductors (DMS)4–7 and in particular for the case of RTFM there are several theoretical models that have been predicted to explain the coupling responsible.8–10 However, the origin of such a FM has yet to be uncovered, and the mechanism behind the magnetic ordering is still under debate. In a few cases it has been demonstrated that the magnetism was due to segregation of metallic clusters11 while in others that include transition elements with variable valence states (Mn3+ and Mn4+), it was attributed to the double exchange phenomenon.12,13 The main challenge in these materials that holds promise in a technological perspective is to retain the magnetic character above RT, that is, Curie temperature (TC) above 300 K, and overcome the primary limitation that is associated with the non homogeneity in the solubility of magnetic ions in the semiconductor lattice. Some recent reports on this topic suggest that the magnetic properties are not exclusively related to the presence of the magnetic ions but are strongly determined by the defects.9,14–17 In recent times studies on nonmagnetic doped18,19 and undoped ZnO20–23 systems indicate that the magnetic properties may not be solely related to the presence of the magnetic ions but are strongly mediated by the point defects, such as oxygen vacancies (Vo),20 Zn vacancies (VZn)24 and Zn interstitials (Zni).22 Due to the complexity of defect states in ZnO like systems it is still a challenge to establish a definite correlation between the magnetization and the defects.
To date, there are some reports on the magnetic properties of rare earth elements such as gadolinium, terbium and erbium correlated to defects and dopant ions.25,26 The present paper is an attempt to identify the role of yet another rare earth ion Eu3+ and the defects present in the ZnO lattice which could be responsible for the observed luminescence and ferromagnetism, the mechanism responsible for the paramagnetic phase change at different Eu3+ concentration, and to establish a correlation between them.
2. Experimental details
ZnO NPs doped with Eu3+ (0.01–0.25 M%) are synthesized via a solid combustion technique (SCT) using zinc acetate as host precursor, europium(III) acetate hexahydrate as activator and urea as fuel. A schematic of the SCT synthesis process is presented in Fig. 1. A beaker containing host and activator precursors and fuel prepared at RT is placed in a preheated furnace at 450 °C for 10–15 min. Care was taken to avoid any metallic tools during the synthesis to preclude any inadvertent contamination. A fluffy mass filled the beaker as shown, that was crushed to powder and fired at 400 °C for 2 h. To identify the optimum phase formation temperature, the material was subjected to increasing synthesis temperatures (200, 400 and 600 °C) and the crystallinity and phase monitored by X-ray diffraction (XRD).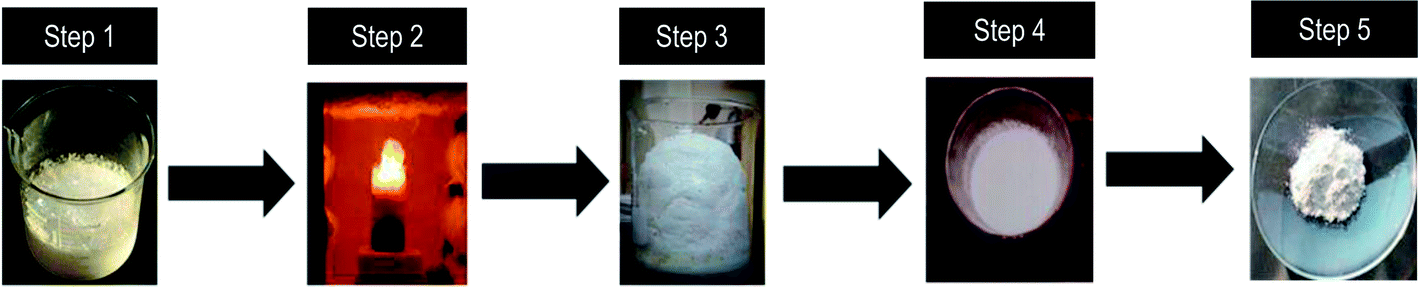 | ||
| Fig. 1 Shown are the steps for the synthesis of ZnO:Eu3+ NPs. Step 1: the mixture of host, activator and fuel (zinc acetate dihydrate + europium III acetate hydrate + urea) at RT; step 2: auto combustion on a preheated furnace at the temperature of 450 °C for 2 h; step 3: fluff formation of combusted sample; step 4: calcination at the temperature of 400 °C for 2 h; step 5: the final product formation. | ||
3. Characterization
Photoluminescence (PL) spectra of undoped and Eu3+ powder samples were recorded using an Edinburgh Instruments FLSP920 steady state spectrometer with a xenon lamp source. Magnetization versus magnetic field (M–H) was measured using Micro-sense vibrating sample magnetometer EV9 (VSM) using an electromagnet as a magnetic field source, argon gas during increasing temperature and nitrogen gas during cooling. The VSM instrument has a capability of scanning temperature in the range of 77 K to 600 K and a RMS sensitivity of 10−6 emu g−1. The VSM is equipped with a Crest Performance CPX 900 Power amplifier, a Stanford Research Systems Model SR830 DSP Lock-in-Amplifier and a Model 32KP Gaussmeter. A quartz rod wrapped with aluminium foil was used as the sample holder to prevent any magnetic contamination. The surface magnetic domain pattern of the NPs was performed at RT using magnetic force microscopy (MFM) module in a scanning probe microscope from NT-MDT (Model-Aura, Russia) in semi-contact mode. Silicon cantilevers (NSG-01/Co from NT-MDT) coated with cobalt/chromium film having coating thickness 30–40 nm, tip radius ∼40 nm and resonance frequency 222 kHz were used. The electron paramagnetic resonance (EPR) spectra were acquired on a JEOL (JES-FA 200) X-band spectrometer operating at 9.45 GHz (microwave frequency) and 100 kHz (modulation frequency) at RT.Crystallographic phase identification was accomplished by powder X-ray diffraction on a PANalytical (Empyrean) Advance diffractometer and data were analyzed using the Rietveld refinement program. The morphological evaluation of the ZnO:Eu3+ NPs were studied on a field emission scanning electron microscope (FESEM) (JEOL JSM-7610F) and the composition and elemental mapping was established by energy dispersive spectroscopy (EDS) attached to the FESEM instrument to see the effect of doping on the morphology as well as to reveal the presence of magnetic impurity if any. The X-ray photo electron spectroscopy (XPS) data was obtained using SPECS XPS system (M/s. SPECS Surface Nano Analysis GmbH, Germany) equipped with twin anode X-ray source and a hemispherical analyzer with a single-channel detector. The spectra were obtained using a 150 W non-monochromatic Al Kα radiation (1486.6 eV).
4. Results and Discussion
To highlight the major outcome from this work, luminescence and temperature dependent magnetic studies of Eu3+ doped ZnO NPs has been presented in the first part of the manuscript and the necessary supporting data in the form of structural, morphological and compositional evaluations are dealt with subsequently.4.1 Photoluminescence observations
RT PL excitation and emission spectra of undoped and Eu3+ doped ZnO NPs are shown in Fig. 2a and b. The undoped ZnO shows a near-band-edge UV absorption peak due to crosswise band gap excitation of ZnO at 379 nm [inset of Fig. 2a (LHS)] with the prominent broadband green emission peak around 536 nm [Fig. 2a]. The fluorescence excitation image of the undoped powder under 379 nm irradiation is shown in the inset of Fig. 2a (RHS) and this green peak of undoped ZnO is attributed solely to the radiative recombination of photo-generated holes with electrons attributed to Vo.27–29 In contrast, when Eu3+ is doped into ZnO, the observed PL are the characteristic of Eu3+ transitions. The excitation monitored on 395 nm due to 7F0 → 5L6 transition and 467 nm due to 7F0 → 5D2 transition of Eu3+ ions exhibit a sharp and strong orange red emission at 618 and 622 nm along with very low intensity peak at 590 nm related to the direct intra-4f transitions in Eu3+ ions and low intensity green band emission at 535 nm due to the intrinsic defects of ZnO host probably attributed to Vo, as inferred from the PL analysis of undoped ZnO. This latter conclusion gains credence from the observation that the PL intensity decreases for increasing Eu3+ concentration since the increasing Eu3+ corresponds directly to a decrease in Vo. PL emission increased with increase in Eu3+ concentration up to 0.1 M% and beyond that a decrease was observed with increasing Eu3+ concentration (Fig. 2d) justifying the choice of 0.1 M% Eu3+ as the optimum composition for further characterization. | ||
| Fig. 2 Spectroscopic investigation of the ZnO:Eu3+ NPs. PL studies of the (a) undoped (b) Eu3+ doped ZnO NPs. Excitation spectrum and fluorescent images of undoped and ZnO:Eu3+ (0.1 M%) NPs shown in corresponding insets. Absorption spectra and variation in PL intensity due to incorporation of Eu3+ in ZnO has been shown in figures (c) and (d). | ||
The major and sharp luminescence line at 618 nm is associated with the 5D0 → 7F2 transitions of Eu3+ ions, due to allowed electric-dipole transitions with inversion antisymmetry,30,31 which results in a large transition probability in the crystal field. In ZnO:Eu3+ NPs, the observed emission at 618 nm was split into two components at 618 and 622 nm. Theoretically, the 7F2 level gives three crystal field levels of 2E with 3Cv symmetry and A1, but because of the close proximity of 2E levels and A1 it is quite probable that the two emission peaks (E and A1 at 618 and 622 nm) could have overlapped in the PL spectra.32,33
The peak at 590 nm due to the 5D0 → 7F1 transition is an allowed magnetic-dipole transition, if the Eu3+ ion is situated in a symmetry center in the ZnO matrix. The electric-dipole transitions between the 4f6 levels are strictly forbidden by the Laporte selection rule (equal parity) while the magnetic-dipole is allowed. Thus, the intensity ratio of 5D0 → 7F2 electric dipole transition to 5D0 → 7F1 magnetic-dipole transition known as symmetry ratio can provide information about the structural quality of the material.33,34 The 1![[thin space (1/6-em)]](https://www.rsc.org/images/entities/char_2009.gif) :10 symmetry ratio in our material indicates very low inversion from electric to magnetic dipole symmetry when the Eu3+ ion is incorporated into hexagonal ZnO host by substitution in the Zn sub lattice and negligible emission of other Eu3+ characteristic transitions (for example, 5D0 → 7F0 at ∼580 nm; 5D0 → 7F3 at ∼650 nm) that leads to efficient electric dipole transition leading to observed strong orange red emission at 618–622 nm as shown in the inset of Fig. 2b (RHS). The observation of such strong green emission in undoped ZnO due to Vo and orange red emission without the distinct background of defect emission band in Eu3+ doped ZnO clearly suggests that there exists an energy transfer mechanism between the ZnO host and the Eu3+ ions.30,35–37
:10 symmetry ratio in our material indicates very low inversion from electric to magnetic dipole symmetry when the Eu3+ ion is incorporated into hexagonal ZnO host by substitution in the Zn sub lattice and negligible emission of other Eu3+ characteristic transitions (for example, 5D0 → 7F0 at ∼580 nm; 5D0 → 7F3 at ∼650 nm) that leads to efficient electric dipole transition leading to observed strong orange red emission at 618–622 nm as shown in the inset of Fig. 2b (RHS). The observation of such strong green emission in undoped ZnO due to Vo and orange red emission without the distinct background of defect emission band in Eu3+ doped ZnO clearly suggests that there exists an energy transfer mechanism between the ZnO host and the Eu3+ ions.30,35–37
 | ||
| Fig. 3 Photoluminescence mechanism of ZnO:Eu3+ NPs. Schematic illustration of possible excitation and emission mechanism of undoped and Eu3+ doped ZnO NPs. | ||
4.2 Results from magnetic studies
The temperature dependent M–H curves of undoped and Eu3+ doped ZnO NPs from 150 to 600 K is shown in Fig. 4. The magnetization (M) value of undoped ZnO shows a rapid decrease with increase in temperature but the coercive field (Hc) decreased up to RT from 150 K and further increased up to 400 K and thereafter gradually decreased with increase in temperature up to 600 K (Table 1) which could be a result of the reduced thermal fluctuation and better spin alignment at low temperatures. The magnetization signal of undoped ZnO persists up to 600 K and shows Hc of 795.37 A m−1 and M of 0.053 A m2 kg−1 as shown in the inset of Fig. 4a and Table 1, established the stability of FM above RT. | ||
| Fig. 4 Magnetic properties of Eu3+ doped ZnO NPs. Temperature related VSM plots of (a) undoped (b) 0.01 M% (c) 0.1 M% (d) 0.25 M% of Eu3+ doped ZnO NPs shows change in magnetization (ferromagnetic to paramagnetic) by increasing the temperature at higher Eu3+ concentration. The insets in the bottom of figures (a)–(c) shows the magnified view of corresponding NPs to show coercive field. The insets in the top of figure (c), top and bottom of figure (d) shows the magnified view of the paramagnetic properties of the ZnO:Eu3+ NPs at 600 K (figure (c)), 500 and 600 K (figure (d)). | ||
| Sample details | Temperature (K) | ||||||||||
|---|---|---|---|---|---|---|---|---|---|---|---|
| 150 | RT | 400 | 500 | 600 | |||||||
| Hc | M | Hc | M | Hc | M | Hc | M | Hc | M | ||
| Undoped ZnO | 5753.66 | 0.214 | 793.78 | 0.184 | 931.51 | 0.073 | 808.11 | 0.068 | 795.37 | 0.053 | |
| Eu3+ concentration | 0.01 M% | 5717.93 | 0.201 | 646.49 | 0.188 | 921.96 | 0.078 | 760.34 | 0.062 | 548.56 | 0.028 |
| 0.1 M% | 6091.87 | 0.240 | 566.07 | 0.190 | 564.48 | 0.052 | Nil | Nil | PM | PM | |
| 0.25 M% | 5478.20 | 0.221 | 546.17 | 0.189 | Nil | Nil | PM | PM | PM | PM | |
The M–H studies were carried out for lower (0.01 M%), medium (0.1 M%) and higher (0.25 M%) concentration of Eu3+ to see the effect of doping on the FM behavior of ZnO lattice and the results are presented as Fig. 4b–d respectively. Hc gradually decreased with increase in Eu3+ concentration compared to undoped ZnO case, while maintaining M constant. The Hc drastically reduced at RT compared to 150 K and gradual decreasing trend with temperature and Eu3+ doping in ZnO lattice. At 0.01 M%, the magnetization significantly reduced with temperature and the Hc increased at 400 K compared to RT and gradually decreased with increase in temperature above 400 K (Table 1). In the 0.1 M%, Hc and M decreased with increase in temperature up to 400 K and FM is almost zero at 500 K and the paramagnetic response is observed at 600 K as shown in the inset of Fig. 4c and Table 1. The complete extinction of the FM observed at 400 K by increasing the Eu3+ concentration to 0.25 M%, along with the appearance of paramagnetic character with further increase in temperature up to 600 K as shown in insets of Fig. 4d. This magnetic transition (ferromagnetic to paramagnetic) suggests that the high temperature is responsible for the rapid destruction of ferromagnetic coupling. Fig. 5 reveals the variation of magnetization as a function of temperature between 150 and 600 K at an applied DC magnetic field of 5000 Oe. Slightly decreased trend of magnetization observed for undoped and lower Eu3+ concentration (0.001 M%) and notable magnetization drop observed at around 500 K for 0.1 M% Eu3+ doped NPs (RHS of the inset). The magnetization falls sharply at 400 K and almost zero at 600 K for higher Eu3+ concentration (0.25 M%) conclusively proves that role of Eu3+ in FM to paramagnetism transition. The dM/dT curves (LHS of the inset) of 0.25 M% of Eu3+ doped ZnO NPs shows an intercept at about 550 K indicating the Curie temperature. This falls in line with our earlier observation from the B vs. H studies (Table 1) which shows ferromagnetism to paramagnetism transition at this temperature range. Extended analysis of the magnetic characteristics of ZnO:Eu3+ by MFM show the formation of magnetic domains which establishes the fundamental origin of FM. The MFM image of undoped and Eu3+doped ZnO NPs (Fig. 6) at RT reveals uniform and oriented distribution and the aligned magnetic domains are indicative of the magnetic interactions.38–40
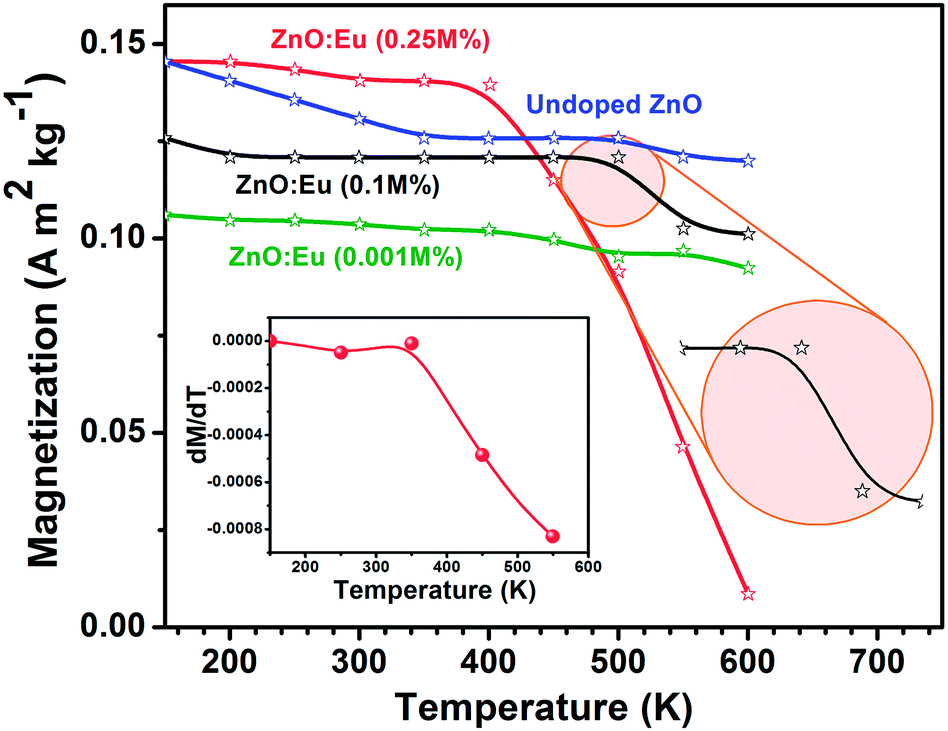 | ||
| Fig. 5 Temperature dependent magnetic properties of Eu3+ doped ZnO NPs. Temperature related magnetization plots of undoped and Eu3+ doped ZnO NPs shows the Curie temperature and transition in magnetization (ferromagnetic to paramagnetic) at higher Eu3+ concentration. The inset (LHS) shows the dM/dT curves, which indicated the TC of 550 K. | ||
 | ||
| Fig. 6 MFM picture (2D and 3D) of pellet made of (a & b) undoped (c & d) 0.01 M% and (e & f) 0.1 M% of Eu3+ doped ZnO NPs shows the presence of magnetic domain structure which confirms the internal ferromagnetism. | ||
The M vs. T studies also lend support to the above claim. The presence of Vo was confirmed by PL, EDS and XPS analysis (EDS, XPS studies are elaborated in the following section) and in trying to establish a correlation between Vo and the FM in ZnO system it is observed that Vo in undoped ZnO, enhances the defect related green emission as seen in the PL studies and the VSM studies show a maximum Hc and magnetization in undoped ZnO NPs at RT compared to Eu3+ containing samples, which establishes that Vo is responsible for the observed FM. Decrease in coercive field and magnetization by increasing dopant concentration can be directly correlated to the decrease in Vo related green luminescence with increasing dopant concentration from PL studies and decreased intensity of O2− ions in XPS analysis for Eu3+ doped samples compared with undoped ZnO NPs. Similar observations have been earlier reported in undoped42 and Nd doped ZnO NPs.43 Several theories proposed for defect induced FM44–46 like magnetic cations, carriers, and defects that can make up bound magnetic polarons (BMPs) could be responsible for the observed RTFM.44 One such theory is related to the F+ center exchange mechanism due to extended BMPs which overlap to create a spin-split impurity band. The F+ centers are mainly the electrons in the singly occupied Vo lying deep in the gap which could possibly influence ferromagnetic ordering. Uncontrolled formation of lattice defects can generate carriers that mediate FM and this mechanism supports the related RTFM induced by point defects such as Vo. Fig. 7 shows a schematic of the interaction in Zn and oxygen atoms, where defects such as Vo act as electron source. As the concentration of these electrons, which are lying in hydrogenic orbitals with characteristic Bohr radii is high; their individual orbits extend out into narrow impurity bands. Electrons interact with all magnetic ions that lie within their orbit. In the event of adequate magnetic spins, the electron is completely spin polarized. Furthermore, the magnetic moments have an indirect exchange interaction mediated by carriers, resulting in ferromagnetic ordering. In the case of doped material there are two phenomena. One is the introduction of Eu3+ occupying the Zn2+ position would result in reduction of Vo to maintain charge balance. This justifies the reduction in the ferromagnetic character with increasing Eu3+ concentration. Secondly Eu3+ by itself is a paramagnetic atom that explains for the ferromagnetic to paramagnetic transition as represented in these schematic.
 | ||
| Fig. 7 Schematic diagram of the (a) undoped and (b) Eu3+ doped wurtzite structure of ZnO NPs shows the presence of oxygen vacancies Vo, ferromagnetic (FM) and paramagnetic (PM) couplings along with formation of polarons. | ||
To further substantiate this proposal; more convincing analysis of defect states was performed with EPR analysis. Fig. 8 shows the EPR results measured at RT for the undoped and Eu3+ doped (0.1 M%) ZnO NPs. It can be seen that a single EPR signal appearing in both the samples suggests that similar type of paramagnetic defects are present in the lattice. According to earlier reports, such EPR signal is believed to be characteristic of FM in oxide nanostructures,47,48 which has its origin in the paramagnetic Vo with an unpaired electron.49 EPR signals with the peak values of g = 2.021 for undoped and g = 2.006 for Eu3+ doped ZnO have been attributed to chemisorbed oxygen.50 Chemisorbed oxygen was reported to result in a very broad feature between g = 2.005 to 2.05 which is in agreement with the broad peak observed in this range for our RT EPR measurements. As expected, the intensity of EPR signal becomes weaker in Eu3+ doped samples compared with undoped ZnO, indicating that the concentration of the Vo decreases in Eu3+ doped ZnO, which is in agreement with the PL, VSM and XPS results.
 | ||
| Fig. 8 EPR spectra of (a) undoped and (b) Eu3+ doped (0.1 M%) ZnO NPs. | ||
4.3 Structural, morphological and compositional evaluations
Fig. 9 shows the XRD patterns of undoped (Fig. 9a) and Eu3+ doped (0.1 M%) ZnO NPs (Fig. 9d). The peaks are sharp indicating the highly crystalline nature of the synthesized materials. The observed patterns were fitted using the Rietveld method considering the P63mc space group with a hexagonal structure [Fig. 9b (undoped ZnO) and Fig. 9c (ZnO:Eu3+)]. It can be seen that the profiles for observed and calculated data are in perfect agreement. The refinement details and reliability factors obtained through Rietveld analysis are given in Table 2, where the goodness of fit (S) comes out to be around 1.0099 for undoped ZnO and 2.0581 for ZnO:Eu3+. The structure of the undoped and Eu3+ doped ZnO NPs shown in the corresponding insets of the Fig. 9b and c show only ZnO structure, confirming the purity of the NPs. Fig. 9e shows the unit cell of the ZnO NPs where the position and direction of Zn and oxygen ions can be seen. To determine the alterations in crystal parameters, the prominent (100), (002), (101) peaks of prepared NPs were analyzed (Fig. 10a) and results indicate the shift in peak positions towards higher 2θ because of the tensile strain caused by the doping of Eu3+ with a comparatively larger ionic radius (0.1087 nm), replacing the Zn2+ (0.088 nm), in ZnO lattice.51 The hexagonal wurtzite structure has been observed in all the samples where the peaks were well matched with the JCPDS data card no. 36-1451. No separate peaks due to Eu3+ or any other impurity confirms the purity of ZnO within the detection limits of the XRD. The mean crystallite size of these NPs estimated by applying the Scherrer's formula to the major diffraction peaks is about 30–35 nm. The EDS spectrum of Eu3+ doped ZnO (0.1 M%) shown in Fig. 10b reveals the presence of only Zn, O and Eu3+ elements, confirming the absence of any other impurity. The atomic percentage of the elements, Zn, O and Eu3+ are 50.93, 48.21% and 0.86% respectively, reflects the oxygen deficiency and incorporation of Eu3+ in the sample. | ||
| Fig. 9 Structural properties of ZnO:Eu3+ NPs. XRD and Rietveld refinement pattern of the Undoped (a and b) and Eu3+ (0.1 M%) doped ZnO NPs (c and d) shows purity and crystalline nature of the samples. (e) Unit cell of undoped ZnO shows the positions of zinc and oxygen. | ||
| Parameters | Undoped ZnO | ZnO:Eu3+ (0.1 M%) |
|---|---|---|
| R expected (Rexp) | 2.3856 | 2.1017 |
| R profile (Rp) | 1.9375 | 3.6224 |
| Weighted profile factor (Rwp) | 2.4094 | 4.3255 |
| Goodness of fit (S) [(Rwp)/(Rexp) | 1.0099 | 2.0581 |
 | ||
| Fig. 10 Incorporation of Eu3+ in ZnO lattice. Observed shift in XRD peak position (figure (a)) due to Eu3+ incorporation and Eu3+ detected in EDS analysis [figure (b); ZnO:Eu3+ (0.1 M%)] confirms the incorporation of Eu3+ in ZnO lattice. | ||
XPS analysis was employed to further determine presence of Eu3+ and confirm its oxidation state in ZnO lattice and to determine surface chemical composition. From Fig. 11a, peaks assigned to core levels of Zn 2p, Zn 3p, O 1s and Eu 3d are identified. Fig. 11b is the Zn 2p core level spectra in undoped and Eu3+ doped ZnO NPs showing the Zn 2p spin orbit split doublet at 1044.5 and 1021.4 eV confirming the Zn2+ in the zinc oxide.52,53 O 1s core level spectra of undoped and Eu3+ doped ZnO along with deconvolution spectra shown in Fig. 11c, e and f have two-peak contribution. The first peak centered at 530.9 nm can be assigned to the O2− ions in the hexagonal structure of ZnO lattice surrounded by zinc atoms.54 The second binding energy peak centered at 532.4 is associated with O2− ions that are in oxygen deficient regions (Vo) within the matrix of ZnO.55 From the comparative studies, it is found that the Vo peak decreased in Eu3+ doped NPs compared to undoped ZnO and this indicates a gradual decreasing of defect concentration in doped NPs compared to undoped ZnO which is consistent with the PL analysis. The core level XPS spectra of Eu 3d gives a single intense peak at 1134.7 eV due to Eu 3d3/2, indicating the oxidation state of Eu3+ ions to be primarily trivalent for the ZnO:Eu3+ NPs.56
 | ||
| Fig. 11 Binding energy positions of ZnO:Eu3+ from XPS spectra (a) survey scan (b) Zn core level (c) oxygen core level and (d) Eu3+ core level region and deconvoluted oxygen core level spectrum of (e) undoped and (f) 0.1 M% Eu3+ doped ZnO NPs confirmed the incorporation of dopant and presence of Vo. | ||
The surface morphology of the ZnO:Eu3+ NPs were examined using FE-SEM. All the images in Fig. 12 show the nano rod and plate like structure and the obtained doped NPs undergo significant morphological changes because of the Eu3+ incorporation into ZnO lattice. Undoped ZnO shows plate like formation with rough surface (Fig. 12a) with thickness of about 800 nm and width about 60–80 nm indicating a preferential growth. The ZnO doped with lower Eu3+ concentration (0.025 M%) showed nanorods with smooth surface and decreased length compared to undoped ZnO without any preferred orientation. A further increase of Eu3+ concentration (0.1 M%), smoothened the nanorods and hexagonal cross sections were visible towards the end of the nanorods as indicated by the arrow in the picture. To elaborate on the morphology change, it can be seen that with the introduction of Eu3+ into ZnO lattice, the growth along c-axis is affected and the length of nanorods is decreased, which gives the evidence of hindered growth of crystal along c-axis.
 | ||
| Fig. 12 Morphology of the ZnO:Eu3+ NPs. FESEM images of (a) undoped and (b) 0.025 M% and (c) 0.1 M% of Eu3+ doped ZnO NPs. EDS elemental mapping showing (d) Zn (e) O and (f) Eu3+ distribution in ZnO sample. | ||
The growth mechanism of NPs can be explained on the basis of the polar surfaces of ZnO. The hexagonal wurtzite structure of ZnO comprises of sequentially alternating planes of tetrahedrally coordinated O2− and Zn2+ ions, piling up along the c-axis.57 The ions create positively charged (0001)-Zn and negatively charged (000−1)-O polar surfaces.58 The incorporation of Eu3+ into ZnO matrix can produce planar defects along (0001) plane disrupting the growth process resulting in rods of reduced length. EDS elemental mapping indicated that the samples were composed of only Zn (Fig. 12d), O (Fig. 12e), and Eu3+ uniformly distributed (Fig. 12f).
5. Conclusions
Well crystallized undoped and Eu3+ doped ZnO NPs were prepared by simple SCT technique. PL studies of undoped ZnO exhibit prominent green band emission (536 nm) due to radiative recombination of a photo-generated hole with an electron attributed to Vo. Eu3+ doped ZnO NPs, under the typical UV excitation of ZnO host, the direct energy transfer from ZnO host to Eu3+ ions, along with a quenching of broad defect emission of ZnO was observed which possibly arises due to the formation of intrinsic trapping centers due to the substitution of Zn2+ by Eu3+ in the NPs. The magnetic studies show a stable FM at RT with Hc of 793.78 A m−1 and magnetization of 0.184 A m2 kg−1 for undoped ZnO NPs. The temperature dependent magnetization studies (150–600 K) show stable FM well above RT for undoped ZnO NPs that gradually decreased by introducing the dopant and the observed phase transformation from ferromagnetic to paramagnetic observed at higher Eu3+ concentration supports our theory on the origin of defects in high temperature FM observed in undoped oxide semiconductors. The dM/dT gives a Curie temperature of about 550 K that falls in line with the ferromagnetic to paramagnetic transition observed in the B vs. H studies. The EPR analysis further confirmed the origin of defects could be Vo and its decrease by increasing Eu3+ concentration leads to reduced in FM. This study also directs us to propose a method for designing materials with tunable FM by appropriate dopant.Acknowledgements
Dr K. Jayanthi Rajan acknowledges CSIR-Nehru Science Postdoctoral Research Fellowship and Senior Research Associate (Scientists' Pool Scheme) for the financial support. The authors acknowledge the financial support from CSIR XII plan projects CSC-0134 (M2D) and CSC-0114 (IntelCOAT) and are thankful to Dr Divi Haranath and Dr Bipin Kumar Gupta, CSIR-National Physical Laboratory, New Delhi for their assistance in the PL measurements.References
- B. R. Lee, E. D. Jung, J. S. Park, Y. S. Nam, S. H. Min, B.-S. Kim, K.-M. Lee, J.-R. Jeong, R. H. Friend, Ji-S. Kim, S. O. Kim and M. H. Song, Nat. Commun., 2014, 5, 4840 CrossRef CAS PubMed.
- S. M. Chou, L. G. Teoh, W. H. Lai, Y. H. Su and M. H. Hon, Sensors, 2006, 6, 1420–1427 CrossRef CAS.
- X. Fang, Y. Bando, U. K. Gautam, T. Zhai, H. Zeng, X. Xu and M. L. D. Golberg, Crit. Rev. Solid State Mater. Sci., 2009, 34, 190–223 CrossRef CAS.
- X. M. Cheng and C. L. Chien, J. Appl. Phys., 2003, 93, 7876–7878 CrossRef CAS.
- G. Lawes, A. S. Risbud, A. P. Ramirez and R. Seshadri, Phys. Rev. B: Condens. Matter Mater. Phys., 2005, 71, 045201 CrossRef.
- S. Deka, R. Pasricha and P. A. Joy, Phys. Rev. B: Condens. Matter Mater. Phys., 2006, 74, 033201 CrossRef.
- R. Knut, J. M. Wikberg, K. Lashgari, V. A. Coleman, G. Westin, P. Svedlindh and O. Karis, Phys. Rev. B: Condens. Matter Mater. Phys., 2010, 82, 094438 CrossRef.
- T. Dietl, H. Ohno and F. Matsukura, Phys. Rev. B: Condens. Matter Mater. Phys., 2001, 63, 195205 CrossRef.
- J. M. D. Coey, M. Venkatesan and C. B. Fitzgerald, Nat. Mater., 2005, 4, 173–179 CrossRef CAS PubMed.
- A. Kaminski and S. D. Sarma, Phys. Rev. Lett., 2002, 88, 247202 CrossRef CAS PubMed.
- S. R. Shinde, S. B. Ogale, J. S. Higgins, H. Zheng, A. J. Millis, V. N. Kulkarni, R. Ramesh, R. L. Greene and T. Venkatesan, Phys. Rev. Lett., 2004, 92, 166601 CrossRef CAS PubMed.
- M. A. García, M. L. Ruiz-González, A. Quesada, J. L. Costa-Krämer, J. F. Fernández, S. J. Khatib, A. Wennberg, A. C. Caballero, M. S. Martín-González, M. Villegas, F. Briones, J. M. González-Calbet and A. Hernando, Phys. Rev. Lett., 2005, 94, 217206 CrossRef PubMed.
- S. D. Yoon, Y. Chen, A. Yang, T. L. Goodrich, X. Zuo, D. A. Arena, K. Ziemer, C. Vittoria and V. G. Harris, J. Phys.: Condens. Matter, 2006, 18, L355 CrossRef CAS.
- K. R. E. Kittilstved and D. R. Gamelin, J. Am. Chem. Soc., 2005, 127, 5292–5293 CrossRef CAS PubMed.
- K. R. Kittilstved, N. S. Norberg and D. R. Gamelin, Phys. Rev. Lett., 2005, 94, 147209 CrossRef PubMed.
- D. Rubi, J. Fontcuberta, A. Calleja, L. I. Aragones, X. G. Capdevila and M. Segarra, Phys. Rev. B: Condens. Matter Mater. Phys., 2007, 75, 155322 CrossRef.
- M. Venkatesan, C. B. Fitzgerald and J. M. D. Coey, Nature, 2004, 430, 630 CrossRef CAS PubMed.
- H. J. Xu, H. C. Zhu, X. D. Shan, Y. X. Liu, J. Y. Gao, X. Z. Zhang, J. M. Zhang, P. W. Wang, Y. M. Hou and D. P. Yu, J. Phys.: Condens. Matter, 2010, 22, 016002 CrossRef CAS PubMed.
- T. S. Herng, D.-C. Qi, T. Berlijn, J. B. Yi, K. S. Yang, Y. Dai, Y. P. Feng, I. Santoso, C. Sánchez-Hanke, X. Y. Gao, A. T. S. Wee, W. Ku, J. Ding and A. Rusydi, Phys. Rev. Lett., 2010, 105, 207201 CrossRef CAS PubMed.
- B. Panigrahy, M. Aslam, D. S. Misra, M. Ghosh and D. Bahadur, Adv. Funct. Mater., 2010, 20, 1161–1165 CrossRef CAS.
- M. Khalid, M. Ziese, A. Setzer, P. Esquinazi, M. Lorenz, H. Hochmuth, M. Grundmann, D. Spemann, T. Butz, G. Brauer, W. Anwand, G. Fischer, W. A. Adeagbo, W. Hergert and A. Ernst, Phys. Rev. B: Condens. Matter Mater. Phys., 2009, 80, 035331 CrossRef.
- X. Zhang, Y. H. Cheng, L. Y. Li, H. Liu, X. Zuo, G. H. Wen, L. Li, R. K Zheng and S. P. Ringer, Phys. Rev. B: Condens. Matter Mater. Phys., 2009, 80, 174427 CrossRef.
- M. A. Garcia, J. M. Merino, E. F. Pinel, A. Quesada, J. de la Venta, M. L. R. González, G. R. Castro, P. Crespo, J. Llopis, J. M. González-Calbet and A. Hernando, Nano Lett., 2007, 7, 1489–1494 CrossRef CAS PubMed.
- M. Khalid, M. Ziese, A. Setzer, P. Esquinazi, M. Lorenz, H. Hochmuth, M. Grundmann, D. Spemann, T. Butz, G. Brauer, W. Anwand, G. Fischer, W. A. Adeagbo, W. Hergert and A. Ernst, Phys. Rev. B: Condens. Matter Mater. Phys., 2009, 80, 035331 CrossRef.
- K. Potzger, S. Zhou, F. Eichhorn, M. Helm, W. Skorupa, A. Mücklich, J. Fassbender, T. Herrmannsdörfer and A. Bianchi, J. Appl. Phys., 2006, 99, 063906 CrossRef.
- J. Qi, D. Gao, J. Liu, W. Yang, Q. Wang, J. Zhou, Y. Yang and J. Liu, Appl. Phys. A, 2010, 100, 79–82 CrossRef CAS.
- D. Banerjee, J. Y. Lao, D. Z. Wang, J. Y. Huang, D. Steeves, B. Kimball and Z. F. Ren, Nanotechnology, 2004, 15, 404–409 CrossRef CAS.
- F. H. Leiter, H. R. Alves, A. Hofstaetter, D. M. Hofmann and B. K. Meyer, Phys. Status Solidi B, 2001, 226, R4–R5 CrossRef CAS.
- S. A. Studenikin, N. Geolego and M. Cocivera, J. Appl. Phys., 1998, 84, 2287–2294 CrossRef CAS.
- D. Wang, G. Xing, M. Gao, L. Yang, J. Yang and T. Wu, J. Phys. Chem. C, 2011, 115, 22729–22735 CAS.
- M. Zhong, G. Shan, Y. Li, G. Wang and Y. Liu, Mater. Chem. Phys., 2007, 106, 305–309 CrossRef CAS.
- V. V. Ursaki, E. Rusu, V. Zalamai, L. Sirbu, E. Monaico and I. M. Tiginyanu, Proc. SPIE 5822, Information Technologies, 2005, vol. 148, p. 2004 Search PubMed.
- S. O. Fujihara, A. Suzuqui and T. Kimura, J. Appl. Phys., 2003, 94, 2411 CrossRef CAS.
- J. Qi, T. Matsumoto, M. Tanaka and Y. Masumoto, J. Phys. D: Appl. Phys., 2000, 33, 2074 CrossRef CAS.
- K. Ebisawa, T. Okuno and K. Abe, Jpn. J. Appl. Phys., 2008, 47, 7236 CrossRef CAS.
- I. Atsushi and K. Yoshihiko, Appl. Phys. Lett., 2005, 86, 2531062 Search PubMed.
- Y.-P. Du, Y.-W. Zhang, L.-D. Sun and C.-H. Yan, J. Phys. Chem. C, 2008, 112, 12234–12241 CAS.
- J. Philip, A. Punnoose, B. I. Kim, K. M. Reddy, S. Layne, J. O. Holmes, B. Satpati, P. R. Santos, T. S. Leclair and J. S. Moodera, Nat. Mater., 2006, 5, 298 CrossRef CAS PubMed.
- H. C. Jeon, Y. S. Jeong, T. W. Kang, T. W. Kim, K. J. Chung, K. J. Chung, W. Jhe and S. A. Song, Adv. Mater., 2002, 14, 1725 CrossRef CAS.
- M. Diaconu, H. Schimdt, H. Hochmuth, M. Lorentz, G. Benndorf, J. Lenzner, D. Spemann, A. Setzer, K. Nielsen, P. Esquinazi and M. Grundmann, Thin Solid Films, 2005, 486, 117 CrossRef CAS.
- D. E. Motaung, G. H. Mhlongo, S. S. Nkosi, G. F. Malgas, B. W. Mwakikunga, E. Coetsee, H. C. Swart, H. M. I. Abdallah, T. Moyo and S. S. Ray, ACS Appl. Mater. Interfaces, 2014, 6, 8981–8995 CAS.
- J. Wang, S. Hou, H. Chen and L. Xiang, J. Phys. Chem. C, 2014, 118, 19469–19476 CAS.
- D. Wang, Q. Chen, G. Xing, J. Yi, S. R. Bakaul, J. Ding, J. Wang and T. Wu, Nano Lett., 2012, 12, 3994–4000 CrossRef CAS PubMed.
- J. M. D. Coey, M. Venkatesan and C. B. Fitzgerald, Nat. Mater., 2005, 4, 173–179 CrossRef CAS PubMed.
- B. Pal and P. K. Giria, J. Appl. Phys., 2010, 108, 084322 CrossRef.
- S. Chawla, K. Jayanthi and R. K. Kotnala, Phys. Rev. B: Condens. Matter Mater. Phys., 2009, 79, 125204 CrossRef.
- Z. B. Xia, Y. W. Wang, Y. J. Fang, Y. T. Wan, W. W. Xia and J. Sha, J. Phys. Chem. C, 2011, 115, 14576–14582 CAS.
- G. J. Yang, D. Q. Gao, J. L. Zhang, J. Zhang, Z. H. Shi and D. S. Xue, J. Phys. Chem. C, 2011, 115, 16814–16818 CAS.
- K. Vanheusden, W. L. Warren, C. H. Seager, D. R. Tallant, J. A. Voigt and B. E. Gnade, J. Appl. Phys., 1996, 79, 7983 CrossRef CAS.
- A. B. Djurisic, W. C. H. Choy, V. A. L. Roy, Yu H. Leung, C. Y. Kwong, K. W. Cheah, T. K. G. Rao, W. K. Chan, H. F. Lui and C. Surya, Adv. Funct. Mater., 2004, 14, 856–864 CrossRef CAS.
- R. Kumari, A. Sahai and N. Goswami, Progress in Natural Science: Materials International, 2015, 25, 300–309 CrossRef CAS.
- S. Y. Gao, H. J. Zhang, R. P. Deng, X. M. Wang, D. H Sun and G. L. Zheng, Appl. Phys. Lett., 2006, 89, 123125 CrossRef.
- L. Armelao, G. Bottaro, M. Pascolini, M. Sessolo, E. Tondello, M. Bettinelli and A. Speghini, J. Phys. Chem. C, 2008, 112, 4049 CAS.
- R. N. Aljawfi and S. J. Mollah, J. Magn. Magn. Mater., 2011, 323, 3126–3132 CrossRef CAS.
- M. Chen, X. Wang, Y. H. Yu, Z. L. Pei, X. D. Bai, C. Sun, R. F. Huang and L. S. Wen, Appl. Surf. Sci., 2000, 158, 134–140 CrossRef CAS.
- Y. P. Du, Y. W. Zhang, L. D. Sun and C. H. Yan, J. Phys. Chem. C, 2008, 112, 12234–12241 CAS.
- Y. J. Li, C. Y. Wang, M. Y. Lu, K. M. Li and L. J. Chen, Cryst. Growth Des., 2008, 8(8), 2598–2602 CAS.
- X. Y. Kong, Y. Ding, R. Yang and Z. L. Wang, Science, 2004, 303(5662), 1348–1351 CrossRef CAS PubMed.
| This journal is © The Royal Society of Chemistry 2016 |