DOI:
10.1039/C6RA10583A
(Paper)
RSC Adv., 2016,
6, 80576-80584
A validated gas chromatography mass spectrometry method for simultaneous determination of cathinone related drug enantiomers in urine and plasma
Received
24th April 2016
, Accepted 4th August 2016
First published on 18th August 2016
Abstract
A sensitive and selective method for detection and quantitation of cathinone related compounds using GC-MS has been developed. A chiral derivatization agent, (S)-(−)-N-(trifluoroacetyl)pyrrolidine-2-carbonyl chloride (L-TPC), has been used to achieve enantiomeric separation of some cathinone related drugs. Thirty one synthetic cathinones were separated into their optical enantiomers. Nikethamide was used as an internal standard for cathinone related drug quantitation. The analytical method has been validated in terms of recoveries, reproducibilities, linearities, limits of detection (LOD), and limits of quantitation (LOQ) for all the compounds under investigation. It was found that the LOD of the 12 cathinone derivatives in urine was in the range of 0.1–0.7 ppm and in plasma it was in the range of 0.17–1.33 ppm. The LOQ in urine was in the range of 0.29–2.14 ppm and in plasma it was in the range of 0.50–4.01 ppm.
Introduction
In 1980, khat was classified by the World Health Organization as a drug of abuse that can produce mild to moderate psychological dependence.1 It contains amphetamine-like stimulant alkaloids namely, cathinone and cathine,2 (see Scheme 1 for the cathinone structure). In recent years, New Designer Drugs (NDDs) have been developed as derivatives of prohibited substances in clandestine laboratories and find their way into the illegal market. Different disguised names of these designer drugs have been marketed as “plant-growth fertilizers”, “bath-salts” and “spices” to sell them illegally on the black market.3,4 For example, bath salts and synthetic cathinones became widely spread and turn out to be among the most prevalent classes of compounds found in these products which have an effect similar to cocaine, methylenedioxymethamphetamine (MDMA) or other amphetamines.2
 |
| Scheme 1 | |
All of the cathinone and amphetamine like drugs possess a chiral center. It was found that R-isomers of methcathinone and amphetamine exhibit weaker effect on the central nervous system (CNS) as compared to their S enantiomers.5 In khat plants, both (R) and (S)-cathinone, only (S)-cathinone was found to show a strong stimulating effects on the CNS as compared to the (R)-enantiomer.6 Unfortunately, drug dealers distribute their substances as pure S-enantiomers, which can increase the risk of overdose and prove lethal.7 Enantiomeric separation and determination of these NDD's may give information about the source of these synthetic drugs and the raw materials that were used in the synthesis process and also facilitates the drug tracking.8
Different analytical techniques have been used for chiral separation of the enantiomers of drug of abuse, such as capillary electrophoresis (CE),9,10 high-performance liquid chromatography (HPLC),3,11 super critical fluid chromatography (SFC)12 and gas chromatography (GC).8,13 Direct chiral separation can be achieved using chiral stationary phases (CSP), which can be bonded chemically or physically to the stationary phase. Moreover, it can provide enantiomeric separation due to one of the following principles: cyclodextrin host-guest inclusion reaction, hydrogen bonding on the chiral center or chiral metal complex coordination.14 However indirect chiral separation has been done using chiral derivatizing agents (CDA's) with achiral columns. The CDA converts cathinone isomers to diastereomeric derivatives that can be separated on achiral stationary phase due to their different chemical and physical properties.15,16 (S)-(−)-N-(Trifluoroacetyl)pyrrolidine-2-carbonyl chloride (L-TPC), Scheme 1, is one of the most well-known chiral derivatization agent that has been used commercially for separation of enantiomers. It has many advantages such as availability, high reaction efficiency and high resolution of the resulting diastereoisomers.14 Recently, L-TPC has been used for chiral separation of cathinone related drugs on GC-MS.8,13
In this work, a GC-MS method has been developed to analyze 31 cathinone related compounds as diastereoisomers. Moreover, 18 of these compounds have been separated into their enantiomers for the first time. Quantitative analysis of spiked urine and plasma has been conducted for 12 cathinone related drugs as a mixture simultaneously; Scheme 2 shows the chemical structure of these compounds. The method validation has been performed in spiked biological samples.
 |
| Scheme 2 | |
Experimental
Chromatographic conditions
Chromatographic separation was performed on an Agilent (Waldbronn, Germany) HP 6890 GC coupled to an Agilent (Waldbronn, Germany) HP 5973 mass selective detector. A commercially available 60 m HP 5 MS capillary column, with 0.25 mm inner diameter and a 0.25 μm film thickness was used as stationary phase. Helium was used as carrier gas at a constant flow rate of 1.2 mL min−1. Injection of 2 μL of sample solution was performed automatically with a split ratio of 21
:
1. The injector and GC-MS interface temperature were set at 250 and 280 °C, respectively. Data collection was performed in Selected Ion Monitoring (SIM) mode with the following selected fragments: 58, 106, 166 and 251 Da starting 10 min after injection. The column temperature program was as follows: starting at 160 °C then holding for 5 min, followed by subsequent heating to 250 °C with a heating rate of 5 °C min−1. The final temperature was held at 250 °C for 22 min.
Chemicals and reagents
All chemicals were of analytical grade. Ethylacetate, acetic acid, methanol, 2-propanol, ammonium hydroxide, dichloromethane, 0.1 M solution of (S)-(−)-N-(trifluoroacetyl)pyrrolidine-2-carbonyl chloride (L-TPC) with an enantiomer excess (ee) of 97% (according to supplier's specification) in dichloromethane, anhydrous sodium sulfate, sodium phosphate and nikethamide were obtained from Sigma-Aldrich Chemicals (St. Louis, MO, USA). Potassium carbonate was obtained from VWR (Darmstadt, Germany). Doubly deionized water was obtained from ultra-pure Millipore system (MS, USA). All chemicals shown in Table 1 were purchased from Cayman chemicals (Michigan, USA). The cathinone related drugs were supplied as racemic mixtures of R and S enantiomers.
Table 1 List of the 31 cathinone related compounds and their abbreviation, in addition to the retention times of the separated two diastereoisomers for each compound analyzed on GC-MS using SIM mode
|
Name |
Abbreviation |
Time (min) |
Resolution factor (Rs) |
Selectivity factor (α) |
t1 |
t2 |
1 |
4-Methylbuphedrone |
— |
28.7 |
29.22 |
4.72 |
1.026 |
2 |
Pentylone |
— |
41.81 |
42.41 |
2.69 |
1.018 |
3 |
Methedrone |
4-MeOMC |
32.09 |
33.36 |
8.92 |
1.055 |
4 |
4-Methyl-α-ethylaminobutiophenone |
— |
29.2 |
29.62 |
3.24 |
1.021 |
5 |
Nor-mephedrone |
— |
26.15 |
27.5 |
14.89 |
1.079 |
6 |
Pentedrone |
— |
27.76 |
27.86 |
1.04 |
1.005 |
7 |
Ethcathinone |
— |
25.85 |
26.23 |
3.65 |
1.023 |
8 |
Butylone |
— |
38.6 |
39.59 |
5.22 |
1.033 |
9 |
Buphedrone |
— |
26.37 |
26.48 |
1.19 |
1.006 |
10 |
2-Methoxymethcathinone |
2-MeOMC |
28.73 |
29.41 |
5.81 |
1.034 |
11 |
4-Fluoromethcathinone |
4-FMC |
24.47 |
24.64 |
2.13 |
1.011 |
12 |
2-Methylethcathinone |
2-MEC |
27.08 |
27.82 |
5.08 |
1.041 |
13 |
2-Fluoromethcathinone |
2-FMC |
24.66 |
25.21 |
4.11 |
1.035 |
14 |
2-Ethylmethcathinone |
2-EMC |
27.78 |
28.47 |
5.39 |
1.037 |
15 |
2,3-Dimethylmethcathinone |
2,3-DMMC |
29.3 |
30.32 |
7.92 |
1.050 |
16 |
4-Fluoroethcathinone |
4-FEC |
25.05 |
25.28 |
2.45 |
1.014 |
17 |
4-Ethylmethcathinone |
4-EMC |
29.82 |
30.75 |
7.47 |
1.045 |
18 |
4-Ethylethcathinone |
4-EEC |
30.68 |
31.59 |
6.80 |
1.042 |
19 |
3-Methylmethcathinone |
3-MMC |
27.02 |
27.41 |
3.90 |
1.022 |
20 |
3-Methylethcathinone |
3-MEC |
27.69 |
28.13 |
3.71 |
1.024 |
21 |
3-Fluoromethcathinone |
3-FMC |
24.55 |
24.66 |
1.34 |
1.007 |
22 |
3-Ethylmethcathinone |
3-EMC |
28.98 |
29.4 |
3.67 |
1.021 |
23 |
3-Ethylethcathinone |
3-EEC |
29.7 |
30.17 |
3.91 |
1.023 |
24 |
3,4-Dimethylmethcathinone |
3,4-DMMC |
30.6 |
31.54 |
8.04 |
1.044 |
25 |
2-Methylmethcathinone |
2-MMC |
26.35 |
26.93 |
4.47 |
1.033 |
26 |
4-Methylethcathinone |
4-MEC |
28.1 |
28.87 |
6.73 |
1.040 |
27 |
3,4-Dimethylethcathinone |
3,4-DMEC |
31.42 |
32.34 |
7.39 |
1.041 |
28 |
3-Fluoroethcathinone |
3-FEC |
25.2 |
25.34 |
1.42 |
1.009 |
29 |
2,3-Methylenedioxymethcathinone |
2,3-MDMC |
33.85 |
35.15 |
8.07 |
1.052 |
30 |
3-Methoxymethcathinone |
3-MeOMC |
30.45 |
30.71 |
2.01 |
1.012 |
31 |
Eutylone |
— |
39.46 |
40.11 |
3.47 |
1.021 |
Sample preparation
This investigation conforms to the UAE community guidelines for the use of humans in experiments. The Human Ethics committee at the Dubai Police approves the study. Blood and urine samples were collected at Dubai Police with subjects consent.
Urine and plasma spiking and solid phase extraction
Sold phase extraction (SPE) was carried out using “Zymark rapid trace” SPE workstation (Artisan Technology Group, IL, USA) and the column was 200 MG clean screen CSDAU203 from FluoroChem, (Hadfield, UK). Urine samples were diluted in 1
:
1 ratio with doubly deionized water. 3 mL of diluted urine was spiked with certain concentration of cathinones derivative and 50 ppm of internal standard (IS) (nikethamide) in addition to 1 mL of 0.1 M phosphate buffer (pH 6.0). For plasma samples spiking, 1 mL of plasma was spiked with certain concentration of cathinone derivative, and 50 ppm of IS in addition to 3 mL of 0.1 M phosphate buffer (pH 6.0). Samples were shaken well for 30 s. For SPE cartridge conditioning, 3 mL of methanol and the same volume of deionized water were used with 1 mL of 0.1 M phosphate buffer. After that the spiked urine or plasma sample was loaded to the cartridge and later on the cartridge was washed by 3 mL of methanol and 3 mL of deionized water and 1 mL 0.1 M acetic acid. The column was left for 5 min for drying. Finally, 3 mL of the eluate, which is made of a mixture of dichloromethane, isopropanol and ammonium hydroxide with a relative ratio of (78
:
20
:
2), was collected and evaporated to dryness under nitrogen gas stream.
Derivatization step
For pure sample and spiked sample analysis, evaporation step was needed before derivatization reaction can take place. After evaporation was done, 100 μL of deionized water was transferred into a glass test tube together with 125 μL of a saturated aqueous solution of potassium carbonate, 1.5 mL of ethylacetate and 12.5 μL of L-TPC. For the analysis of spiked urine and plasma samples, 50 μL of L-TPC was used. The mixture was covered and stirred for 10 min at room temperature. Afterwards, the upper layer was transferred to a new test tube and dried over anhydrous sodium sulfate. The dried solution was evaporated under a soft nitrogen stream to ensure that it is clear from water. The remaining L-TPC-derivative was reconstituted in certain amount of ethylacetate – depending on concentration, e.g. a volume of 0.1 mL and 1.0 mL were used to obtain final concentration of 100 ppm and 10 ppm, respectively, prior to injection in GC-MS instrument.
Results
The basic idea of developing the analytical method for cathinone related drugs was to convert the two enantiomers of each one of these analytes into two diastereomers after reaction with pure chiral derivatization reagent, L-TPC (Scheme 3). The resulting diastereomers can be separated due to their different chemical and physical properties on common stationary phase columns. The derivatization reagent, L-TPC, reacts with analytes that have primary or secondary amine group in the presence of sodium carbonate that causes the amidation between the acid chloride and the amine group. Fig. 1 shows the gas chromatogram for separation of R and S enantiomers of methedrone drug after derivatization with L-TPC in the presence of nikethamide as an internal standard. Moreover, Table 1 shows the retention time of the separated enantiomers for the 31 cathinone related compounds. All the tested compounds contain at least one primary or secondary amine in their chemical structures. Each one of these compounds was prepared in methanol and was analyzed individually on GC-MS using SIM mode, after going through the derivatization step.
 |
| Scheme 3 | |
 |
| Fig. 1 Gas chromatogram for separation of the R and S enantiomers of methedrone drug in methanol after derivatization with L-TPC in the presence of nikethamide internal standard. | |
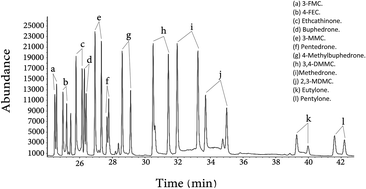
Among the 31 compounds under study, twelve of these cathinone related compounds were tested in plasma and urine matrices. They were selected based on their retention time as reported in Table 1. Fig. 2 shows the GC total ion chromatogram of these compounds after being spiked in urine. It was possible to see a good separation of the mixture components with good peak resolution for most of them. Moreover, Fig. 3 shows the total ion chromatogram of the same twelve cathinone related compounds spiked in plasma. It was observed that the enantiomers were separated nicely with good peak resolution. To the best of our knowledge, this is the first example in the literature that demonstrates the separation of 12 pairs of cathinone enantiomers in one run in complex matrices such as urine and plasma.
 |
| Fig. 2 Total ion chromatogram (TIC) of the simultaneous chiral separation of 12 cathinones related compounds. All compounds were spiked in urine and separated as L-TPC derivatives. | |
 |
| Fig. 3 Total ion chromatogram (TIC) of the simultaneous chiral separation of 12 cathinones. Compounds mixture were spiked in plasma matrix and separated as L-TPC derivatives. | |
Method validation was performed on these 12 tested compounds spiked in urine and plasma. The calibration curve linearity, limit of detection (LOD), limit of quantitation (LOQ), recoveries in addition to inter-day and intra-day reproducibilities were collected and are summarized in Tables 2–7.
Table 2 Results for twelve cathinone related compounds spiked in urine including linearity coefficient, R2 values, limits of detection and limits of quantitations for the two enantiomers (E1 & E2) of each compound
|
|
R2 |
LOQ (ppm) |
LOD (ppm) |
E1 |
E2 |
E1 |
E2 |
E1 |
E2 |
1 |
Methedrone |
0.9954 |
0.9976 |
1.80 |
2.02 |
0.59 |
0.67 |
2 |
Pentylone |
0.9989 |
0.9966 |
2.14 |
1.92 |
0.71 |
0.63 |
3 |
4M-Buphedrone |
0.9940 |
0.9986 |
1.33 |
1.25 |
0.44 |
0.41 |
4 |
Ethcathinone |
0.9954 |
0.9937 |
0.64 |
0.66 |
0.21 |
0.22 |
5 |
Pentedrone |
0.9907 |
0.9954 |
1.41 |
1.44 |
0.47 |
0.47 |
6 |
4-FEC |
0.9949 |
0.9957 |
0.67 |
0.67 |
0.22 |
0.22 |
7 |
3-MMC |
0.9943 |
0.9985 |
0.26 |
0.26 |
0.08 |
0.09 |
8 |
3-FMC |
0.9904 |
0.9925 |
0.29 |
0.23 |
0.10 |
0.08 |
9 |
3,4-DMMC |
0.9965 |
0.9979 |
0.31 |
0.32 |
0.10 |
0.11 |
10 |
2,3-MDMC |
0.9940 |
0.9917 |
0.24 |
0.23 |
0.08 |
0.08 |
11 |
Eutylone |
0.9988 |
0.9976 |
1.31 |
1.32 |
0.43 |
0.44 |
12 |
Buphedrone |
0.9952 |
0.9969 |
0.33 |
0.29 |
0.11 |
0.10 |
The calibration graphs for the 12 enantiomer pairs of cathinone derivatives… were established and found to be linear within the tested range of 10 to 200 μg mL−1 in urine and in plasma with mean regression coefficients (R2; n = 3) of 0.99 or higher. Fig. 4 shows the calibration graph of the two methedrone enantiomers in plasma and urine. The regression coefficients and the limit of detection (LOD) and limit of quantitation (LOQ) values for the two enantiomers of each one of these compounds in urine and plasma are reported in Tables 2 and 3 respectively. The accuracy and reproducibility of the method were evaluated as well in urine and plasma matrices. Tables 4 and 5 show the interday and intraday reproducibilities of these 12 cathinone related compounds in urine and plasma matrices, respectively. Three different concentrations have been measured for each enantiomer of these compounds. Moreover, the recovery measurements have been conducted by spiking 20, 100 and 200 ppm of these compounds into urine and plasma matrices and evaluated by calculating the percent error. Tables 6 and 7 summarize the recovery measurements for the enantiomers of the 12 cathinone compounds at three different concentrations.
 |
| Fig. 4 Calibration graphs of the two separated enantiomers of the methdrone compound in (a & b) plasma, and (c & d) in urine. Calibration ranges was 10–200 ppm. | |
Table 3 Results for twelve cathinone related compounds spiked in plasma including linearity coefficient, R2 values, limits of detection and limits of quantitations for the two enantiomers (E1 & E2) of each compound
|
|
R2 |
LOQ (ppm) |
LOD (ppm) |
E1 |
E2 |
E1 |
E2 |
E1 |
E2 |
1 |
Methedrone |
0.9927 |
0.9924 |
1.13 |
1.37 |
0.37 |
0.45 |
2 |
Pentylone |
0.9913 |
0.9973 |
0.81 |
1.00 |
0.27 |
0.33 |
3 |
4M-Buphedrone |
0.9945 |
0.9985 |
1.21 |
2.15 |
0.40 |
0.71 |
4 |
Ethcathinone |
0.9968 |
0.9927 |
3.13 |
4.01 |
1.03 |
1.32 |
5 |
Pentedrone |
0.9904 |
0.9984 |
4.03 |
2.46 |
1.33 |
0.81 |
6 |
4-FEC |
0.9972 |
0.9939 |
1.37 |
1.52 |
0.45 |
0.50 |
7 |
3-MMC |
0.9926 |
0.9983 |
0.50 |
0.52 |
0.16 |
0.17 |
8 |
3-FMC |
0.9962 |
0.9925 |
2.20 |
2.09 |
0.73 |
0.69 |
9 |
3,4-DMMC |
0.9986 |
0.9987 |
0.45 |
0.55 |
0.15 |
0.18 |
10 |
2,3-MDMC |
0.9918 |
0.9946 |
0.82 |
0.91 |
0.27 |
0.30 |
11 |
Eutylone |
0.9967 |
0.9906 |
0.97 |
1.22 |
0.32 |
0.40 |
12 |
Buphedrone |
0.9940 |
0.9971 |
0.85 |
1.13 |
0.28 |
0.37 |
Table 4 Interday and intraday reproducibility results in terms of coefficient of variance for twelve cathinone related compounds spiked in urine at three different concentration levels for the two enantiomers (E1 & E2) of each compound
|
|
% CV intraday |
% CV interday |
20 ppm |
100 ppm |
200 ppm |
20 ppm |
100 ppm |
200 ppm |
E1 |
E1 |
E2 |
E1 |
E2 |
E1 |
E1 |
E1 |
E2 |
E1 |
E2 |
E1 |
1 |
Methedrone |
0.31 |
2.04 |
2.86 |
3.05 |
1.50 |
4.13 |
5.39 |
11.27 |
4.68 |
6.29 |
2.78 |
3.91 |
2 |
Pentylone |
0.88 |
4.07 |
4.54 |
4.30 |
4.81 |
1.31 |
9.75 |
4.18 |
6.03 |
4.30 |
3.64 |
3.45 |
3 |
4M-Buphedrone |
0.84 |
1.73 |
3.04 |
4.34 |
4.23 |
0.28 |
3.56 |
8.74 |
5.30 |
4.34 |
4.71 |
5.64 |
4 |
Ethcathinone |
1.07 |
3.79 |
2.16 |
3.95 |
5.06 |
3.15 |
3.90 |
9.91 |
1.49 |
3.95 |
4.36 |
2.77 |
5 |
Pentedrone |
2.26 |
1.43 |
3.86 |
3.09 |
2.29 |
3.67 |
11.07 |
2.94 |
6.21 |
3.09 |
5.44 |
4.74 |
6 |
4-FEC |
1.23 |
0.91 |
2.04 |
2.27 |
3.66 |
1.59 |
5.61 |
11.87 |
2.31 |
2.27 |
3.72 |
4.98 |
7 |
3-MMC |
0.61 |
1.95 |
2.75 |
6.70 |
3.88 |
3.60 |
5.16 |
6.94 |
4.00 |
6.70 |
4.40 |
2.68 |
8 |
3-FMC |
1.47 |
10.49 |
0.59 |
2.62 |
2.18 |
2.84 |
3.99 |
14.62 |
6.54 |
2.62 |
1.59 |
2.00 |
9 |
3,4-DMMC |
2.26 |
1.08 |
4.09 |
3.06 |
1.09 |
1.53 |
6.30 |
9.16 |
6.14 |
3.06 |
2.32 |
2.77 |
10 |
2,3-MDMC |
5.42 |
2.57 |
3.52 |
2.16 |
5.32 |
2.00 |
6.75 |
7.40 |
5.37 |
2.16 |
3.49 |
1.43 |
11 |
Eutylone |
3.18 |
2.76 |
5.71 |
5.42 |
3.68 |
2.65 |
4.79 |
8.96 |
3.86 |
5.42 |
4.65 |
3.72 |
12 |
Buphedrone |
1.19 |
1.22 |
3.68 |
3.70 |
5.60 |
4.92 |
5.50 |
12.31 |
3.92 |
3.70 |
4.44 |
3.90 |
Table 5 Interday and intraday reproducibility results in terms of coefficient of variance for twelve cathinone related compounds spiked in plasma at three different concentration levels for the two enantiomers (E1 & E2) of each compound
|
|
% CV intraday |
% CV interday |
20 ppm |
100 ppm |
200 ppm |
20 ppm |
100 ppm |
200 ppm |
E1 |
E1 |
E2 |
E1 |
E2 |
E1 |
E1 |
E1 |
E2 |
E1 |
E2 |
E1 |
1 |
Methedrone |
2.44 |
2.95 |
0.39 |
1.67 |
2.91 |
3.06 |
7.92 |
3.90 |
10.90 |
6.30 |
9.56 |
6.27 |
2 |
Pentylone |
2.98 |
0.58 |
0.80 |
0.99 |
1.86 |
3.48 |
13.20 |
8.92 |
4.88 |
13.01 |
5.80 |
4.58 |
3 |
4M-Buphedrone |
1.45 |
1.30 |
1.38 |
3.65 |
3.01 |
5.29 |
5.91 |
4.94 |
10.85 |
6.57 |
10.25 |
7.89 |
4 |
Ethcathinone |
4.30 |
7.57 |
12.48 |
12.26 |
6.46 |
8.77 |
5.77 |
8.97 |
11.21 |
14.42 |
4.66 |
7.75 |
5 |
Pentedrone |
1.35 |
0.48 |
6.20 |
2.20 |
4.70 |
3.21 |
5.77 |
3.06 |
12.27 |
1.97 |
6.64 |
9.59 |
6 |
4-FEC |
0.88 |
2.92 |
8.48 |
10.00 |
2.34 |
3.33 |
5.29 |
12.18 |
6.83 |
6.52 |
6.47 |
2.67 |
7 |
3-MMC |
1.53 |
1.92 |
6.39 |
8.48 |
5.06 |
9.23 |
3.96 |
6.82 |
9.42 |
13.33 |
12.01 |
12.04 |
8 |
3-FMC |
6.18 |
4.37 |
0.57 |
1.40 |
6.03 |
3.91 |
7.23 |
5.39 |
0.97 |
1.50 |
7.50 |
11.69 |
9 |
3,4-DMMC |
1.03 |
2.11 |
1.59 |
3.03 |
2.21 |
4.27 |
2.23 |
3.56 |
10.62 |
6.91 |
9.30 |
7.51 |
10 |
2,3-MDMC |
3.40 |
5.30 |
1.70 |
0.28 |
4.17 |
2.66 |
13.66 |
14.19 |
6.69 |
6.50 |
7.42 |
6.22 |
11 |
Eutylone |
1.62 |
3.21 |
2.59 |
2.01 |
1.73 |
3.20 |
12.12 |
3.33 |
11.24 |
10.72 |
7.35 |
5.37 |
12 |
Buphedrone |
2.21 |
5.30 |
7.77 |
9.18 |
2.04 |
3.71 |
2.46 |
9.81 |
5.27 |
12.69 |
8.18 |
5.70 |
Table 6 Recovery measurements expressed in percent errors for three different concentrations of the cathinone related compounds for the two enantiomers (E1 & E2) spiked in urine matrix at three concentration levels
|
|
Error% |
20 ppm |
100 ppm |
200 ppm |
E1 |
E2 |
E1 |
E2 |
E1 |
E2 |
1 |
Methedrone |
2.24 |
1.20 |
7.76 |
7.15 |
2.33 |
1.58 |
2 |
Pentylone |
4.69 |
13.26 |
2.97 |
5.09 |
0.23 |
0.36 |
3 |
4M-Buphedrone |
9.98 |
0.45 |
5.51 |
5.35 |
2.24 |
1.21 |
4 |
Ethcathinone |
4.56 |
9.91 |
9.88 |
11.85 |
2.38 |
2.43 |
5 |
Pentedrone |
5.87 |
17.72 |
14.01 |
15.14 |
3.10 |
3.30 |
6 |
4-FEC |
7.00 |
16.11 |
10.62 |
9.43 |
2.35 |
1.84 |
7 |
3-MMC |
2.93 |
0.51 |
10.23 |
4.06 |
2.69 |
0.45 |
8 |
3-FMC |
4.76 |
5.31 |
11.00 |
7.31 |
3.41 |
0.45 |
9 |
3,4-DMMC |
1.82 |
0.17 |
5.82 |
6.32 |
1.96 |
1.10 |
10 |
2,3-MDMC |
8.77 |
8.87 |
11.52 |
13.37 |
2.52 |
3.16 |
11 |
Eutylone |
8.11 |
9.13 |
4.02 |
4.32 |
1.14 |
0.30 |
12 |
Buphedrone |
4.69 |
12.12 |
9.00 |
7.50 |
2.44 |
1.26 |
Table 7 Recovery measurements expressed in percent errors for three different concentrations of the cathinone related compounds for the two enantiomers (E1 & E2) spiked in plasma matrix at three concentration levels
|
|
Error% |
20 ppm |
100 ppm |
200 ppm |
E1 |
E2 |
E1 |
E2 |
E1 |
E2 |
1 |
Methedrone |
18.51 |
10.36 |
11.90 |
9.11 |
2.08 |
2.90 |
2 |
Pentylone |
5.13 |
13.00 |
3.74 |
1.49 |
2.25 |
0.36 |
3 |
4M-Buphedrone |
7.82 |
3.64 |
1.46 |
0.91 |
0.80 |
0.41 |
4 |
Ethcathinone |
4.80 |
12.06 |
2.81 |
9.09 |
0.16 |
0.99 |
5 |
Pentedrone |
8.86 |
3.56 |
14.64 |
1.92 |
3.20 |
1.00 |
6 |
4-FEC |
7.81 |
6.40 |
2.67 |
4.26 |
0.17 |
0.25 |
7 |
3-MMC |
6.08 |
3.37 |
3.79 |
3.21 |
0.48 |
0.13 |
8 |
3-FMC |
4.05 |
0.49 |
4.49 |
9.54 |
1.79 |
2.96 |
9 |
3,4-DMMC |
16.67 |
2.88 |
3.25 |
4.02 |
0.70 |
1.24 |
10 |
2,3-MDMC |
23.71 |
13.90 |
9.79 |
9.05 |
2.04 |
2.44 |
11 |
Eutylone |
0.21 |
4.48 |
7.73 |
7.87 |
1.38 |
0.48 |
12 |
Buphedrone |
9.50 |
34.40 |
3.94 |
1.65 |
0.25 |
0.67 |
Discussion
L-TPC is one of the known chiral derivatizing agents (CDA) that can interact easily with primary and secondary amine of cathinone related drugs. It can react with the enantiomers and produces two corresponding diastereomers. The enantioseparation was possible due to the difference of stereochemistry and stability of the formed diastereoisomers on achiral stationary phase which led to different resolution of products.14,17 All cathinone related compounds in Table 1 have been derivatized by L-TPC where each one of them has formed a unique product after interacting with the derivatizing agent. Thirty one racemic mixtures of cathinone derivatives have been separated as their diastereoisomers, as shown in the example of methedrone in Fig. 1. Eighteen of them have been separated for the first time. Moreover, the enantioseparations that were obtained showed that the peak areas of some enantiomers were not equal and the reason of that according to Mohr8 is due to racemization of L-TPC during the derivatization reaction, kinetic resolution of the two enantiomers and the difference in diastereoisomers yields as a result of keto–enol tautomerization of the analytes. Interestingly, it was possible to separate 12 of these cathinone derivatives simultaneously in one chromatogram after spiking them in urine and plasma samples since they have a different retention times in the new developed method as it was observed in Fig. 2 and 3 respectively. Calibration curves of 12 selected cathinone derivatives in urine and plasma were constructed based on the diastereoisomers peak areas for the following concentrations: 5, 10, 20, 50, 100, 200 ppm. Fig. 4 shows the calibration graphs for methedrone enantiomers in plasma and urine sample matrices. One can see a good linearity of the four calibration lines in addition to high correlation coefficient (R2) values. In all these calibration measurements, nikethamide (50 ppm) was added to each sample in the quantitation step as an internal standard, due to its similar structure to cathinones and good stability. The R2 values of the constructed calibration curves for both enantiomers of 12 selected cathinone derivatives have been measured in spiked samples where most of them showed R2 value higher than 0.99 in most cases as shown in Tables 2 and 3. Moreover, the limits of detection (LOD) and limits of quantitation (LOQ) for these enantiomers were calculated according to the IUPAC method and reported in the Tables 2 and 3. The LOD in urine was in the range of 0.1–0.7 ppm and in plasma it was in the range of 0.17–1.33 ppm. The LOQ in urine was in the range of 0.29–2.14 ppm and in plasma it was in the range of 0.50–4.01 ppm.
The inter day and intraday reproducibility measurements of the twelve cathinone related compounds in urine and plasma were evaluated and reported at three different concentration levels in Tables 4 and 5. It was observed that the method has good reproducibility and repeatability, since most of the coefficient of variance values were below 5% in both urine and plasma matrices for measurements done on the same day or at two different days. Spiked urine samples were more reproducible than spiked plasma due to the competition between analyte and blood interferences unlike spiked urine samples where the dilution with deionized water took place.
Efficiency of solid phase extraction (SPE) and its effect on the method recovery has been studied by percent error calculations for the spiked mixture of the 12 cathinone related compounds in plasma and urine samples at the following concentration levels: 20, 100 and 200 ppm. Most of the values in recovery studies were within the acceptable range except some of them in spiked plasma sample. The reason is due to the inefficiency in the extraction method for plasma sample which were probably because of the presence of proteins and other interferences that can cause difficulty in solid phase extraction process.18 However, the spiked urine samples gave much better recovery results since they were diluted with deionized water twice.
Conclusion
It was possible to develop a sensitive and selective method for detection and quantitation of cathinone related compounds using GC-MS after indirect chiral derivatization with (S)-(−)-N-(trifluoroacetyl)pyrrolidine-2-carbonyl chloride (L-TPC). Thirty one compounds of synthetic cathinones were separated as their optical enantiomers successfully using a 60 m HP5-MS capillary column. Nikethamide was used as an internal standard in cathinones quantitation which has similar chemical structure to cathinones and showed good stability. Twelve cathinone derivatives were separated in one chromatogram simultaneously after spiking in urine and plasma sample. Calibration curves of twelve selected cathinone derivatives in urine were constructed including the following concentrations: 5, 10, 20, 50, 100, 200 ppm. Method validation in terms of recoveries, reproducibilities, linearities, LOD, and LOQ for all the tested compounds was also done. It was found that the LOD's of the 12 cathinone derivatives in urine was in the range of 0.1–0.7 ppm and in plasma it was in the range of 0.17–1.33 ppm. The LOQ's in urine was in the range of 0.29–2.14 ppm and in plasma it was in the range of 0.50–4.01 ppm.
Acknowledgements
The authors would like to thank General Department of Forensic Science and Criminology, Dubai Police for providing the cathinone related compound standards and the United Arab Emirates University for providing the financial support through fund numbers (31S117) and (31S102).
References
- A. M. Feyissa and J. P. Kelly, Prog. Neuro-Psychopharmacol. Biol. Psychiatry, 2008, 32, 1147–1166 CrossRef CAS PubMed.
- C. L. German, A. E. Fleckenstein and G. R. Hanson, Life Sci., 2014, 97, 2–8 CrossRef CAS PubMed.
- D. Wolrab, P. Frühauf, A. Moulisová, M. Kuchař, C. Gerner, W. Lindner and M. Kohout, J. Pharm. Biomed. Anal., 2016, 120, 306–315 CrossRef CAS PubMed.
- C. Boulanger-Gobeil, M. St-Onge, M. Laliberte and P. L. Auger, J. Med. Toxicol., 2012, 8, 59–61 CrossRef PubMed.
- S. Mohr, M. Taschwer and M. G. Schmid, Chirality, 2012, 24, 486–492 CrossRef CAS PubMed.
- L. J. De Felice, R. A. Glennon and S. S. Negus, Life Sci., 2014, 97, 20–26 CrossRef CAS PubMed.
- S. Mohr, S. Pilaj and M. G. Schmid, Electrophoresis, 2012, 33, 1624–1630 CrossRef CAS PubMed.
- S. Mohr, J. A. Weiß, J. Spreitz and M. G. Schmid, J. Chromatogr. A, 2012, 1269, 352–359 CrossRef CAS PubMed.
- Y. T. Iwata, T. Mikuma, K. Kuwayama, K. Tsujikawa, H. Miyaguchi, T. Kanamori and H. Inoue, Forensic Sci. Int., 2013, 226, 235–239 CrossRef CAS PubMed.
- T. Mikuma, Y. T. Iwata, H. Miyaguchi, K. Kuwayama, K. Tsujikawa, T. Kanamori and H. Inoue, Forensic Sci. Int., 2015, 249, 59–65 CrossRef CAS PubMed.
- M. N. Newmeyer, M. Concheiro and M. A. Huestis, J. Chromatogr. A, 2014, 1358, 68–74 CrossRef CAS PubMed.
- D. Albals, Y. V. Heyden, M. G. Schmid, B. Chankvetadze and D. Mangelings, J. Pharm. Biomed. Anal., 2016, 121, 232–243 CrossRef CAS PubMed.
- J. A. Weiss, S. Mohr and M. G. Schmid, Chirality, 2015, 27, 211–215 CrossRef CAS PubMed.
- J. M. Płotka, M. Biziuk and C. Morrison, TrAC, Trends Anal. Chem., 2011, 30, 1139–1158 CrossRef.
- G. Gubitz and M. G. Schmid, Mol. Biotechnol., 2006, 32, 159–180 CrossRef PubMed.
- A. E. Schwaninger, M. R. Meyer and H. H. Maurer, J. Chromatogr. A, 2012, 1269, 122–135 CrossRef CAS PubMed.
- T. Toyo'oka, J. Biochem. Biophys. Methods, 2002, 54, 25–56 CrossRef.
- S. L. Prabu and T. N. K. Suriyaprakash, Extraction of Drug from the Biological Matrix: A Review, INTECH Open Access Publisher, 2012 Search PubMed.
|
This journal is © The Royal Society of Chemistry 2016 |
Click here to see how this site uses Cookies. View our privacy policy here.