Yanbing Zhang,
Yuying Zheng*,
Xuehong Chen and
Binbin Fu
College of Materials Science and Engineering, Fuzhou University, Fuzhou 350108, People's Republic of China. E-mail: yyzheng@fzu.edu.cn
First published on 4th July 2016
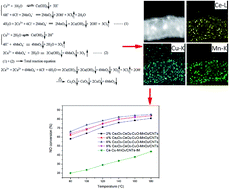
Ce2O3–CeO2–CuO–MnO2/CNTs catalysts were synthesized via a redox strategy, and presented 58–85% NO conversion at 80–180 °C. The 6% Ce2O3–CeO2–CuO–MnO2/CNTs catalyst displayed the optimal activity, which may be owing to the generation of amorphous mixed metal-oxide catalysts, and higher contents of Ce3+ and surface oxygen (Oy). The formation mechanism of the catalysts was proposed.
Carbon nanotubes (CNTs) are of interest as catalyst carriers due to their unique tubular structure, and remarkable physical and chemical performances. Previous studies reported that nitric oxides and ammonia could be adsorbed by CNTs.7 Besides, NO could be decomposed and reduced by CNTs.8 Therefore CNTs are considered as a promising candidate for catalyst supports. A series of CNTs-based catalysts have been prepared and used in the SCR reaction, such as TiO2@MnOx–CeOx/CNTs,9 MnOx/CNTs,10 CeO2/CNTs,11 and so on. Nevertheless, these catalysts still have one thing in common-high working temperature window of 200–300 °C, which will limit the application to after the desulfurizer and electrostatic precipitator. Hence, development of highly active SCR catalysts below 200 °C is of importance.
Previous studies reported that Cu-based catalysts, including CuOx-carbonaceous,12 Cu/MCM-41,13 and MnOx–Cu–CeO2,14 etc., exhibited better SCR activities. Nonetheless, high-temperature calcination method was usually used to prepare these catalysts, which was a little complicated. Therefore, it is essential to adopt a simple method for the fabrication of SCR catalyst. Based on the above issues, a mild redox method was firstly initiated to prepare Ce2O3–CeO2–CuO–MnO2/CNTs catalysts, and the catalysts presented outstanding low-temperature catalytic activities in SCR reactions.
Fig. 1 shows the NO conversion of the as-prepared catalysts. Compared to Ce–Cu–MnOx/CNTs-IM catalyst, the NO conversions over Ce2O3–CeO2–CuO–MnO2/CNTs catalysts were higher, and achieved 58.0–85.1% during the test temperature rang. It is noteworthy that 6% Ce2O3–CeO2–CuO–MnO2/CNTs catalyst attained the first-rate catalytic efficiency, which reached 66–85% at 80–180 °C at a weight hourly space velocity of 280000 mL gcat−1 h−1. The BET surface area (Table S1, ESI†) data indicates that the BET surface area over 6% Ce2O3–CeO2–CuO–MnO2/CNTs (45.2 m2 g−1) was smaller than that of over Ce–Cu–MnOx/CNTs-IM (70.7 m2 g−1), whereas its low-temperature SCR activity was the optimum among all samples, revealing that BET surface area was not a decisive factor for catalytic activity.15 Besides, the N2 adsorption–desorption and pore size distribution curves of the as-synthesized catalysts were listed in Fig. S1 (ESI†), these two kinds of catalysts all had a typical type IV isotherm together with a type-H4 loop, validating the formation of mesopore catalysts.16,17 Plus, the pore size distributions of the catalysts (inset of Fig. S1, ESI†) were between 2 and 10 nm, further demonstrating the generation of mesopore catalysts. For pore volume, the acid-treated CNTs present the largest pore volume. After being supported by mixed metal oxides catalysts, the pore volumes of the as-prepared catalysts generally declined until the loading was more than 8%. The above results may be ascribing to nano metal oxide catalysts entry into the pore of CNTs, and then the pore volumes were decreased. As for 8% Ce2O3–CeO2–CuO–MnO2/CNTs catalyst, its higher pore volume and BET surface area may be benefited from some bigger mesopores transformation into smaller mesopores, which was in good agreement with the result of Table S1.†
![]() | ||
Fig. 1 NO conversion versus temperature for the as-synthesized catalysts. Reaction conditions: [NO] = [NH3] = 420 ppm, [O2] = 5%, 150 mg catalyst, WHSV = 280![]() |
XRD patterns of CNTs-based samples were given in Fig. 2. Evidently, all CNTs-based samples display four diffraction peaks at 26.2°, 42.8°, 53.9°, and 77.9°, respectively, corresponding to the typical graphite peaks.18 It should be pointed out that only weak Ce2O3 peak (PDF#74-1145) could be observed in Ce2O3–CeO2–CuO–MnO2/CNTs catalysts until the loading was greater than or equal to 6%, while the diffraction peaks of CeO2, CuO, and MnO2 could not be detected, proving the generation of amorphous metal oxide catalysts. For Ce–Cu–MnOx/CNTs-IM catalyst, obvious CeO2 (PDF#89-8436), CuO (PDF#89-2529), and Mn3O4 (PDF#86-2337) peaks could be found, indicating the formation of high crystalline metal oxide catalysts. Compared to crystalline catalysts, amorphous catalysts were more conducive to the SCR reaction, which was in line with the conclusions of NO conversion.19
The morphologies of CNTs-based samples were investigated via FE-SEM. As shown in Fig. 3A, acid-treated CNTs had smooth external surface. However, they became coarse after being supported by catalysts (Fig. 3B), suggesting the formation of CNTs-based catalysts. Again, element mappings [Fig. 3D–H] could find the signals of Ce, Cu, Mn, C, and O elements, validating that it has generated Ce, Cu, and Mn mixed-metal oxide catalysts. Regarding Ce–Cu–MnOx/CNTs-IM catalyst (Fig. 3C), for one thing the catalysts were only partly anchored on CNTs, for another some aggregate catalysts dispersed among CNTs. It is known that agglomerate catalysts were bad for the SCR activity, which was in good agreement with the results of Fig. 1.
TEM, HR-TEM, and EDS were displayed in Fig. 4. For acid-treated CNTs (Fig. 4A), their surface were clear, while they became rough after being loaded by catalysts (Fig. 4B), confirming the generation of catalysts on CNTs. Furthermore, nanoflaky species corresponding to the catalysts could be observed at the edge of CNTs (Fig. 4C, HR-TEM), also validating the formation of catalysts on CNTs. Meanwhile, Ce, Cu, Mn, C, and O elements could be discovered in Fig. 4D (EDS spectrum), further evidencing the generation of Ce, Cu, and Mn mixed-metal oxide catalysts on CNTs, which were consistent with the conclusions of FE-SEM (Fig. 3). Moreover, apparent lattice fringe due to the metal oxide catalysts could not be found in HR-TEM, revealing that metal oxide catalysts with an amorphous phase have decorated on CNTs, which was in consistent with the results of XRD (Fig. 2). It is worthy to mention that amorphous catalysts were in favor of the SCR performance,20 which was in good accordance with the results of Fig. 1.
![]() | ||
Fig. 4 TEM images of (A) acid-treated CNTs, (B) 6% Ce2O3–CeO2–CuO–MnO2/CNTs, and (C) HR-TEM of (B), as well as (D) EDS spectrum from the circle region of (B). |
The STEM images and element mappings were adopted to further illustrate the morphologies of 6% Ce2O3–CeO2–CuO–MnO2/CNTs. It is clear from Fig. 5A that some bright spots dispersed on CNTs, validating the presence of heavy metal elements on CNTs. In addition, highly-dispersed bright dots could be observed clearly from the high-resolution STEM (Fig. 5B), also demonstrating the existence of heavy metal elements on CNTs. It is worth noting that cylindrical element distribution images corresponding to Mn, Ce, Cu, O, and C elements could be discovered from element mappings [Fig. 5C–K], further proving that Mn, Ce, and Cu mixed-metal oxide catalysts have been formed and well dispersed on CNTs, which was in line with the conclusions of FE-SEM and TEM.
![]() | ||
Fig. 5 (A and B) STEM images and (C–K) element mappings of 6% Ce2O3–CeO2–CuO–MnO2/CNTs (B coming from the red region of A). |
The valence states of metal oxide catalysts were evaluated by XPS and the results were displayed in Fig. 6. The XPS full spectrum of 6% Ce2O3–CeO2–CuO–MnO2/CNTs (Fig. 6A) presents the signals of Ce, Cu, Mn, C, and O elements, indicating the formation of Ce, Cu, and Mn mixed-metal oxide catalysts, which was in line with the results of FE-SEM, TEM, and STEM. For Mn 2p, the binding energies of 642.2 and 653.8 eV were indexed to Mn 2p3/2 and Mn 2p1/2, respectively, along with a energy separation of 11.6 eV, suggesting the formation of MnO2.21 It should be noted that MnO2 exhibited the optimum SCR activity among all manganese oxides,22 which was correlated with the conclusions of Fig. 1. As for Ce 3d spectra (Fig. 6C), the peaks of M2 and N2 corresponding to the electronic state of 3d104f1 was due to Ce3+ (Ce2O3), whereas other six peaks were owing to Ce4+ (CeO2),23 revealing the co-existence of Ce3+ and Ce4+. Moreover, Table S2 (ESI†) displays that the Ce3+/(Ce3+ + Ce4+) ratio over 6% Ce2O3–CeO2–CuO–MnO2/CNTs (0.162) was higher than that of over Ce–Cu–MnOx/CNTs-IM (0.138). And higher ratio of Ce3+/(Ce3+ + Ce4+) could lead to more unsaturated chemical bands and vacancies, and thereby, increase the content of chemisorbed oxygen,24 which was conducive to the catalytic activity.
![]() | ||
Fig. 6 XPS spectra of (A) full spectrum, (B) Mn 2p, (C-a) Ce 3d, (D) Cu 2p, (E) Cu auger, and (F-a) O 1s for 6% Ce2O3–CeO2–CuO–MnO2/CNTs; (C-b) and (F-b) for Ce–Cu–MnOx/CNTs-IM. |
Regarding Cu 2p (Fig. 6D), the binding energies at 954.6 and 934.6 eV was indexed to Cu 2p1/2 and Cu 2p3/2, respectively, together with two obvious satellites, indicating the formation of CuO.25 Furthermore, a energy gap of 20.0 eV was attributed to the Cu 2p1/2 and Cu 2p3/2, also revealing the presence of CuO.26 Meanwhile, the kinetic energy of Cu auger was 915.8 eV, further proving the generation of CuO.27 In the case of O 1s (Fig. 6F), it could be divided into three peaks. The peaks at around 529.4 eV were indexed to lattice oxygen (labeled as Ox), and the binding energies between 529.4 and 536.5 eV were assigned to surface oxygen (designated as Oy). Besides, the ratio of Oy/(Ox + Oy) (Table S2, ESI†) shows that 6% Ce2O3–CeO2–CuO–MnO2/CNTs (0.799) was higher than that of Ce–Cu–MnOx/CNTs-IM (0.773). And Oy possessed higher mobility, which was conducive to NO oxidation to NO2, and thus, could improve the SCR reaction.28 According to the XPS data, it could conclude the generation of Ce2O3–CeO2–CuO–MnO2/CNTs catalyst, which was correlated with the results of FE-SEM, TME, and STEM.
On the basis of XRD and XPS results, the Ce2O3, CeO2, CuO, and MnO2 have been formed in the preparation procedure of catalysts. Therefore, the formation mechanism of Ce2O3–CeO2–CuO–MnO2/CNTs catalysts was proposed as follows: Ce3+ and Cu2+ were firstly absorbed on CNTs owing to the electrostatic force between acid-treated CNTs and metal cations. Subsequently, CeCl3 and Cu(NO3)2 were partly hydrolyzed to Ce(OH)3, HCl, Cu(OH)2, and HNO3 on CNTs.29 Afterwards, Cl2 and O2 were generated due to the reaction of HCl and HNO3 with KMnO4, respectively, which would facilitate the hydrolyzation process. Meanwhile, KMnO4 was reduced to MnO2 on CNTs, and the Ce(OH)3–Cu(OH)2–MnO2/CNTs samples were successfully synthesized. Finally, the Ce2O3–CeO2–CuO–MnO2/CNTs catalysts could be obtained via a heating dehydration process.30,31 And the relevant reaction equations were given as follows:
![]() | (1) |
![]() | (2) |
Footnote |
† Electronic supplementary information (ESI) available: Experimental section, BET surface area, relative contents of Ce3+, Ce4+, Ox, and Oy, as well as N2 adsorption–desorption and pore size distribution. See DOI: 10.1039/c6ra10482g |
This journal is © The Royal Society of Chemistry 2016 |