Constant rate thermal analysis of a dehydrogenation reaction

Antonio Perejón*ab, Luis A. Pérez-Maqueda*a, Pedro E. Sánchez-Jiméneza, José M. Criadoa, Nataliya Murafac and Jan Subrtc
aInstituto de Ciencia de Materiales de Sevilla (C.S.I.C.-Univ. Sevilla), C. Américo Vespucio 49, Sevilla 41092, Spain. E-mail: antonio.perejon@icmse.csic.es; maqueda@cica.es; Fax: +34 95 446 01 65; Tel: +34 95 448 95 00 Tel: +34 95 448 95 48
bDepartamento de Química Inorgánica, Facultad de Química, Universidad de Sevilla, Sevilla 41071, Spain
cInstitute of Inorganic Chemistry AS CR, Vvi, 25068 Řež, Czech Republic

Received 19th April 2016 , Accepted 20th August 2016

First published on 22nd August 2016


Abstract

The Constant Rate Thermal Analysis (CRTA) procedure has been employed for the first time to study the kinetics of MgH2 dehydrogenation by thermogravimetry under high vacuum. CRTA implies controlling the temperature in such a way that the decomposition rate is maintained constant all over the process, employing the mass change as the experimental signal proportional to the reaction rate. The CRTA curves present a higher resolution power to discriminate the kinetic model obeyed by the reaction in comparison with conventional heating rate curves. The combined kinetic analysis has been applied to obtain the kinetic parameters, which show that MgH2 decomposition under high vacuum obeys first-order kinetics (F1). It has been proposed that the dehydrogenation of MgH2 under high vacuum takes place by instantaneous nucleation in the border line of the bidimensional crystallites followed by the growth of the nuclei.

1. Introduction

Solid-state hydrides, including metal, intermetallic and complex hydrides present the highest volumetric capacities of hydrogen storage, and have recently attracted interest for thermal energy storage applications.1–6 Among all the solid-state hydrides, Mg-based ones are the most studied family, due to the large hydrogen content of MgH2 (7.6 mass%), the high hydrogenation–dehydrogenation enthalpy and the ample abundance of magnesium in earth.7–11 Nevertheless, the kinetic and thermodynamic properties of Mg-based materials present several issues that have to be overcome for its use in practical applications. Magnesium needs temperatures above 573 K to absorb hydrogen, the dehydrogenation temperature of MgH2 is even higher because of its high thermodynamic stability, and finally, MgH2 presents a high reactivity towards air and oxygen.3,7,12,13 Desorption temperature has been reduced and the hydrogenation–dehydrogenation reactions have been fasten by mechanical milling and alloying, doping with catalytic additives and employing cycles of hydrogenation–dehydrogenation.11,14–19 However, the mechanism and kinetic parameters of these reactions, which are of the most interest for practical applications, have been less thoroughly studied.

Thermogravimetry is one of the most used techniques to study the kinetics of absorption and desorption of hydrogen from Mg related compounds.20–23 Authors normally employ conventional constant heating rate or isothermal experiments to collect the data. However, it has been demonstrated that constant rate thermal analysis (CRTA) presents a higher resolution power for the discrimination of the kinetic model followed by solid state reactions, because the shape of CRTA curves is related to the kinetic model.24,25 Moreover, it has been shown that CRTA allows minimizing the influence of both heat and mass transfer phenomena in solid state processes and, therefore, the experimental curves are representative of the reactions to be studied. For these reasons, it has been used for the kinetic study of different types of solid-state processes.26–28

CRTA implies controlling the temperature in such a way that the decomposition rate is maintained constant all over the process at a value previously selected by the user, employing an experimental signal proportional to the reaction rate or reaction fraction as control parameter.29,30 The objective of this work is the application of the CRTA methodology for the first time to study the dehydrogenation kinetics of MgH2 in conditions far from equilibrium. The combined kinetic analysis procedure will be used to obtain the kinetic parameters.

2. Experimental

Magnesium hydride was purchased from Aldrich, product number 683043. The samples were studied as received, no activation procedures were carried out to avoid possible modification of the samples.

A CI electronic thermobalance with a sensitivity of 2 × 10⁻⁷ g and a low thermal inertia furnace were used to perform the experiments. The instrument is connected to a high-vacuum system composed of a rotary and a turbomolecular pump which can reduce the pressure to ∼5 × 10⁻⁵ mbar.24 The system was outgassed overnight at room temperature to reach a steady-state. The sample size was ∼70 mg. The powders were weighted inside a glove-box and the instrument opened to place the samples and then immediately closed. Experiments were carried out in conventional linear heating rate conditions, at 2.5 K min−1 and in CRTA conditions, at reactions rates of 10−3 min−1 and 3 × 10⁻³ min−1, respectively. The CRTA control system is constituted by a Eurotherm programmer that received the analog output of the thermocouple and controls the temperature of the sample placed in the thermobalance, at the heating rate previously selected. A second programmer was employed for programming the profile of the analog output supplied by the thermobalance (the sample mass) as a function of the time. Thus, the control of the reaction rate is achieved by connecting the control relay of the second programmer to the digital input of the temperature programmer. CRTA control is carried out in such a way that the temperature increases if the output signal is higher than the programmed setpoint and decreases if it is lower that the setpoint.31 The reacted fraction or conversion, α, has been expressed with respect to the mass change using the equation:

 
image file: c6ra10157g-t1.tif(1)
where ω0 is the initial mass, ωf the final mass and ω the sample mass at an instant time t. The reaction rate is obtained differentiating the reacted fraction with respect to the time.

Temperature dependent X-ray diffraction patterns were recorded in vacuum in a Philips X'Pert Pro diffractometer equipped with a high temperature Anton Par camera working at 45 kV and 40 mA, using CuKα radiation and equipped with an X'Celerator detector and a graphite diffracted beam monochromator.

The microstructure of the starting MgH2 sample was analyzed by scanning electron microscopy (SEM) and high-resolution transmission electron microscopy (HRTEM). SEM micrographs were taken in a Hitachi S-4800 microscope, while HRTEM measurements were carried out using a 300 kV JEOL JEM 300 UHR electron microscope with a LaB6 electron source.

3. Theoretical

The kinetic analysis has been carried out from the following general kinetic equation:
 
image file: c6ra10157g-t2.tif(2)
where dα/dt is the reaction rate, A is the preexponential factor of Arrhenius, E is the activation energy, T is the absolute temperature and f(α) is a function representing the kinetic model obeyed by the reaction. If the αT (or αt) plot is obtained at a constant decomposition rate (C = dα/dt), eqn (2) can be rearranged, after taking logarithms, in the form:
 
image file: c6ra10157g-t3.tif(3)

It has been previously shown that CRTA permits to discriminate the kinetic model obeyed by the reaction from the analysis of a single αT plot, which is not possible if this plot is obtained from conventional rising temperature experiments.32,33 Fig. 1 presents αT curves simulated using the Runge–Kutta method and different kinetic models. Values of the activation energy of 150 kJ mol−1 and the pre-exponential factor of 5 × 10¹⁵ min−1 were employed for the simulation, and a constant reaction rate of 2 × 10⁻³ min−1. It is clear in the figure that the shape of the CRTA curves is different for each kinetic model. Thus, for reactions controlled by random nucleation and nuclei growth (like A2) the αT profile presents an initial increase in temperature and then it backs on itself until reaching a value of the reacted fraction at with the rise in temperature is resumed.


image file: c6ra10157g-f1.tif
Fig. 1 Reacted fraction versus temperature curves simulated for four kinetic models considering CRTA conditions (reaction rate of 2 × 10⁻³ min−1) and the following kinetic parameters: E = 150 kJ mol−1 and A = 5 × 10¹⁵ min−1.

On the other hand, the αT profiles for interphase boundary controlled reactions (like F1 and R3) are concave, and have a sigmoidal shape for reactions controlled by diffusion (like D3). Thus, the shape of the αT plots permits to have an idea of the kinetic model obeyed by the process before performing any numerical analysis.

The plot of the left hand side of eqn (3) as a function of 1/T leads to a straight line, whose slope leads to the activation energy and the intercept to the preexponential factor of the Arrhenius expression of the process, only in the case that the proper f(α) function were selected, except if the kinetic model were represented by the function f(α) = (1 − α)n (i.e. R2, R3 and F1 models, frequently referred as “n order” reactions). In such a case, eqn (3) becomes:

 
image file: c6ra10157g-t4.tif(4)
and E and n cannot be simultaneously determined from a single experiment unless one of these two parameters were known from other source.32

The combined kinetic analysis methodology allows determining the kinetic parameters without any assumptions regarding the kinetic model, which overcomes the problem of selecting a model from a list.34,35 The combined kinetic analysis determine the kinetic model by comparison of the shape of the resulting f(α) function with those of the ideal models, and therefore can be applied for studying real systems that could not be directly fitted with ideal models due, for example, to broad particle size distribution or heterogeneities in the sample. This method is based on taking logarithms to the general kinetic eqn (2). Rearranging terms in eqn (2) and considering f(α) as the Sestak–Berggren equation (f(α) = c(1 − α)nαm), the following expression is obtained:

 
image file: c6ra10157g-t5.tif(5)

This is a differential expression that does not require any integration of the kinetic equation that could provide some errors in the resulting kinetic parameters.36–38 The entire set of experimental data (T, α and dα/dt) corresponding to different temperature schedules are substituted into eqn (5) and the left-hand side of the equation versus the inverse of temperature is plotted. The values of the parameters n and m that provide the best linearity to the straight line obtained are determined by and optimization procedure. Then, the values of E and cA can be calculated from the slope and the intercept, respectively.

The main advantage of using the Sestak–Berggren equation is that is able to fit all the ideal kinetic models proposed in the literature including its deviations. Thus, the use of this equation does not limit the kinetic analysis to ideal models, and from the values of n and m the discrimination of the kinetic model is carried out using master plots.34

4. Results and discussion

Fig. 2 presents XRD patterns of MgH2 recorded under rotary pump vacuum (∼10−3 mbar) as a function of temperature (from 306 K to 567 K), in intervals of 9 K on stepwise heating, and in the 2θ range from 25° to 50°. As received sample at room temperature (306 K) is composed mainly by MgH2, with small reflections corresponding to metallic Mg. It is established in a literature review that during the synthesis of bulk micron sized particles a shell of magnesium hydride is formed that prevents the hydrogenation of the remaining metal core.1 For this reason, these micron sized particles generally contain an inner core with unreacted magnesium in the range of 5–10%.1 Moreover, even samples of magnesium hydride powders used for structural characterization have a core of unreacted magnesium.39 It is therefore reasonable to consider that the small amount of Mg present in the sample corresponds to unreacted metal and is not coming from the partial decomposition of MgH2 during its storage. Thus, for the kinetic calculations, we consider that α = 0 for the starting sample and α = 1 for the dehydrogenated material.
image file: c6ra10157g-f2.tif
Fig. 2 XRD patterns of MgH2 recorded in vacuum (∼10−3 mbar) as a function of temperature, from 306 K to 567 K.

The XRD patterns from room temperature to ∼459 K are essentially identical, indicating no reaction in this temperature range. From this temperature, the intensity of the MgH2 peaks decreases steadily, while the intensity of the Mg peaks increases in the temperature range 459–567 K. Thus, under these vacuum conditions (∼10−3 mbar) the decomposition of MgH2 starts at about 465 K.

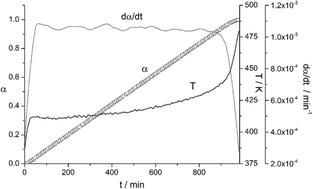
Fig. 3 shows the reacted fraction, temperature and reaction rate as a function of time obtained for the thermal decomposition of MgH2, registered at a constant decomposition rate of 10−3 of reacted fraction per minute and under vacuum at ∼5 × 10⁻⁵ mbar. The temperature rises until reaching the desired decomposition rate, and then the programmers force the instrument to change the temperature in such a way that the reacted fraction fits a straight line as a function of time. Therefore, the temperature follows a profile that depends on the kinetic model obeyed by the reaction.24


image file: c6ra10157g-f3.tif
Fig. 3 Experimental reacted fraction, temperature and reaction rate against time plots obtained for the thermal dehydrogenation of MgH2 in CRTA conditions, at a reaction rate of 10−3 min−1.

Fig. 4 presents the αT curves obtained from the thermogravimetric curves registered at ∼5 × 10⁻⁵ mbar in CRTA conditions (at 10−3 min−1 and 3 × 10⁻³ min−1) and in linear heating rate conditions (at 2.5 K min−1). The shapes displayed by the CRTA plots are characteristic of n order reactions.25,33,40


image file: c6ra10157g-f4.tif
Fig. 4 Experimental curves (dotted lines) corresponding to the thermal dehydrogenation of MgH2 at ∼5 × 10⁻⁵ mbar registered under CRTA conditions (at 10−3 min−1 and 3 × 10⁻³ min−1) and in linear heating rate conditions (at 2.5 K min−1). Solid lines represent the curves reconstructed assuming the kinetic parameters calculated by the combined analysis method. Residuals are plotted underneath the plots.

The curve registered under linear heating rate presents the characteristic sigmoidal shape that would be obtained whatever would be the kinetic model really obeyed by the reaction, and therefore it is not possible to discern the kinetic mechanism from the shape of this curve.

In order to determine the kinetic parameters associated to the thermal dehydrogenation of MgH2, i.e. activation energy, preexponential factor and kinetic model, the combined kinetic analysis was applied simultaneously to the three curves presented in Fig. 4. Thus, the values of (dα/dt)/(1 − α)nαm determined as a function of the temperature from these curves were substituted into eqn (5) and the left-hand side of the equation versus the inverse of temperature was plotted (Fig. 5a).


image file: c6ra10157g-f5.tif
Fig. 5 (a) Combined kinetic analysis plot of the CRTA curves and the linear heating rate curve presented in Fig. 4. (b) Comparison of the f(α) functions (lines) normalized at α = 0.5 corresponding to ideal kinetic models with the f(α) function resulting from the combined kinetic analysis of MgH2 dehydrogenation.

The optimization procedure described in the Theoretical section was applied, in such a way that the experimental curves are fitted simultaneously into a straight line (with correlation coefficient r2 = 0.996) when n and m take the values of 0.939 and 0.040 respectively. From the slope of the plot, the apparent activation energy of the process is 108 ± 6 kJ mol−1 and from the intercept, the preexponential factor is cA = 2.3 × 10¹⁰ min−1. The equation obtained from the analysis, f(α) = (1 − α)0.939α0.04, is very similar to that of an ideal first-order (F1) kinetics, i.e. f(α) = (1 − α), which suggests that the reaction obeys this kinetic model. This is agreement with the shape of the CRTA curves, which predicted n order kinetic mechanism. It is important to remark the high resolution power of CRTA for the discrimination between kinetic models of solid state reactions, as stated in the Theoretical section. The use of the CRTA procedure is not limited to first order reactions, but it can be employed independently of the kinetic model followed by the reaction, and for this reason has been used to study the kinetics of thermal decomposition of different materials.25,41–44 Moreover, this method has been successfully employed for the kinetic analysis of complex solid state reactions with overlapping processes, such as the thermal dehydrochlorination of poly(vinyl chloride) and the quantitative characterization of multicomponent polymers.27,45

The proposed kinetic mechanism was further checked by comparing the calculated f(α) with the most used conversion functions in literature,46 which are normalized at α = 0.5 to better distinguish between the different models (Fig. 5b). As expected, the curve is similar to the theoretical curve corresponding to first-order kinetics, with a small deviation at low α values.

The interpretation of the kinetic mechanism is supported by the morphology of the commercial sample of MgH2. The MgH2 particles are planar shaped as shown by the SEM micrographs in Fig. 6, and two populations of particle sizes seem to be present, one large and other small, which statistically correspond to a log-normal distribution, in agreement with samples summarized in ref. 1.


image file: c6ra10157g-f6.tif
Fig. 6 Scanning electron micrographs of particles of the starting MgH2 sample recorded at two magnifications: (a) ×500 and (b) ×1000.

Fig. 7 presents TEM micrographs of a small particle. The low resolution micrograph of the particle reveals that it presents a planar shape similar to that observed by SEM. Moreover, the particle is an aggregate composed of grains with an average size higher than 100 nm. The high resolution micrograph shows that the particle is constituted by elongated crystals welded in a mosaic structure. From the measurement of the lattice fringe spacing via a Fast Fourier Transform (FFT) of the HTREM image, the interplanar spacing of 0.251 nm was detected, corresponding to the (101) plane, as indicated in the figure.


image file: c6ra10157g-f7.tif
Fig. 7 Transmission electron micrographs of a starting MgH2 particle. (a) Low resolution micrograph and (b) high resolution micrograph.

The F1 kinetic model obtained from the kinetic analysis can be explained assuming that the process takes place by the formation and growth of nuclei (Avrami-Erofeev kinetic model), with an Avrami coefficient equal to 1 (A1), that gives an identical equation to that of first order. Thus, the dehydrogenation of MgH2 would be explained by assuming that the reaction takes place through a mechanism that implies instantaneous nucleation followed by a growth of nuclei by diffusion in two directions.47,48 The nucleation would take place in the border line of the crystallites and the magnesium particles would growth by diffusion into the bidimensional crystallites. Other alternative explanation would be possible if we take into account the broad log-normal distribution of the particle size of the starting sample (Fig. 6), because it was shown in a previous paper that the reactions controlled by the advance of the interphase (R2 or R3 kinetic models) move to F1 kinetic model as far as the particle size distribution is broadened.49

Different authors have correlated the morphology of MgH2 samples with their dehydrogenation properties. For example, the effect of mechanical milling on the structural and morphological characteristics of MgH2 has been extensively studied and associated with the hydrogen desorption temperature.11,50–53 The average particle size of the powders is reduced due to the milling process, and it is observed that desorption temperatures decrease when the powder particle size reaches some threshold value.50 Moreover, when the smallest particle size and the highest specific surface area are achieved, a minimum hydrogen temperature is also obtained.52 Other authors have prepared nanofibrous MgH2 by means of hydriding chemical vapor deposition.54 Interestingly, the material reversibly absorbed and desorbed 7.6 mass% of hydrogen without any activation treatment, retaining the fiber shape. The same method has also been used to prepare submicron MgH2 powders with needle-like and angulated plate shapes with reduced particle size, resulting in a decrease of the desorption temperature.55 The thermal hydrogenolysis method has been employed to prepare MgH2 with different morphologies.56 Thus, as the synthesis medium evolved from inert atmosphere of argon to hydrogen pressure, the morphology changed from rod like to small particles, with sizes in the range of 25–170 nm. Hydrogen release took place at fast desorption rates.

The kinetic parameters obtained from the combined kinetic analysis were tested simulating the CRTA curves and the curve registered at 2.5 K min−1 heating rate, assuming such kinetic parameters. The simulations were carried out by numerical integration of the general kinetic equation and using fourth-order numerical integration Runge–Kutta method. It is clear in Fig. 4 that the simulated and experimental curves almost perfectly match, which is confirmed with the low values obtained for the residuals, plotted underneath the figure. This result validates the kinetic parameters obtained by the combined kinetic analysis. The value obtained for the activation energy (108 ± 6 kJ mol−1) is in the same range of that reported by other authors for MgH2 samples with a similar morphology, that are ranging from 100 kJ mol−1 to 170 kJ mol−1.1,51,57–60 However, it must be remarked that a careful control of the hydrogen pressure in the close vicinity of the sample was not carried out in the previous works. Moreover, in many cases the kinetics was studied in a Sievert-type apparatus without considering the influence of hydrogen pressure in the overall decomposition, but the dehydrogenation of MgH2 is a reversible reaction. On the other hand, the activation energies were calculated by previously assuming a given kinetic model, and it has been shown that the value of this parameter might strongly depend on the kinetic model previously assumed.34,61,62 The results here reported have been obtained under high vacuum in order to assure that the dehydrogenation of magnesium hydride is taking place very far from equilibrium and thus the activation energy obtained is representative of the forward reaction. Besides, the kinetic parameters have been obtained without any previous assumption of the kinetic model obeyed by the reaction.

5. Conclusions

Constant rate thermal analysis procedure has been applied to the thermal dehydrogenation of MgH2 under high vacuum for the first time. The higher resolution power of the CRTA curves for discriminating the kinetic model obeyed by the reaction has been proven in comparison with conventional heating rate curves. The combined kinetic analysis, which allows calculating the kinetic parameters without any assumption about the kinetic model followed by the reaction, has been applied to the curves registered under CRTA conditions together with a curve registered under linear heating rate conditions, and the validity of the kinetic parameters obtained has been checked comparing the experimental curves with simulated curves. The thermal dehydrogenation of MgH2 under high vacuum follows first-order kinetics (F1) with activation energy of 108 kJ mol−1. These results have been interpreted taking into account the planar morphology of the starting MgH2 particles and crystallites, according to SEM and TEM micrographs. Thus, in high vacuum, the dehydrogenation of MgH2 would take place through instantaneous nucleation in the border line of the crystallites followed by growth of the magnesium particles by diffusion into the bidimensional crystallites. An alternative explanation of the kinetic mechanism, based on the broad particle size distribution of the MgH2 particles, would be also plausible.

Acknowledgements

The support from projects CTQ2014-52763-C2-1-R (MINECO-FEDER), TEP-7858 (Junta Andalucía-FEDER) and TEP-1900 (Junta Andalucía-FEDER) is acknowledged. The authors also thank VPPI-US for the AP current contract. Additionally, one of the authors (PESJ) is supported by a Marie Curie-Junta de Andalucía Talentia grant.

References

  1. R. A. Varin, T. Czujko and Z. S. Wronski, Nanomaterials for Solid State Hydrogen Storage, Springer Science+Business Media, New York, 2009 Search PubMed.
  2. A. Zuttel, Naturwissenschaften, 2004, 91, 157–172 CrossRef PubMed.
  3. B. Sakintuna, F. Lamari-Darkrim and M. Hirscher, Int. J. Hydrogen Energy, 2007, 32, 1121–1140 CrossRef CAS.
  4. C. Corgnale, B. Hardy, T. Motyka, R. Zidan, J. Teprovich and B. Peters, Renewable Sustainable Energy Rev., 2014, 38, 821–833 CrossRef CAS.
  5. M. Felderhoff and B. Bogdanovic, Int. J. Mol. Sci., 2009, 10, 325–344 CrossRef CAS PubMed.
  6. D. A. Sheppard, C. Corgnale, B. Hardy, T. Motyka, R. Zidan, M. Paskevicius and C. E. Buckley, RSC Adv., 2014, 4, 26552–26562 RSC.
  7. B. Bogdanovic, K. Bohmhammel, B. Christ, A. Reiser, K. Schlichte, R. Vehlen and U. Wolf, J. Alloys Compd., 1999, 282, 84–92 CrossRef CAS.
  8. B. Bogdanovic, T. H. Hartwig and B. Spliethoff, Int. J. Hydrogen Energy, 1993, 18, 575–589 CrossRef CAS.
  9. A. Reiser, B. Bogdanovic and K. Schlichte, Int. J. Hydrogen Energy, 2000, 25, 425–430 CrossRef CAS.
  10. H. Shao, G. Xin, J. Zheng, X. Li and E. Akiba, Nano Energy, 2012, 1, 590–601 CrossRef CAS.
  11. A. Zaluska, L. Zaluski and J. O. Strom-Olsen, J. Alloys Compd., 1999, 288, 217–225 CrossRef CAS.
  12. W. Grochala and P. P. Edwards, Chem. Rev., 2004, 104, 1283–1315 CrossRef CAS PubMed.
  13. H. Imamura, K. Masanari, M. Kusuhara, H. Katsumoto, T. Sumi and Y. Sakata, J. Alloys Compd., 2005, 386, 211–216 CrossRef CAS.
  14. J. Huot, G. Liang, S. Boily, A. Van Neste and R. Schulz, J. Alloys Compd., 1999, 293, 495–500 CrossRef.
  15. G. Barkhordarian, T. Klassen and R. Bormann, Scr. Mater., 2003, 49, 213–217 CrossRef CAS.
  16. Y. Kodera, N. Yamasaki, T. Yamamoto, T. Kawasaki, M. Ohyanagi and Z. A. Munir, J. Alloys Compd., 2007, 446, 138–141 CrossRef.
  17. X. Liu, Y. Zhu and L. Li, J. Alloys Compd., 2006, 425, 235–238 CrossRef CAS.
  18. N. Juahir, N. S. Mustafa, A. M. Sinin and M. Ismail, RSC Adv., 2015, 5, 60983–60989 RSC.
  19. M. Ismail, Y. Zhao, X. B. Yu and S. X. Dou, RSC Adv., 2011, 1, 408–414 RSC.
  20. R. Campostrini, M. Abdellatief, M. Leoni and P. Scardi, J. Therm. Anal. Calorim., 2014, 116, 225–240 CrossRef CAS.
  21. F. C. Gennari, F. J. Castro and G. Urretavizcaya, J. Alloys Compd., 2001, 321, 46–53 CrossRef CAS.
  22. C. X. Shang and Z. X. Guo, Int. J. Hydrogen Energy, 2007, 32, 2920–2925 CrossRef CAS.
  23. D. Fatay, A. Revesz and T. Spassov, J. Alloys Compd., 2005, 399, 237–241 CrossRef CAS.
  24. L. A. Perez-Maqueda, J. M. Criado and F. J. Gotor, Int. J. Chem. Kinet., 2002, 34, 184–192 CrossRef CAS.
  25. P. E. Sanchez-Jimenez, L. A. Perez-Maqueda, A. Perejon and J. M. Criado, Polym. Degrad. Stab., 2011, 96, 974–981 CrossRef CAS.
  26. L. A. Perez-Maqueda, J. M. Criado, J. Subrt and C. Real, Catal. Lett., 1999, 60, 151–156 CrossRef CAS.
  27. P. E. Sanchez-Jimenez, A. Perejon, J. M. Criado, M. J. Dianez and L. A. Perez-Maqueda, Polymer, 2010, 51, 3998–4007 CrossRef CAS.
  28. L. A. Perez-Maqueda, J. M. Criado, P. E. Sanchez-Jimenez and M. J. Dianez, J. Therm. Anal. Calorim., 2015, 120, 45–51 CrossRef CAS.
  29. J. Rouquerol, J. Therm. Anal. Calorim., 2003, 72, 1081–1086 CrossRef CAS.
  30. J. Rouquerol, F. Rouquerol and M. Ganteaume, J. Catal., 1979, 57, 222–230 CrossRef CAS.
  31. J. M. Criado, L. A. Perez-Maqueda, M. J. Dianez and P. E. Sanchez-Jimenez, J. Therm. Anal. Calorim., 2007, 87, 297–300 CrossRef CAS.
  32. J. M. Criado and L. A. Pérez-Maqueda, in Sample Controlled Thermal Analysis: Origin, Goals, Multiple Forms, Applications and Future, ed. O. T. Sørensen and J. Rouquerol, Springer, US, Boston, MA, 2003, pp. 62–101 Search PubMed.
  33. J. M. Criado, A. Ortega and F. Gotor, Thermochim. Acta, 1990, 157, 171–179 CrossRef CAS.
  34. L. A. Perez-Maqueda, J. M. Criado and P. E. Sanchez-Jimenez, J. Phys. Chem. A, 2006, 110, 12456–12462 CrossRef CAS PubMed.
  35. P. E. Sanchez-Jimenez, L. A. Perez-Maqueda, A. Perejon and J. M. Criado, Polym. Degrad. Stab., 2009, 94, 2079–2085 CrossRef CAS.
  36. A. Ortega, L. A. Perez-Maqueda and J. M. Criado, Thermochim. Acta, 1996, 283, 29–34 CrossRef.
  37. L. A. Perez-Maqueda, P. E. Sanchez-Jimenez and J. M. Criado, Int. J. Chem. Kinet., 2005, 37, 658–666 CrossRef CAS.
  38. L. A. Perez-Maqueda, P. E. Sanchez-Jimenez and J. M. Criado, Polymer, 2005, 46, 2950–2954 CrossRef CAS.
  39. T. Noritake, S. Towata, M. Aoki, Y. Seno, Y. Hirose, E. Nishibori, M. Takata and M. Sakata, J. Alloys Compd., 2003, 356, 84–86 CrossRef.
  40. J. M. Criado and L. A. Perez-Maqueda, J. Therm. Anal. Calorim., 2005, 80, 27–33 CrossRef CAS.
  41. N. Koga and J. M. Criado, Int. J. Chem. Kinet., 1998, 30, 737–744 CrossRef CAS.
  42. P. E. Sanchez-Jimenez, L. A. Perez-Maqueda, A. Perejon and J. M. Criado, J. Phys. Chem. C, 2012, 116, 11797–11807 CAS.
  43. T. Kimura and N. Koga, J. Phys. Chem. A, 2011, 115, 10491–10501 CrossRef CAS PubMed.
  44. H. Ogasawara and N. Koga, J. Phys. Chem. A, 2014, 118, 2401–2412 CrossRef CAS PubMed.
  45. P. E. Sanchez-Jimenez, L. A. Perez-Maqueda, J. E. Crespo-Amoros, J. Lopez, A. Perejon and J. M. Criado, Anal. Chem., 2010, 82, 8875–8880 CrossRef CAS PubMed.
  46. A. Khawam and D. R. Flanagan, J. Phys. Chem. B, 2006, 110, 17315–17328 CrossRef CAS PubMed.
  47. L. A. Perez-Maqueda, J. M. Criado and J. Malek, J. Non-Cryst. Solids, 2003, 320, 84–91 CrossRef CAS.
  48. M. Pijolat and M. Soustelle, Thermochim. Acta, 2008, 478, 34–40 CrossRef CAS.
  49. N. Koga and J. M. Criado, J. Am. Ceram. Soc., 1998, 81, 2901–2909 CrossRef CAS.
  50. R. A. Varin, T. Czujko, C. Chiu and Z. Wronski, J. Alloys Compd., 2006, 424, 356–364 CrossRef CAS.
  51. R. A. Varin, T. Czujko and Z. Wronski, Nanotechnology, 2006, 17, 3856 CrossRef CAS.
  52. H. Gasan, N. Aydinbeyli, O. N. Celik and Y. M. Yaman, J. Alloys Compd., 2009, 487, 724–729 CrossRef CAS.
  53. N. Hanada, T. Ichikawa, S.-I. Orimo and H. Fujii, J. Alloys Compd., 2004, 366, 269–273 CrossRef CAS.
  54. I. Saita, T. Toshima, S. Tanda and T. Akiyama, J. Alloys Compd., 2007, 446–447, 80–83 CrossRef CAS.
  55. J.-H. Kim, B.-G. Kim and Y.-M. Kang, J. Alloys Compd., 2012, 529, 102–107 CrossRef CAS.
  56. E. J. Setijadi, C. Boyer and K.-F. Aguey-Zinsou, Int. J. Hydrogen Energy, 2013, 38, 5746–5757 CrossRef CAS.
  57. G. Barkhordarian, T. Klassen and R. Bormann, J. Alloys Compd., 2006, 407, 249–255 CrossRef CAS.
  58. K. Bohmhammel, B. Christ and G. Wolf, Thermochim. Acta, 1998, 310, 167–171 CrossRef CAS.
  59. J. F. Fernandez and C. R. Sanchez, J. Alloys Compd., 2003, 356, 348–352 CrossRef.
  60. C. M. Stander, J. Inorg. Nucl. Chem., 1977, 39, 221–223 CrossRef CAS.
  61. P. E. Sanchez-Jimenez, L. A. Perez-Maqueda, A. Perejon and J. M. Criado, Resour., Conserv. Recycl., 2013, 74, 75–81 CrossRef.
  62. J. M. Criado and A. Ortega, J. Therm. Anal., 1984, 29, 1225–1236 CAS.

This journal is © The Royal Society of Chemistry 2016
Click here to see how this site uses Cookies. View our privacy policy here.