Deposition of silver nanoparticles onto two dimensional BiOCl nanodiscs for enhanced visible light photocatalytic and biocidal activities

Wenyu Zhuab, Zhong Lic, Yan Zhou*ab and Xiaoli Yan§ *a
aSchool of Civil and Environmental Engineering, Nanyang Technological University, 50 Nanyang Avenue, Singapore 639798, Republic of Singapore. E-mail: zhouyan@ntu.edu.sg; xlyan@ntu.edu.sg; yan_xiaoli@np.edu.sg
bNanyang Environment and Water Research Institute (NEWRI), Nanyang Technological University, 1 Cleantech Loop, CleanTech One, Singapore 637141, Republic of Singapore
cSchool of Mechanical and Aerospace Engineering, Nanyang Technological University, 50 Nanyang Avenue, Singapore 639798, Republic of Singapore

Received 18th April 2016 , Accepted 25th June 2016

First published on 28th June 2016


Abstract

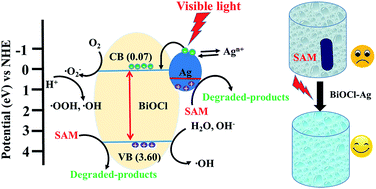
Two dimensional (2D) BiOCl nanodiscs were synthesized as a photocatalyst by a one-step solvothermal method. To enhance its photocatalytic activity, Ag nanoparticles (Ag NPs) were deposited on the surface of BiOCl to form BiOCl–Ag heterostructured nanocomposites. Synthesized samples were characterized by X-ray diffraction (XRD), Raman spectroscopy, scanning electron microscopy (SEM), transmission electron microscopy (TEM), X-ray photoelectron spectroscopy (XPS), photoluminescence (PL) spectroscopy and UV-vis absorption spectroscopy. Sulfanilamide (SAM) was chosen as a model chemical to evaluate the photocatalytic performance of both materials under visible irradiation. Results show that the photo-degradation efficiency of SAM was improved to 82.4% using BiOCl–Ag as compared to pristine BiOCl, indicating Ag deposition is an effective way to augment the photocatalytic activity of BiOCl. As an excellent antibacterial agent, Ag, on the other hand, may enhance the biocidal capability of BiOCl. Taking E. coli and B. subtilis as target bacteria, though BiOCl displayed certain antibacterial function under visible light irradiation (2[thin space (1/6-em)]log reduction), BiOCl–Ag was demonstrated to have a significantly higher efficiency with 100% bactericidal rate. This study shows that Ag modified BiOCl nanodiscs can be a promising material in the application of disinfection as well as degradation of sulfonamide derived antibiotics.

1. Introduction

Antibiotics have been widely used all over the world. Due to the high consumption, antibiotics as well as their residues can easily find their way into the environment.1–6 Abuse and uncontrolled usage of antibiotics can contaminate aquatic environments, which is now one of the most concerning environmental issues. Though the concentration of antibiotics and their residues in aquatic environments is usually low, they can cause the appearance of microbial and gene resistance.7,8 Moreover, they are generally recalcitrant to the biological treatment process. Recently, advanced oxidation processes (AOPs) have been extensively studied to enhance the removal efficiency of molecules like antibiotics from water sources.9–11 In particular, photocatalytic process based on semiconductors within nano-scale is regarded as an efficient technology in degrading a wide range of organic pollutants. In addition, many of the nano-scale semiconductors are efficient biocidal materials which can widen their potential application to disinfection. More importantly, the driving force of photocatalytic process comes from solar energy which makes it economic and effective.

An efficient photocatalyst is supposed to possess several properties, such as using photons in the UV-vis region of the solar spectrum, having surface electronic structure tailored to ensure the half-reactions being thermodynamically feasible, achieving facile separation of electron and hole pairs, and supplying surface sites with low activation barrier for high catalytic activity.12 However, many semiconductor photocatalysts, including TiO2, possess wide band gaps, limiting their capability in absorbing and utilizing visible light in the solar spectrum. To improve the photocatalytic efficiency, fabrication of multifunctional heterogeneous catalysts is a widely used approach. For instance, decorating semiconductors with metal nanoparticles is suggested to be an effective way to decrease charge carrier recombination rate during the photocatalytic process.13 Among various metals, noble metals (e.g. Pt, Au, and Ag) are broadly used due to their noble and/or catalytic characteristics.14 Such noble metals, as co-catalysts in heterogeneous photocatalysts, may serve as electron sinks/reservoirs which can separate electron–hole pairs more effectively and in turn to supply more active sites for the reduction reaction during photocatalytic process.14

BiOCl, a typical p-type semiconductor with tetragonal crystal structure, has unique optical, electrical and catalytic properties, making it a promising candidate as catalyst, ferroelectric material and pigment.15 Though many studies have reported the successful synthesis of BiOCl with three-dimensional (3D) hierarchitectures through various methods,16–23 the synthesis of BiOCl with well-defined two dimensional (2D) morphologies and well-crystallized nanostructures is still a challenge.24,25 Compared with 3D structures, 2D BiOCl nanostructures have drawn great attention due to their high specific surface areas, more uncoordinated surface atoms, and excellent optical and catalytic properties.24,26 More importantly, BiOCl with 2D nanostructures may have potential application as building blocks used in advanced materials and devices.25

BiOCl cannot work as efficient photocatalyst due to several limitations. Firstly, BiOCl has a wide band gap value of 3.19–3.44 eV,27 which limits its photo-absorption in the UV region. Another limitation is the high recombination rate of photo-induced electron–hole pairs at or near the surface which leads to a low overall quantum efficiency during photocatalytic reaction.28 To improve the photocatalytic performance of BiOCl, direct combination with co-catalyst nanoparticles like Ag, Au, Pt and other metals have been investigated in several studies. However, in these studies, BiOCl used usually had a 3D structure,29–36 and the synthesis of 2D BiOCl is still challenging. Therefore, it is necessary to explore new environmental friendly and cost effective approaches to manufacture 2D BiOCl and further fabricate their co-catalyst heterogeneous composites with high yield and well-crystallized structure which could be used as efficient photocatalysts.

In this study, we developed a modified one-step solvothermal process to prepare 2D BiOCl based on the methods of Yang et al. (2013) and Cheng et al. (2015) for 3D BiOCl synthesis. Ag nanoparticles (Ag NPs) were adopted as co-catalyst and deposited on the surface of BiOCl by photo-reduction method to enhance its photocatalysis efficiency. Sulfanilamide (SAM), a commonly used antibiotics and growth promoter was chosen as the target pollutant to evaluate the photocatalytic ability of BiOCl and BiOCl–Ag composites.37 On the other hand, Ag is a well-known effective biocidal agent which has been used for a long history.38–42 However, Ag NPs tend to aggregate together in water resulting in the large detriment of its antibacterial efficiency since less surface area would be exposed to the bacterial cells.43–45 Therefore, this study further explored the function of 2D BiOCl as supporter to allow proper dispersion of Ag NPs on its surface. The antibacterial performance of BiOCl as well as its Ag composites was investigated using E. coli and B. subtilis as model bacteria.

2. Materials and methods

2.1 Materials

Bismuth nitrate pentahydrate Bi(NO3)3·5H2O, tungsten hexachloride (WCl6), silver nitrate (AgNO3), ethylene glycol ((CH2OH)2, EG), urea (CO(NH2)2), ethanol, sulfanilamide (SAM), methanol, benzoquinone (BQ) and dimethyl sulfoxide (DMSO) were purchased from Sigma Aldrich. All chemicals were analytical-grade reagents, and no further purification was required during the material preparation process.

2.2 Photocatalysts preparation

2.2.1 Synthesis of BiOCl nanodiscs. BiOCl nanodiscs were synthesized by a modified one-step facile solvothermal method. Briefly, 1 mmol WCl6 and 1 mmol Bi(NO3)3·5H2O were separately dissolved in 15 mL EG before mixing together to form a uniform light green solution. Then, 6 mmol urea was dissolved into the mixed solution. The mixture was transferred into a 45 mL Teflon-lined stainless steel autoclave and heated at 120 °C for 4 h. After cooling down to ambient temperature, the resulting white product was collected, centrifuged and washed by ethanol and distilled water for several times and finally dried by a vacuum freeze drier for further modification or use.
2.2.2 Synthesis of Ag-doped BiOCl (BiOCl–Ag) composites. Ag doped BiOCl composites were produced by photo-reduction method. Briefly, 260 mg as-prepared BiOCl sample was evenly dispersed in 80 mL distilled water, and then 20 mL AgNO3 solution (0.05 mmol L−1) was slowly added with continuous stirring. The mixture was irradiated by a 200 W solar simulator (NEWPORT, USA) simulating AM 1.5 spectrum through a UV cut off filter (λ < 420 nm) for 2 h. After irradiation, the product was collected, centrifuged and washed by ethanol and distilled water for several times. Finally, the product was dried by a vacuum freeze drier.

2.3 Characterization of catalysts

The obtained products were characterized by X-ray powder diffraction (XRD) using a D8-Advance Bruker-AXS diffractometer with Cu Kα irradiation operated at 40 kV and 30 mA. The morphology of the samples was observed by a field-emission scanning electron microscope (FESEM) equipped with an energy dispersive X-ray spectrometer (EDS) of JOEL 6340 operated at 5 kV. Transmission electron microscopy (TEM) and high-resolution TEM (HRTEM) were also applied with a JEOL 2010 microscope operated at 300 kV. Brunauer–Emmett–Teller (BET) surface area measurements were performed on a Quantachrome AUTOSORB sorption analyzer. X-ray photoelectron spectra (XPS) were measured by a Kratos Axis Ultra Spectrometer with a monochromic Al Kα source at 1486.7 eV, using an operating voltage of 15 kV and an emission current of 10 mA. UV-vis diffuse reflectance spectra of the powder samples were obtained with a Shimadzu UV-2600 UV-vis spectrophotometer. Photoluminescence spectra (PL) were recorded with a PerkinElmer LS 55 Fluorescence spectrometer at 315 nm. Raman spectra were collected by a Renishaw inVia Raman microscope with the excitation wavelength of 514.5 nm.

2.4 Photocatalytic activity test: degradation of SAM

Photocatalytic activity of BiOCl and BiOCl–Ag composites was evaluated by the degradation of Sulfonamides (SAM) using a 1.5 AM solar simulator (NEWPORT, USA) with a 200 W Xe arc lamp. Dichroic mirrors were utilized to control wavebands in the specific range of 420–630 nm (visible light). In order to remove the UV residual, a polycarbonate filter was applied. Under dark condition, 50 mL suspension with photocatalyst dosage of 1.0 g L−1 and the initial SAM concentration of 10 mg L−1 was prepared and was then continuously stirred for one hour to reach the adsorption equilibrium. The photocatalytic test was started by switching on the solar simulator. At certain time intervals, 3 mL sample aliquots were collected and immediately filtered through 0.45 μm cellulose acetate syringe membrane filters. The concentration of SAM was measured by high performance liquid chromatography (HPLC) with a Spherisorb ODS-2 column (150 mm × 4.6 mm I.D., 5 μm) and an SPD-M20A diode array detector (DAD) using a Shimadzu LC system (LC-20AD). Ag ions (Ag+) leaching from BiOCl–Ag composites during the photocatalytic reaction was determined by MP-OES (Agilent Technologies 4100).

2.5 Antibacterial activity

Antibacterial ability of BiOCl and BiOCl–Ag against E. coli (ATCC 8739) and B. subtilis (ATCC 6633) was investigated under visible light irradiation. All glass apparatuses were autoclaved at 121 °C for 20 min before usage. The biocidal effect was evaluated by spread-plate method.46 E. coli and B. subtilis were firstly incubated in liquid Luria–Bertani (LB) nutrient medium at 37 °C for 20 h with continuous shaking at 200 rpm. The bacterial suspensions were then harvested and washed with 0.85% NaCl solution twice. The bacterial cells were re-suspended in 0.85% NaCl solution and the cell density was adjusted to about 3 × 10⁷ colony forming units per milliliter (cfu mL−1). After that, 50 mg catalyst was then added with a final concentration of 1.0 g L−1. At certain intervals, 2 mL of reaction mixture was sampled and immediately diluted with 0.85% NaCl solution. After appropriate dilution, 100 μL of sample was spread on LB agar medium and incubated at 37 °C for 18 h. The number of colonies formed on the medium was carefully counted to determine the number of viable cells. The mixtures of bacterial cells and photocatalyst samples without light irradiation were prepared as control. All the above experiments were conducted in triplicates.

3. Results and discussion

3.1 Characterization of BiOCl and BiOCl–Ag

To study the phase purity and crystal structure of BiOCl before and after Ag loading, XRD was applied and the results are displayed in Fig. 1. All the detectable peaks from pure BiOCl were well indexed to the JCPDS card no. 06-0249. No other peak was observed in this pattern, indicating that BiOCl produced was of high purity. Additionally, the sharp diffraction peaks observed implies the good crystallinity of BiOCl. Similar XRD pattern was obtained after Ag was loaded on BiOCl, except that an additional peak related to metallic Ag located at 38.2° matching with (111) planes of the face-centered cubic structure Ag (JCPDS no. 04-0783) appeared. This indicates that the introduction of Ag NPs would not damage the crystal structure of BiOCl.
image file: c6ra09964e-f1.tif
Fig. 1 XRD patterns of BiOCl and BiOCl–Ag.

The shape and morphology of the as-synthesized BiOCl were firstly observed by FESEM where the synthesized BiOCl consisted of homogeneous, disc-like shaped structures with an average size of 100 to 300 nm and a thickness of ~20 nm as shown in Fig. 2(a). EDX result (Fig. S3) reveals that the product only contained the elements of Bi, O and Cl, confirming that the product was pure BiOCl. In the studies of Yang et al. (2013) and Cheng et al. (2015),47,48 though they also used Bi(NO3)3·5H2O, WCl6 and urea as precursors, their products were 3D flower-like BiOCl, Bi2WO6 and BiOCl–Bi2WO6 hierarchitectures rather than pure 2D BiOCl. Here, we manipulated the ratio of precursors to successfully prepared pure BiOCl (BET surface area: 6.54 m2 g−1, Fig. S5) with well-defined 2D disc-like nanostructures.


image file: c6ra09964e-f2.tif
Fig. 2 SEM images of BiOCl (a) and BiOCl–Ag (b); TEM and HRTEM images of BiOCl nanodiscs (c) and BiOCl–Ag composites (d and e).

Compared to BiOCl, small particles can be found on the surface of BiOCl–Ag sample under SEM observation (Fig. 2(b)), and peaks at around 3 keV belonging to element Ag were observed in its EDX pattern (Fig. S3). Moreover, these small Ag NPs with a size around 15–30 nm could be more clearly seen under TEM (Fig. 2(d)), and the lattices indexing to BiOCl and Ag NPs were observed under higher magnification as marked in Fig. 2(e). Specifically, the lattice fringe with a d-spacing of 0.275 nm was consistent with the (110) plane of tetragonal structure BiOCl and the lattice spacing of 0.236 nm was corresponded to the (111) face-centered cubic structure of Ag. These lattice fingers matched well with the XRD results, confirming the successful introduction of Ag in metallic form on BiOCl. At the same time, no significant size or morphology variation of BiOCl nanodiscs was found after Ag loading (Fig. 2(b) and (d)), implying that photo-reduction is a suitable method to deposit Ag NPs on BiOCl without affecting its morphology.

The elemental compositions and chemical states of BiOCl and BiOCl–Ag were analyzed with XPS. Fig. 3 shows the survey scan spectra of BiOCl and BiOCl–Ag in the binding energy range of 0 to 1200 eV. Only the characteristic peaks of Bi, Cl and O with C as a reference at 285 eV were observed in the survey of BiOCl (Fig. 3(a)), which is consistent with the result of EDX (Fig. S3) and further verifies the high compositional purity of BiOCl nanodiscs. In the case of BiOCl–Ag, peaks at around 360 to 380 eV in the survey scan spectrum belonging to Ag were also detected as labeled in Fig. 3(a). To identify the status of Ag NPs deposited on BiOCl, the high resolution scan of Ag 3d was conducted (Fig. 3(b)). Two major peaks associated with the 3d doublet assigning to the binding energy of Ag 3d5/2 and 3d3/2 of metallic Ag at 368.1 and 374.1 eV, respectively, were detected.49–51 Based on the results of XPS, the Ag content in BiOCl–Ag composites was estimated to be 1.862 at%.


image file: c6ra09964e-f3.tif
Fig. 3 Full XPS survey scan spectra of BiOCl and BiOCl–Ag (a); high-resolution XPS spectrum of Ag 3d of BiOCl–Ag (b).

To further probe the possible effect of Ag NPs introduction on the vibrational and structural properties of BiOCl crystals, Raman spectroscopy was applied and the results are displayed in Fig. 4. For pure BiOCl, two distinguishable bands located at 145 cm−1 and 199 cm−1 were observed, which can be ascribed to the A1g and Eg internal Bi–Cl stretching modes, respectively.52–55 Similar vibrations modes were detected for BiOCl–Ag except that the peak intensity was remarkably higher. Such enhanced intensity is known as Surface Enhancement Raman Scattering (SERS) caused by the incorporation between Ag NPs and BiOCl. In particular, the surface plasmon resonance of Ag can lead to local electromagnetic filed enhancement,56,57 and this may be the major contributor to the SERS effect of BiOCl–Ag composites. The Raman spectra further confirmed that Ag NPs were closely bonded with BiOCl and the interaction between BiOCl and Ag NPs would strengthen the intensity of Raman peaks of BiOCl.


image file: c6ra09964e-f4.tif
Fig. 4 Raman spectra of BiOCl and BiOCl–Ag.

3.2 Optical absorption property

The influence of Ag nanoparticles on the optical properties of BiOCl was studied by UV-vis diffuse reflectance spectroscopy and photoluminescence (PL) spectroscopy. Pure BiOCl nanodiscs mainly showed absorption in the UV region with an absorption edge at around 350 nm as illustrated in Fig. 5. After being modified with Ag NPs, significant absorption in the visible light range from 420 to 600 nm was observed in BiOCl–Ag composites. Ag NPs have been proved to be capable of enhancing the light absorption performance of semiconductors as a result of their localized surface plasmonic resonance (SPR) effect. Therefore, the observed new broad absorption in the range of 400–550 nm could be assigned to the SPR effect of Ag NPs which would provide BiOCl–Ag photoactivity in the visible light region and lead to an improved photocatalytic performance.58–62 The band gap of BiOCl and BiOCl–Ag were calculated to be 3.53 and 3.40 eV, respectively, by the UV-vis spectra using Kubelka–Munk function, proving that BiOCl–Ag had a smaller band gap due to the introduction of Ag NPs.
image file: c6ra09964e-f5.tif
Fig. 5 UV-vis diffuse reflectance spectra (a) and photoluminescence spectra (b) of BiOCl and BiOCl–Ag composites. Inset in (a) is the transformed Kubelka–Munk functions vs. photon energy.

The enhanced light absorption of BiOCl–Ag (Fig. 5(a)) implies it would generate photo-induced electron–hole pairs more efficiently than BiOCl under UV and visible light illumination. However, the recombination of electron–hole pairs can significantly hinder the photocatalytic performance. Hence, it is essential to fabricate the heterogeneous composites which are capable to effectively separate, migrate and transfer charge carriers. Photoluminescence (PL) spectrum is a useful method to study the fate of electron–hole pairs in semiconductor particles. The PL spectra of BiOCl and BiOCl–Ag displayed in Fig. 5(b) clearly show that compared to BiOCl, BiOCl–Ag presented remarkably quenched intensity, indicating a lower recombination rate between electrons and holes. Thus, loading of Ag NPs on BiOCl can efficiently inhibit the recombination of electron–hole pairs and achieve a higher charger separation efficiency which would also benefit the photocatalytic activity.

3.3 Photocatalytic degradation of SAM

Before applying visible light, SAM solution was continuously stirred for 5 h in dark without adding any photocatalyst. No obvious change of concentration was found, indicating that the hydrolysis of SAM was negligible. When visible light was applied, 8.6% SAM was degraded without photocatalyst (Fig. 6). The degradation efficiency was increased to 82.4% when BiOCl–Ag was present, which is almost twice higher than that of BiOCl (26.1%). TOC changes during the photo-degradation process can reveal the degree of mineralization of organic molecules. As shown in Fig. 6(a) inset, the TOC removal efficiency of SAM with BiOCl and BiOCl–Ag in 5 h were 19.5% and 61.6%, respectively, indicating the better SAM mineralization performance of the latter. Meanwhile, the lower TOC removal efficiency compared with the degradation efficiency of SAM suggests the generation of intermediates during the photocatalytic process. In general, the remarkable improvement in degradation performance can be ascribed to the introduction of Ag NPs on the surface of BiOCl as illustrated by eqn (1)–(5). In brief, Ag NPs can strongly absorb visible light due to their surface plasmon resonance (SPR) effect and thereby generate photo-excited electrons and holes.63–65 The photo-induced electrons can rapidly transfer to the conduction band of BiOCl, which subsequently intensifies the separation rate of electron–hole pairs. Additionally, photo-excited Ag can shift to more positive potentials, generating positively charged Agn+ as active species which also can degrade SAM.66 The photo-induced electrons can be trapped by electron acceptors like dissolved oxygen (O2) and subsequently produce superoxide ions (·O2) to attack surrounding SAM. Photo-induced holes can directly oxidize the adsorbed SAM on BiOCl–Ag surface and also can react with water forming ·OH and H+. H+ is able to interact with ·O2 creating ·OOH and ·OH. After a chain of reactions, these active species would perform together and lead to the enhanced degradation of SAM. The tentative photocatalytic mechanism is proposed in Scheme 1(a).
 
BiOCl–Ag + visible light → hVB+ + eCB + Agn+ (1)
 
eCB + O2 → ˙O2 (2)
 
hVB+ + H2O → ˙OH + H+ (3)
 
hVB+ + OH → ˙OH (4)
 
˙O2 + H+ → ˙OOH → ˙OH (5)

image file: c6ra09964e-f6.tif
Fig. 6 Degradation of SAM under visible light, BiOCl and BiOCl–Ag (a). Inset in (a) shows TOC removal efficiency of SAM with BiOCl, and BiOCl–Ag after 5 h irradiation. Degradation of SAM of BiOCl–Ag with different scavengers after 5 h irradiation under visible light, SAM = 10 mg L−1, catalyst dosage = 1.0 g L−1, initial pH = 7 ± 0.2 (b).

image file: c6ra09964e-s1.tif
Scheme 1 Photocatalytic mechanisms of SAM degradation (a) and bacterial inactivation (b) by BiOCl–Ag under visible light irradiation.

In order to verify the roles of different active species involved in the photocatalytic process of BiOCl–Ag composites, radical scavengers including methanol (h+ scavenger), BQ (˙O2 scavenger) and DMSO (˙OH scavenger) were added. Results (Fig. 6(b)) show that these scavengers could inhibit the degradation to different degrees. In comparison to the efficiency without any scavenger, BQ and methanol could remarkably suppress the degradation of SAM and the efficiency was respectively reduced by 54.9% and 48.2% which are more than that of DMSO (25% reduction), indicating that ˙O2 and h+ were the main active species participated in the photo-degradation of SAM.

During the photocatalytic process, initial pH could affect the surface charging of photocatalysts and organic matters and thus may influence the adsorption of organic matters on the catalysts. In the meantime, pH level would affect the generation of radicals involving the participation of H+ and/or OH as well. Therefore, the effect of initial pH on the degradation of SAM in the range of 5 to 9 was studied to optimize the reaction conditions (Fig. 7(a)). Overall, slight increase of degradation efficiency could be found at lower pH for both BiOCl and BiOCl–Ag while higher pH showed marginal inhibition on the degradation performance. In particular, BiOCl–Ag degraded 91.7% SAM at pH 5 and this efficiency declined to 75.9% at pH 9 (82.4% at pH 7). Similar trend was observed for BiOCl where 33.2% SAM was degraded at pH 5 and 19.7% at pH 9 (26.1% at pH 7). Considering that adsorption of SAM on both catalysts was quite low (Fig. S5), the adsorption difference originated from pH changes is not the main factor affecting the degradation performance. Thus, the effect of initial pH on SAM degradation can be assigned to its influence on radical generation. Under acidic conditions, more hVB+ and more ˙OH may participate in SAM degradation as illustrated by eqn (3)–(5), which would subsequently improve the photocatalytic process.


image file: c6ra09964e-f7.tif
Fig. 7 Degradation of SAM under visible light at different initial pH, SAM = 10 mg L−1, catalyst dosage = 1.0 g L−1 (a); five cycles of SAM degradation with BiOCl–Ag as photocatalysts under visible light for 5 h, SAM = 10 mg L−1, catalyst dosage = 1.0 g L−1, initial pH = 7 ± 0.2 (b).

Good repeatability and photostability of photocatalysts are of importance in practical application. In this study, BiOCl–Ag remained vigorous photocatalytic activity even after five cycles as displayed in Fig. 7(b). Though slight loss of degradation efficiency was observed, this could result from the unavoidable loss of BiOCl–Ag catalyst during the recovery process. The loss of Ag, mainly leaching as Ag+, during the usage would also affect the stability of BiOCl–Ag. More importantly, Ag+ is believed to be hazardous to aquatic ecosystem at high concentrations.67,68 Ag leaching during the BiOCl–Ag photocatalytic process was monitored by ICP to test the stability and possible hazard to water. The results are given in Table S2, where Ag leaching in all observed conditions was below 0.08 mg L−1, not exceeding the WHO standard (0.1 mg L−1). This means that Ag leaching from BiOCl–Ag would not be harmful to the environment or remarkably suppress its photocatalytic efficiency.

After 5 cycles, the used BiOCl–Ag was observed by SEM as illustrated in Fig. 8(a) where no significant morphology change was found. Meanwhile, the XRD pattern of the used BiOCl–Ag (Fig. 8(b)) was well maintained compared to the fresh BiOCl–Ag. Such results prove that the as-prepared BiOCl–Ag had high photostability and can be reused.


image file: c6ra09964e-f8.tif
Fig. 8 SEM image of BiOCl–Ag after 5 repeated cycles (a) and XRD patterns of fresh BiOCl–Ag and used BiOCl–Ag after 5 cycles (b).

3.4 Antibacterial activity under visible light irradiation

BiOCl can produce active radicals like ˙O2 and ˙OH in aqueous conditions by direct absorption of photons under visible light irradiation.21,69–71 These radicals are capable of attacking bacterial cells and eventually lead to their death.72 So far, there is no report exploring the antibacterial activity of BiOCl. In our study, results (Fig. 9 and S7) demonstrate that pure BiOCl indeed carries antibacterial function and this effect can be further improved under light irradiation which may result from photocatalytic ability with radicals formation as mentioned above. However, its antibacterial efficiency (1[thin space (1/6-em)]log or 2[thin space (1/6-em)]log reduction) was not high enough for disinfection purposes. On the other hand, BiOCl–Ag composites performed much better than BiOCl under both dark and visible light conditions. Specifically, BiOCl–Ag achieved 100% antibacterial efficiency against both E. coli and B. subtilis after 2 h irradiation with 7[thin space (1/6-em)]log reduction (Fig. 9 and S7).
image file: c6ra09964e-f9.tif
Fig. 9 Log reduction of E. coli (a) and B. subtilis (b) by the as-prepared photocatalysts (1.0 g L−1) in dark (D) and under visible light (L).

The higher antibacterial effect of BiOCl–Ag composites may be induced by several reasons as illustrated in Scheme 1(b). Firstly, the antibacterial effect of Ag can be one important contributor since Ag is a well-known and effective biocidal agent.38–42 Though the antibacterial mechanism of Ag NPs has not been thoroughly understood, three mechanisms44 have been proposed. (1) Ag NPs can directly interact with bacterial cell membranes, leading to the increase of cell permeability, change of cell structure and subsequently loss of cell viability.40,73,74 (2) Ag NPs can release Ag+ in the aqueous phase. Ag+ can react with some proteins with cysteine due to its high affinity with thiol groups and some enzymes in the respiratory chain and detriment their functions.38,39 Moreover, Ag+ acts as strong nucleic acid binder to DNA and RNA, which would cause the densation of DNA and loss of replication ability.42 (3) Ag NPs are able to generate free radicals which could attack and inactivate bacterial cell.75,76 Secondly, active radicals generated in the photocatalytic reactions of BiOCl–Ag can effectively inactive bacterial cells by decomposing their cell walls and membranes which would lead to the leakage of intracellular molecules,71,72 and finally death of cells. In brief, the excellent antibacterial performance of BiOCl–Ag under visible light irradiation comes from two parts (Scheme 1(b)): (i) inactivation effect originated from metallic Ag and Ag+; (ii) antibacterial effect of active radicals. This study proves that BiOCl–Ag composites can be a good candidate for disinfection purpose.

4. Conclusions

In this study, 2D BiOCl nanodiscs with good crystallinity were successfully synthesized via a modified facile solvothermal method and BiOCl–Ag nanocomposites were generated by a photo-reduction method. Ag NPs formed on the surface of BiOCl nanodiscs could be clearly observed by TEM, and were proved to be metallic Ag by XRD and XPS analysis. The introduction of Ag NPs demonstrated remarkable influence on the properties of BiOCl, including a shift on absorption edge towards visible region, the appearance of SERS effect and significantly reduced recombination rate of electron–hole pairs. All these changes imply that BiOCl–Ag may have improved photocatalytic activity under visible light irradiation, which was confirmed by the degradation of SAM. It showed approximately twice higher degradation efficiency as compared to BiOCl. Additionally, acidic condition would be beneficial to SAM degradation, and the main active species can be ascribed to ˙O2 and h+. Moreover, the existence of Ag NPs can facilitate the antibacterial performance of BiOCl, evidenced by 100% inactivation efficiency over E. coli and B. subtilis under visible light irradiation. Ag with antibacterial ability and active species generated in photocatalytic process played the crucial roles. This study shows that BiOCl–Ag composites can be a promising photocatalyst in degradation of organic pollutants as well as removal of pathogens in water treatment with visible light from sunlight as energy source.

Acknowledgements

The authors appreciate the financial support received from Nanyang Technological University (M4081044) and Ministry of Education of Singapore (M4011352). The authors also would like to thank Dr Wang Penghua, Dr Ronn Goei, Dr Tang Xiuzhi and all the laboratory staffs from the Environmental Labs, Environmental Chemistry and Materials Group (ECMG), and the Facility for Analysis Characterization Testing Simulation (FACTS) for their kind assistance.

References

  1. J. Díaz-Reyes, R. J. Delgado-Macuil, V. Dorantes-García, A. Pérez-Benítez, J. A. Balderas-López and J. A. Ariza-Ortega, Mater. Sci. Eng., B, 2010, 174, 182–186 CrossRef.
  2. A. L. Batt, I. B. Bruce and D. S. Aga, Environ. Pollut., 2006, 142, 295–302 CrossRef CAS PubMed.
  3. A. Watkinson, E. Murby, D. Kolpin and S. Costanzo, Sci. Total Environ., 2009, 407, 2711–2723 CrossRef CAS PubMed.
  4. M. S. Fram and K. Belitz, Sci. Total Environ., 2011, 409, 3409–3417 CrossRef CAS PubMed.
  5. L. Rizzo, A. Della Sala, A. Fiorentino and G. L. Puma, Water Res., 2014, 53, 145–152 CrossRef CAS PubMed.
  6. M. Shokri, G. Isapour, M. A. Behnajady and S. Dorosti, Desalin. Water Treat., 2015, 1–8 Search PubMed.
  7. P. Dunlop, M. Ciavola, L. Rizzo, D. McDowell and J. Byrne, Catal. Today, 2015, 240, 55–60 CrossRef CAS.
  8. T. Schwartz, W. Kohnen, B. Jansen and U. Obst, FEMS Microbiol. Ecol., 2003, 43, 325–335 CrossRef CAS PubMed.
  9. G. Lofrano, G. Libralato, R. Adinolfi, A. Siciliano, P. Iannece, M. Guida, M. Giugni, A. V. Ghirardini and M. Carotenuto, Ecotoxicol. Environ. Saf., 2016, 123, 65–71 CrossRef CAS PubMed.
  10. E. A. Serna-Galvis, J. Silva-Agredo, A. L. Giraldo, O. A. Flórez and R. A. Torres-Palma, Chem. Eng. J., 2016, 284, 953–962 CrossRef CAS.
  11. A. Zapata, I. Oller, L. Rizzo, S. Hilgert, M. Maldonado, J. Sánchez-Pérez and S. Malato, Appl. Catal., B, 2010, 97, 292–298 CrossRef CAS.
  12. S. Linic, P. Christopher and D. B. Ingram, Nat. Mater., 2011, 10, 911–921 CrossRef CAS PubMed.
  13. N. Zhang, M. Q. Yang, S. Liu, Y. Sun and Y. J. Xu, Chem. Rev., 2015, 115, 10307–10377 CrossRef CAS PubMed.
  14. R. Marschall, Adv. Funct. Mater., 2014, 24, 2421–2440 CrossRef CAS.
  15. F. Shen, L. Zhou, J. Shi, M. Xing and J. Zhang, RSC Adv., 2015, 5, 4918–4925 RSC.
  16. X. Zhang, Z. Ai, F. Jia and L. Zhang, J. Phys. Chem. C, 2008, 112, 747–753 CAS.
  17. L.-P. Zhu, G.-H. Liao, N.-C. Bing, L.-L. Wang, Y. Yang and H.-Y. Xie, CrystEngComm, 2010, 12, 3791 RSC.
  18. D. Sun, J. Li, Z. Feng, L. He, B. Zhao, T. Wang, R. Li, S. Yin and T. Sato, Catal. Commun., 2014, 51, 1–4 CrossRef CAS.
  19. Y. Lei, G. Wang, S. Song, W. Fan and H. Zhang, CrystEngComm, 2009, 11, 1857 RSC.
  20. J.-M. Song, C.-J. Mao, H.-L. Niu, Y.-H. Shen and S.-Y. Zhang, CrystEngComm, 2010, 12, 3875 RSC.
  21. F. Chen, H. Liu, S. Bagwasi, X. Shen and J. Zhang, J. Photochem. Photobiol., A, 2010, 215, 76–80 CrossRef CAS.
  22. F. Tian, J. Xiong, H. Zhao, Y. Liu, S. Xiao and R. Chen, CrystEngComm, 2014, 16, 4298 RSC.
  23. D. H. Wang, G. Q. Gao, Y. W. Zhang, L. S. Zhou, A. W. Xu and W. Chen, Nanoscale, 2012, 4, 7780–7785 RSC.
  24. J. Xiong, G. Cheng, G. Li, F. Qin and R. Chen, RSC Adv., 2011, 1, 1542 RSC.
  25. Z. Deng, D. Chen, B. Peng and F. Tang, Cryst. Growth Des., 2008, 8, 2995–3003 CAS.
  26. X. Zhang, X. B. Wang, L. W. Wang, W. K. Wang, L. L. Long, W. W. Li and H. Q. Yu, ACS Appl. Mater. Interfaces, 2014, 6, 7766–7772 CAS.
  27. M. A. Gondal, X. F. Chang and Z. H. Yamani, Chem. Eng. J., 2010, 165, 250–257 CrossRef CAS.
  28. J. Liqiang, S. Xiaojun, S. Jing, C. Weimin, X. Zili, D. Yaoguo and F. Honggang, Sol. Energy Mater. Sol. Cells, 2003, 79, 133–151 CrossRef.
  29. W. J. Kim, D. Pradhan, B.-K. Min and Y. Sohn, Appl. Catal., B, 2014, 147, 711–725 CrossRef CAS.
  30. Z. Zhang, Y. Zhou, S. Yu, M. Chen and F. Wang, Mater. Lett., 2015, 150, 97–100 CrossRef CAS.
  31. Y. Gao, L. Wang, Z. Li, C. Li, X. Cao, A. Zhou and Q. Hu, Mater. Lett., 2014, 136, 295–297 CrossRef CAS.
  32. Z. G. Chen, L. Zhu, J. X. Xia, L. Xu, H. M. Li, J. Zhang, M. Q. He and J. Liu, Mater. Technol., 2014, 29, 245–251 CrossRef CAS.
  33. M. Nussbaum, N. Shaham-Waldmann and Y. Paz, J. Photochem. Photobiol., A, 2014, 290, 11–21 CrossRef CAS.
  34. J. Di, J. Xia, S. Yin, H. Xu, L. Xu, Y. Xu, M. He and H. Li, RSC Adv., 2014, 4, 14281 RSC.
  35. Y. Yu, C. Cao, H. Liu, P. Li, F. Wei, Y. Jiang and W. Song, J. Mater. Chem. A, 2014, 2, 1677–1681 CAS.
  36. H. Lin, L. Ding, Z. Pei, Y. Zhou, J. Long, W. Deng and X. Wang, Appl. Catal., B, 2014, 160–161, 98–105 CrossRef CAS.
  37. K. Kümmerer, Chemosphere, 2009, 75, 417–434 CrossRef PubMed.
  38. Q. Feng, J. Wu, G. Chen, F. Cui, T. Kim and J. Kim, J. Biomed. Mater. Res., 2000, 52, 662–668 CrossRef CAS PubMed.
  39. M. Rai, A. Yadav and A. Gade, Biotechnol. Adv., 2009, 27, 76–83 CrossRef CAS PubMed.
  40. C. Hu, J. Guo, J. Qu and X. Hu, Appl. Catal., B, 2007, 73, 345–353 CrossRef CAS.
  41. W. R. Li, X. B. Xie, Q. S. Shi, H. Y. Zeng, Y. S. Ou-Yang and Y. B. Chen, Appl. Microbiol. Biotechnol., 2010, 85, 1115–1122 CrossRef CAS PubMed.
  42. H. Arakawa, J. Neault and H. Tajmir-Riahi, Biophys. J., 2001, 81, 1580–1587 CrossRef CAS PubMed.
  43. C.-N. Lok, C.-M. Ho, R. Chen, Q.-Y. He, W.-Y. Yu, H. Sun, P. K.-H. Tam, J.-F. Chiu and C.-M. Che, JBIC, J. Biol. Inorg. Chem., 2007, 12, 527–534 CrossRef CAS PubMed.
  44. C. Marambio-Jones and E. M. V. Hoek, J. Nanopart. Res., 2010, 12, 1531–1551 CrossRef CAS.
  45. C.-N. Lok, C.-M. Ho, R. Chen, Q.-Y. He, W.-Y. Yu, H. Sun, P. K.-H. Tam, J.-F. Chiu and C.-M. Che, J. Proteome Res., 2006, 5, 916–924 CrossRef CAS PubMed.
  46. D. G. Anderson, E. W. Nester, M. T. Nester, N. N. Pearsall and C. E. Roberts, Microbiology: A human perspective, McGraw-Hill, 2004 Search PubMed.
  47. W. Yang, B. Ma, W. Wang, Y. Wen, D. Zeng and B. Shan, Phys. Chem. Chem. Phys., 2013, 15, 19387–19394 RSC.
  48. J. Cheng, S. Shi, T. Tang, S. Tian, W. Yang and D. Zeng, J. Alloys Compd., 2015, 643, 159–166 CrossRef CAS.
  49. M. Zhu, P. Chen and M. Liu, J. Mater. Chem., 2011, 21, 16413 RSC.
  50. M. Zhu, P. Chen and M. Liu, ACS Nano, 2011, 5, 4529–4536 CrossRef CAS PubMed.
  51. H. Cheng, B. Huang, P. Wang, Z. Wang, Z. Lou, J. Wang, X. Qin, X. Zhang and Y. Dai, Chem. Commun., 2011, 47, 7054–7056 RSC.
  52. K. Zhang, J. Liang, S. Wang, J. Liu, K. Ren, X. Zheng, H. Luo, Y. Peng, X. Zou, X. Bo, J. Li and X. Yu, Cryst. Growth Des., 2012, 12, 793–803 CAS.
  53. Y. Tian, C. F. Guo, Y. Guo, Q. Wang and Q. Liu, Appl. Surf. Sci., 2012, 258, 1949–1954 CrossRef CAS.
  54. S. Shamaila, A. K. Sajjad, F. Chen and J. Zhang, J. Colloid Interface Sci., 2011, 356, 465–472 CrossRef CAS PubMed.
  55. J. Xia, L. Xu, J. Zhang, S. Yin, H. Li, H. Xu and J. Di, CrystEngComm, 2013, 15, 10132 RSC.
  56. G. Shan, L. Xu, G. Wang and Y. Liu, J. Phys. Chem. C, 2007, 111, 3290–3293 CAS.
  57. X. Li, H. Hu, D. Li, Z. Shen, Q. Xiong, S. Li and H. J. Fan, ACS Appl. Mater. Interfaces, 2012, 4, 2180–2185 CAS.
  58. C. Yu, C. Fan, X. Meng, K. Yang, F. Cao and X. Li, React. Kinet., Mech. Catal., 2011, 103, 141–151 CrossRef CAS.
  59. L. Kong, Z. Jiang, H. H. C. Lai, T. Xiao and P. P. Edwards, Prog. Nat. Sci., 2013, 23, 286–293 CrossRef.
  60. K. Awazu, M. Fujimaki, C. Rockstuhl, J. Tominaga, H. Murakami, Y. Ohki, N. Yoshida and T. Watanabe, J. Am. Chem. Soc., 2008, 130, 1676–1680 CrossRef CAS PubMed.
  61. N. Zhang and Y.-J. Xu, CrystEngComm, 2016, 18, 24–37 RSC.
  62. S. Liu, Z. R. Tang, Y. Sun, J. C. Colmenares and Y. J. Xu, Chem. Soc. Rev., 2015, 44, 5053–5075 RSC.
  63. D. Shan, L. Huang, X. Li, W. Zhang, J. Wang, L. Cheng, X. Feng, Y. Liu, J. Zhu and Y. Zhang, J. Phys. Chem. C, 2014, 118, 23930–23936 CAS.
  64. P. V. Kamat, J. Phys. Chem. B, 2002, 106, 7729–7744 CrossRef CAS.
  65. K. L. Kelly, E. Coronado, L. L. Zhao and G. C. Schatz, J. Phys. Chem. B, 2003, 107, 668–677 CrossRef CAS.
  66. G. Jiang, R. Wang, X. Wang, X. Xi, R. Hu, Y. Zhou, S. Wang, T. Wang and W. Chen, ACS Appl. Mater. Interfaces, 2012, 4, 4440–4444 CAS.
  67. A. D. Arulraj, R. Devasenathipathy, S.-M. Chen, V. S. Vasantha and S.-F. Wang, Sensing and Bio-Sensing Research, 2015, 6, 19–24 CrossRef.
  68. T. M. Benn and P. Westerhoff, Environ. Sci. Technol., 2008, 42, 4133–4139 CrossRef CAS PubMed.
  69. B. Pare, B. Sarwan and S. B. Jonnalagadda, J. Mol. Struct., 2012, 1007, 196–202 CrossRef CAS.
  70. Q. Wang, J. Hui, Y. Huang, Y. Ding, Y. Cai, S. Yin, Z. Li and B. Su, Mater. Sci. Semicond. Process., 2014, 17, 87–93 CrossRef CAS.
  71. J. Podporska-Carroll, E. Panaitescu, B. Quilty, L. Wang, L. Menon and S. C. Pillai, Appl. Catal., B, 2015, 176, 70–75 CrossRef.
  72. H. A. Foster, I. B. Ditta, S. Varghese and A. Steele, Appl. Microbiol. Biotechnol., 2011, 90, 1847–1868 CrossRef CAS PubMed.
  73. H. Zhang and G. Chen, Environ. Sci. Technol., 2009, 43, 2905–2910 CrossRef CAS PubMed.
  74. N. A. Amro, L. P. Kotra, K. Wadu-Mesthrige, A. Bulychev, S. Mobashery and G.-y. Liu, Langmuir, 2000, 16, 2789–2796 CrossRef CAS.
  75. J. S. Kim, E. Kuk, K. N. Yu, J. H. Kim, S. J. Park, H. J. Lee, S. H. Kim, Y. K. Park, Y. H. Park, C. Y. Hwang, Y. K. Kim, Y. S. Lee, D. H. Jeong and M. H. Cho, Nanomedicine, 2007, 3, 95–101 CAS.
  76. O. Choi and Z. Hu, Environ. Sci. Technol., 2008, 42, 4583–4588 CrossRef CAS PubMed.

Footnotes

Electronic supplementary information (ESI) available. See DOI: 10.1039/c6ra09964e
Corresponding address: School of Civil and Environmental Engineering, Nanyang Technological University, 50 Nanyang Avenue, Singapore 639798, Republic of Singapore.
§ Current address: Environmental and Water Technology Centre of Innovation, Ngee Ann Polytechnic, 535 Clementi Road, Singapore 599489, Republic of Singapore.

This journal is © The Royal Society of Chemistry 2016