Self-strengthening hybrid dental adhesive via visible-light irradiation triple polymerization

Linyong Songa, Qiang Ye*a, Xueping Gea, Anil Misraab, Candan Tamerlerac and Paulette Spencer*ac
aUniversity of Kansas, Bioengineering Research Center, 1530 W. 15th Street, Lawrence, KS 66045-7609, USA. E-mail: yeq@ku.edu; pspencer@ku.edu
bUniversity of Kansas, Department of Civil Engineering, 1530 W. 15th Street, Lawrence, KS 66045-7609, USA
cUniversity of Kansas, Department of Mechanical Engineering, 1530 W. 15th Street, Lawrence, KS 66045-7609, USA

Received 17th April 2016 , Accepted 24th May 2016

First published on 25th May 2016


Abstract

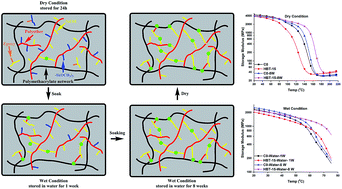
A self-strengthening methacrylate-based dental adhesive system was developed by introducing an epoxy cyclohexyl trimethoxysilane (TS) which contains both epoxy and methoxysilyl functional groups. The experimental formulation, HEMA/BisGMA/TS (22.5/27.5/50, wt%), was polymerized by visible-light. Real-time Fourier transform infrared spectroscopy (FTIR) was used to investigate in situ the free radical polymerization of methacrylate, ring-opening cationic polymerization of epoxy, and photoacid-induced sol–gel reactions. Among the three simultaneous reactions, the reaction rate of the free radical polymerization was the highest and the hydrolysis/condensation rate was the lowest. With 40 s-irradiation, the degrees of conversion of the double bond and epoxy groups at 600 s were 73.2 ± 1.2%, 87.9 ± 2.4%, respectively. Hydrolysis of the methoxysilyl group was initially <5%, and increased gradually to about 50% after 48 h dark storage. Photoacids generated through the visible-light-induced reaction were effective in catalyzing both epoxy ring-opening polymerization and methoxysilyl sol–gel reaction. The mechanical properties of copolymers made with TS concentrations from 5 to 35 wt% were obtained using dynamic mechanical analysis (DMA). In wet conditions, the storage moduli at 70 °C and glass transition temperature were significantly higher than that of the control (p < 0.05); these properties increased with TS concentration and storage time. The post reaction of hydrolysis/condensation of alkoxysilane could provide persistent strengthening whether in a neutral or acidic environment and these characteristics could lead to enhanced mechanical properties in the oral environment. The cumulative amount of leached species decreased significantly in the TS-containing copolymers. These results provide valuable information for the development of dental adhesives with reduced leaching of methacrylate monomers and enhanced mechanical properties under the wet, oral environment.


Introduction

The oral environment has been broadly described as an aqueous medium that experiences both pH and temperature fluctuations.1 Under ideal conditions, restorative materials, such as dental adhesives, would not degrade in the oral environment, but results from numerous investigations provide evidence of chemical and enzymatic breakdown of methacrylate-based dental adhesives in oral fluids.2–8 The degradation is prompted by water which infiltrates the resin and provokes chemical hydrolysis of ester bonds in polymethacrylate-based materials. The rate of this reaction is fast or slow depending on the type of chemical bond, pH, and water uptake.9 In general, the hydrolysis reaction is expected to be relatively slow at the neutral pH typical of saliva, but excursions in pH caused by foods or cariogenic bacteria may lead to transient acid or base catalysis.10 Local domains of the polymethacrylate networks may become sufficiently degraded and/or hydrophilic to permit access by esterases, which will accelerate ester bond hydrolysis.11,12 As a whole, the ester bonds within the polymethacrylate-based network are vulnerable to two forms of hydrolytic attack: (1) chemical hydrolysis catalyzed by acids or bases, and (2) enzymatic hydrolysis catalyzed by salivary enzymes, particularly esterases.5

The degradation of dental adhesives has been an area of intense investigation and considerable attention has been directed towards reliable damage prediction and property degradation models.13–18 In spite of this effort, detecting adhesive damage in situ is difficult. It is even more difficult to repair the adhesive because the damage often occurs at sites within the restoration, e.g. at the interface with the dentin substrate or the composite material, that are largely inaccessible for external repair by a dentist.11

Scientists have proposed self-repair or self-healing resin as a mechanism for increasing the clinical lifetime of resin-based materials.19–22 The development of self-healing resins is considered breakthrough technology.23 Microcapsules within the self-healing resins rupture when a crack forms in the matrix. The ruptured microcapsule releases a healing agent that seals the crack to reduce the damage. Adapting this approach for dental adhesives faces numerous challenges including toxicity of the healing agents, the catalysts, limitations regarding the dimensions of the microcapsules, and maintaining the integrity of the interfacial bond in the presence of the ruptured microcapsules.24,25 An alternative strategy could be resins that provide intrinsic self-strengthening properties, i.e. resins that possess behavior reminiscent of living organisms.26

In 2005, Kowalewska described the formation of oxo-silica network formed by the photoacid catalyzed sol–gel reaction of an alkoxysilyl-modified disiloxane.27 This relationship between the UV-generated photoacids and the resulting inorganic network has been developed extensively. Versace et al. studied the relation between the sol–gel reaction and cationic polymerization by using epoxy cyclohexyltrimethoxysilane as a monomer.28,29 They investigated the formation of inorganic and organic polymers via the one-step simultaneous method by UV-light irradiation28 or two separate and consecutive steps (sol–gel reaction and cationic photopolymerization).29 Our group investigated the polymerization behavior and mechanical properties of dental adhesive copolymers prepared by dual polymerization via visible-light irradiation.26 A limited photoacid-induced sol–gel reaction was observed during visible-light irradiation and the prepared copolymers showed an autonomic self-strengthening characteristic in wet conditions.

Photoacids can catalyze the sol–gel reaction of alkoxysilyl groups and can also initiate the polymerization of oxirane groups. In contrast to free radical photopolymerization, cationic polymerization is not inhibited by oxygen, and unlike free radicals, the cationic centers are not reactive towards one another. Hence they have much longer lifetimes, which promotes curing in dark conditions. Silorane-based composite has been developed and the polyether structure exhibits strong mechanical and thermal properties, chemical resistance, and low shrinkage compared with methacrylate-based materials.30,31 Recently, we have studied the methacrylate/silorane hybrid adhesive systems.32 The results indicated that the crosslink density of dental adhesives was improved with the addition of silorane monomers, and the degree of conversion of epoxy groups was affected by the number of functionalities.33 Despite these developments, with the elongation of storage time in wet conditions, the mechanical properties of the copolymers were maintained or showed a gradual decrease.

Our research group recently incorporated γ-methacryloxypropyltrimethoxysilane (MPS) into the dental adhesive formulation and explored the visible-light induced photoacid-catalyzed sol–gel reaction.26 During photopolymerization, MPS was mainly incorporated into the polymer backbone and the methoxysilyl groups acted as pendent functions. When the copolymers were stored in wet conditions, the pendent groups would react with each other and new covalent bonds (Si–O–Si) were generated via hydrolysis and condensation reactions. The mechanical properties of the newly developed copolymer showed self-strengthening characteristics whether in neutral or acidic wet conditions. The self-strengthening dental adhesive system is still in its infancy and the relationship between the components and the repair process are not clear. The lack of understanding prompted us to more closely examine the visible-light induced triple polymerization behavior of the dental adhesive system containing C[double bond, length as m-dash]C double bond, epoxy, and trialkoxysilyl functional groups. In the first part of the present study, we focus on the triple polymerization kinetics using real-time Fourier transform infrared spectroscopy (FTIR). In our case, a competition is likely to occur between the sol–gel reactions involving the alkoxysilyl groups and the epoxy ring-opening cationic polymerization. In the second part of this investigation, attention is focused on understanding the effect of storage medium and time on the intrinsic self-strengthening and self-repair processes.

Experimental

Materials

2,2-Bis[4-(2-hydroxy-3-methacryloxypropoxy)phenyl]propane (BisGMA), 2-hydroxyethyl methacrylate (HEMA), and trimethoxy[2-(7-oxabicyclo[4.1.0]hept-3-yl)ethyl]silane (TS) were obtained from Sigma-Aldrich (St. Louis, MO) and used as received without further purification. Camphorquinone (CQ), ethyl-4-(dimethylamino)benzoate (EDMAB), diphenyliodonium hexafluorophosphate (DPIHP), and L(+)-lactic acid (LA) were obtained from Sigma-Aldrich (St. Louis, MO). All other chemicals were reagent grade and used without further purification.

Preparation of adhesive formulations

Neat methacrylate monomer mixture was made by combining 45 wt% HEMA and 55 wt% BisGMA. This mixture was used as the control (C0).34,35 CQ, EDMAB, and DPIHP, at 0.5 wt% with respect to the total amount of monomers, were used as the photoinitiator (PI) system.34,35 The composition of the neat resin and the experimental formulations are listed in Table 1. Mixtures of monomers/PI were prepared in brown glass vials under amber light. The monomers/PI mixtures were stirred overnight at 23 ± 2 °C to promote complete dissolution and formation of a homogeneous solution.
Table 1 Results of degree of conversion and maximum polymerization rate of recipes
Run HEMA/BisGMAa (wt%) TS (wt%) DC (%)

image file: c6ra09933e-t1.tif

a The resin was mixed HEMA/BisGMA in the ratio of 45/55 (w/w).b Significantly (p < 0.05) different from the control (C0). The value in the ( ) is the standard deviation.
C0 100 0 64.8 (0.2) 21.2 (0.6)
HBT-5 95 5 68.6b (0.8) 21.9 (0.9)
HBT-10 90 10 71.0b (0.4) 17.6b (1.2)
HBT-15 85 15 74.8b (0.6) 15.2b (1.2)
HBT-20 80 20 78.8b (0.9) 12.4b (0.6)
HBT-35 65 35 76.6b (0.5) 7.3b (0.6)
HBT-50 50 50 73.2b (1.4) 6.0b (0.4)


Specimens preparation

The prepared resins were injected into a glass-tubing mold (Fiber Optic Center, Inc., part no. ST8100, New Bedford, MA) and light-cured for 40 s at 23 ± 2 °C with an LED light curing unit (LED Curebox, 100 mW cm−2 irradiance, Proto-tech, Portland, OR). The polymerized samples were stored in the dark at 23 ± 2 °C for at least 48 h before being used. The resultant rectangular beam specimens of cross section 1 mm × 1 mm and length 15 mm were used to determine dynamic mechanical properties.

Real-time conversion and maximum polymerization rate

The degree of conversion (DC) and polymerization behavior were determined by FTIR as described previously.35–37 Real-time, in situ, monitoring of the photopolymerization behavior of the adhesive formulations was performed using an infrared spectrometer (Spectrum 400 Fourier transform infrared spectrophotometer, Perkin-Elmer, Waltham, MA) at a resolution of 4 cm−1. A time-based spectrum collector (Spectrum TimeBase, Perkin-Elmer) was used for continuous and automatic collection of spectra during polymerization. A minimum of three measurements (n = 3) were carried out for each adhesive formulation. Methacrylic double bond conversion was monitored by the band ratio profile-1637 cm−1 (C[double bond, length as m-dash]C)/1608 cm−1 (phenyl). Epoxy group conversion was followed by monitoring the intensity of the peak at 884 cm−1.32 The calculation method to get the epoxy group conversion was used based on the published paper.38–41 The degree of hydrolysis was monitored by the band ratio profile-2840 cm−1 (νsym(–SiO[C with combining low line][H with combining low line]3))/1608 cm−1 (phenyl). The average of the last 50 values of the time-based spectra is reported as the DC value. The maximum polymerization rate (Rmaxp/[M]) was determined using the maximum slope of the linear region of the DC vs. time plots.34

Dynamic mechanical analysis (DMA)

In the current work, DMA tests were performed using a TA instruments Q800 DMA (TA Instruments, New Castle, USA) with a three-point bending clamp. The dynamic mechanical properties of polymethacrylate-based dental adhesives have been described previously.36 Rectangular beam specimens were used for DMA measurements and a minimum of three specimens were tested for each formulation. For wet testing, specimens were first submerged in water or 0.1 M LA solution at 37 °C for 1, 4, and 8 weeks, and tests were obtained using the three-point submersion clamp.42 The test temperature was varied from 10 to 75 °C with a ramping rate of 1.5 °C min−1. For dry testing, the following testing parameters were used: displacement amplitude of 15 μm, frequency of 1 Hz and preload force of 0.01 N.14,43 In addition to this, temperature was ramped at the rate of 3 °C min−1 from 20 to 200 °C. The glass transition temperature (Tg) is determined as the position of the maximum peak on the tan[thin space (1/6-em)]δ versus temperature plots. To measure the final mechanical properties the specimens were stored in water or LA solution for 8 weeks, the hydrated specimens were dried in a vacuum oven in the presence of freshly dried silica gel at 37 °C. The samples were removed every 24 hours to determine the weight. This process was continued until a constant mass was recorded. Then, the mechanical properties were determined using the method described above.

Static or monotonic tests were performed on dental adhesives in wet conditions to obtain the stress–strain curves. During the static tests, load was increased at a constant rate until the sample ruptured. A minimum of four specimens for each formulation were tested with 0.1 N min−1 loading rate at 37 °C.44 One group of the copolymer specimens, which were soaked in water at 37 °C for 1 week, was used as the control. The other two groups of copolymer samples were first soaked in a solution of ethanol and 1 M LA aqueous solution (1[thin space (1/6-em)]:[thin space (1/6-em)]1, v/v) at 37 °C for 1 and 3 weeks, respectively. Then the specimens were transferred into greater volume of water at 37 °C for 3 days, to replace the absorbed ethanol and LA. The elastic modulus was calculated based on the maximum slope of the linear region of the stress–strain curve.

Leachable study by high-performance liquid chromatography (HPLC)

Round disk samples (4 mm diameter × 1 mm thickness) were used for the leachable study. For HPLC specimen preparation, liquid resin was injected directly into a Tzero® Hermetic Lid (P/N: 900797.901 TA Instruments Waters LLC, New Castle, DE). The lid was filled with resin, covered with a mylar film and polymerization was initiated by 40 s exposure in a LED light curing unit (LED Curebox, 100 mW cm−2 irradiance, Proto-tech, Portland, OR). The polymerized samples were stored in the dark at 23 ± 2 °C for at least 48 h before testing. The disk specimens were then submerged in 1 mL ethanol (HPLC grade) at 23 ± 2 °C for 1 to 56 days. The storage solutions were collected at various time intervals, i.e. 1, 2, 4, 7, 10, 14 days and every week after the 14 day time point. The concentration of leachate in the collected solutions was determined. Fresh ethanol was added to the disk samples after each collection.

The analysis was made using high performance liquid chromatography (HPLC) on a system (Shimadzur® LC-2010C HT, software EZstart, version 7.4 SP2) equipped with a 250 × 4.6 mm column packed with 5 μm C-18 silica (Luna®, Phenomenex Inc., Torrance, CA). The mobile phase was acetonitrile/water (70/30, v/v). The system was operated under the following conditions: 0.5 mL min−1 flow rate; detection at 208 nm; 20 μL sampling loop; 40 °C temperature. The column was calibrated with known concentrations of the BisGMA and HEMA, at concentrations of 5, 10, 20, 50, 100 and 250 mg L−1 in ethanol. The calibration curves with the linear fittings of BisGMA (5–250 mg L−1, R2 = 0.999) and HEMA (5–500 mg L−1, R2 = 0.999) were used to calculate the concentration of these species in the extracts. The concentration was based on the intensity of the chromatographic peaks at the corresponding retention time. The HPLC analysis was performed using the extract of 3 samples for each formulation.

Statistical analysis

The results were analyzed statistically using one-way analysis of variance (ANOVA), together with Tukey's test at α = 0.05 (Origin Version 9.1, OriginLab Corp., Northampton, MA) to identify significant differences in the means.

Results

The chemical structures of monomers used in the present study are illustrated in Scheme 1. A three-component photoinitiator system34,35 was used to initiate the polymerization of methacrylate monomers (HEMA and BisGMA) and epoxy functional silane (TS).
image file: c6ra09933e-s1.tif
Scheme 1 Chemical structures of monomers used in the formulations and illustration of the triple polymerization mechanism.

Real-time photopolymerization kinetic behaviors of the control and experimental formulations are shown in Fig. 1 and the DC and maximum polymerization rate are summarized in Table 1. With the increase of TS concentration from 5 to 50 wt%, the DC (600 s) was significantly higher than that of the control (64.8 ± 0.2%) at the 0.05 level. The highest DC (78.8 ± 0.9%) was observed at a TS concentration of 20 wt%. The maximum polymerization rates (C[double bond, length as m-dash]C bond) of the experimental formulations were significantly lower than the control (p < 0.05), with the exception of the formulation at 5 wt% TS (see Table 1).


image file: c6ra09933e-f1.tif
Fig. 1 Real-time conversion plots of the control (C0) and experimental adhesives versus time. The adhesives were light-cured for 40 s at 23 ± 2 °C using a commercial visible light lamp (Spectrum® 800, Dentsply, Milford, DE. Intensity is 550 mW cm−2).

Fig. 2 shows the characteristic peaks of FTIR spectra of HBT-50 formulation before and after visible-light irradiation. The hydrolysis of methoxyl (2840 cm−1, –SiO[C with combining low line][H with combining low line]3) group was observed through the disappearance of the CH3–O symmetric stretch band. Meanwhile, the intensity of the large band around 3400 cm−1 (hydrogen bond OH stretching mode) increased gradually and the maximum peaks moved from 3450 to 3350 cm−1 and the peak at 900 cm−1 ([S with combining low line][i with combining low line][O with combining low line]H stretching vibration mode) was visible with time. These results indicated that the hydrolysis step of the sol–gel reaction occurred with storage time. In accordance with the condensation reaction, a broad peak with a maximum at ∼1025 cm−1, assigned to the Si–O–Si asymmetric stretching mode, was noticed, which is a characteristic of silica network formation. At the same time, the gradual broadening of peak at 1720 cm−1 and elevated at 1637 cm−1 were attributed to increasing water concentration in the polymers. These results are evidence that the condensation reaction between silanol–silanol and/or silanol–hydroxyl groups occurred gradually with storage time. In addition to the free radical promoted cationic ring-opening polymerization,32,33 a decrease of the band at 884 cm−1 attributed to the epoxy group, was visible in the FTIR spectrum (Fig. 2D). These results provide evidence that epoxy ring-opening occurred concomitantly with the free radical polymerization and sol–gel process. Photoacid is able to initiate the epoxy cationic photopolymerization, leading to the formation of polyether chains.


image file: c6ra09933e-f2.tif
Fig. 2 FTIR characteristic peaks of HBT-50 formulation before and after 40 s visible-light irradiation, (A) full view of formulation before and after light-irradiation, (B) hydrogen bond and –SiO[C with combining low line][H with combining low line]3 peak, (C) C[double bond, length as m-dash]O stretching, (D) epoxy group.

Fig. 3 shows the DMA data of the control and experimental adhesives in dry condition before and after soaking in water for 8 weeks. The HBT-50 formulation is not shown because the samples were too soft to proceed with the DMA test. With the increase in TS concentration from 5 to 35 wt%, the rubbery moduli of unsoaked copolymer specimens increased slightly. The Tg showed a decreasing trend and decreased from 146 ± 1.2 (C0) to 107.8 ± 1.4 °C (HBT-35). After the sample was soaked in water for 8 weeks and dried again, the rubbery modulus and Tg were significantly higher than the control (p < 0.05). Tg increased from 156.0 ± 0.7 (C0) to 178 ± 1.5 °C (HBT-35). The resulting increase in network density is assumed to have a negative effect on the mobility of side chains, which was also supported by the decreasing maximum intensity of the tan[thin space (1/6-em)]δ peaks in Fig. 3E and F. From the derivative storage modulus curves of un-soaked specimens (Fig. 3C), with the increase of TS concentration from 0 to 35 wt%, the phenomena of the first transition temperature remained similar (∼85 °C with HBT-35 the exception). The secondary transition peak gradually moved to lower temperature (from ∼128 to ∼80 °C), indirectly indicating that chains of experimental copolymers possessed higher mobility than that of the control. However, for the samples soaked in water for 8 weeks, the first transition peaks were similar at about 90 °C and the secondary transition peak moved from ∼138 to ∼165 °C.


image file: c6ra09933e-f3.tif
Fig. 3 Representative storage modulus (A and B), derivative storage modulus (C and D), and tan[thin space (1/6-em)]δ (E and F) vs. temperature curves of the unsoaked (Top) and soaked (Bottom, soaked in water for 8 weeks and dried again in vacuum oven at 37 °C) specimens in dry conditions.

Fig. 4 shows the mechanical properties of the control and experimental adhesive copolymers soaked in water at 37 °C for 1, 4, and 8 weeks. These data are summarized in Table 2. With the increase in storage time in water from 1 to 8 weeks, the storage modulus of the control at 70 °C increased from about 270 to 315 MPa, and the glass transition temperature increased about 3 °C, from 59.4 to 62.3 °C. Excluding the HBT-5 sample, the storage modulus of experimental specimens at 37 °C was significantly lower than that of the control (p < 0.05). The modulus at 70 °C was, however, significantly higher than the control (p < 0.05). After 8 weeks in water, the storage modulus at 70 °C of the sample with 20 wt% TS showed a maximum of nearly 1 GPa. Tg increased with TS concentration and storage time, and was higher than that of the control.


image file: c6ra09933e-f4.tif
Fig. 4 Representative storage modulus (A, C, and E) and derivative storage modulus (B, D, and F) vs. temperature curves of the controls and experimental adhesive copolymers stored in water at 37 °C for 1, 4, and 8 weeks.
Table 2 DMA data of control and experimental specimens soaked in water for different timea
Time (week) Run Storage modulus (MPa) Tg (°C) ΔT*
37 °C 70 °C
a Same superscript letters in the same storage time group indicates no significant differences between each other (p < 0.05). * ΔT = Tg (experimental) − Tg (C0).
1 C0 1924b (86) 269b (29) 59.4 (0.3)
HBT-5 1832b,c (64) 297b,c (7) 63.3 (0.9) 3.9
HBT-10 1660c,d (63) 282b,c (17) 66.9 (0.8) 7.5
HBT-15 1638d (72) 462d (37) 69.5 (0.4) 10.1
HBT-20 1415 (50) 415d (9) 69.8 (0.8) 10.4
HBT-35 1085 (47) 531 (15) >75.0 >15.6
4 C0 1995b (32) 283 (7) 61.4 (0.2)
HBT-5 1920b (24) 362 (20) 66.2 (0.2) 4.8
HBT-10 1772c (37) 573b (30) 70.0 (0.6) 8.6
HBT-15 1688c,d (45) 744c (9) >75.0 >13.6
HBT-20 1636d (47) 789c (35) >75.0 >13.6
HBT-35 1085 (9) 554b (25) >75.0 >13.6
8 C0 2066b (52) 315b (20) 62.3 (0.1)
HBT-5 1953b,c (76) 443b (39) 67.3 (0.1) 5.0
HBT-10 1829c (28) 708c (5) 71.8 (0.2) 9.5
HBT-15 1784 (94) 988 (86) >75.0 >10.7
HBT-20 1584 (47) 805c (22) >75.0 >10.7
HBT-35 1191 (24) 698c (38) >75.0 >10.7


Fig. 5 shows the mechanical properties of the control and experimental adhesive copolymers soaked in 0.1 M LA solution at 37 °C for 1, 4, and 8 weeks, respectively. These data are summarized in Table 3. With the increase of storage time in acidic solution from 1 to 8 weeks, the storage modulus of the control at 70 °C increased from about 226 to 264 MPa, and the glass transition temperature increased about 3 °C, from 59.4 to 62.8 °C. The storage moduli of the experimental formulations at 70 °C were significantly higher than that of the control (p < 0.05). With the increase in TS concentration from 15 to 35 wt%, the storage moduli at 70 °C were similar after storage in LA solution for 8 weeks.


image file: c6ra09933e-f5.tif
Fig. 5 Representative storage modulus (A, C, and E) and derivative storage modulus (B, D, and F) vs. temperature curves of the controls and experimental adhesive copolymers stored in 0.1 M LA solution at 37 °C for 1, 4, and 8 weeks.
Table 3 DMA data of control and experimental specimens soaked in 0.1 M LAa
Time (week) Run Storage modulus (MPa) Tg (°C) ΔT*
37 °C 70 °C
a Same superscript letters in the same storage time group indicates no significant differences between each other (p < 0.05). * ΔT = Tg (experimental) − Tg (C0).
1 C0 1789b (55) 226b (34) 59.4 (0.7)
HBT-5 1839b,c (38) 286b (14) 63.8 (0.6) 4.4
HBT-10 1713b,c (72) 379 (15) 67.4 (0.9) 8.0
HBT-15 1741b,c (49) 606c (33) 71.5 (0.2) 12.1
HBT-20 1542 (37) 600c (15) 74.6 (0.5) 15.2
HBT-35 1307 (37) 655c (43) >75.0 >15.6
4 C0 1886b (8) 255b (15) 61.6 (0.3)
HBT-5 1895b (20) 329b (22) 65.3 (0.3) 3.7
HBT-10 1758c (40) 575 (39) 70 (0.2) 8.4
HBT-15 1807b,c (59) 848c (44) >75.0 >13.4
HBT-20 1616 (5) 808c,d (9) >75.0 >13.4
HBT-35 1315 (36) 727d (48) >75.0 >13.4
8 C0 2002b (19) 264b (23) 62.8 (0.3)
HBT-5 1946b,c (55) 353b (25) 65.9 (0.3) 3.1
HBT-10 1870c,d (81) 623 (93) 70.2 (0.7) 7.4
HBT-15 1771d,e (64) 885c (11) >75.0 >12.2
HBT-20 1731e (37) 858c (23) >75.0 >12.2
HBT-35 1430 (51) 840c (40) >75.0 >12.2


Fig. 6 shows the storage moduli of the control and experimental specimens at 70 °C measured in wet conditions. The values of the control in water were slightly higher than that in LA solution. However, the modulus values of the experimental at 70 °C in 0.1 M LA solution were comparable or higher than that in water with the same storage time. Whether in water or 0.1 M LA solution, the maximum values were observed with the optimal TS concentration in 10–20 wt% (stored in water) and 15–35 wt% (stored in LA solution), respectively.


image file: c6ra09933e-f6.tif
Fig. 6 Storage modulus at 70 °C of control and experimental samples stored in water (A) and 0.1 M LA solution (B) over 1, 4, and 8 weeks.

Fig. 7 provides the stress–strain curves obtained from the static tests at a loading rate of 0.1 N min−1. The elastic modulus and stress at 4% strain are summarized in Table 4. The slopes of the linear region of the curves are defined as the modulus of elasticity (E). When the specimens were soaked in water for 1 week, the E of experimental was significantly lower than that of the C0 (p < 0.05). When the specimens were soaked in LA/EtOH solution for 1 or 3 weeks, the mean E of the experimental formulation was not significantly different from the C0 (p < 0.05), with the exception of the 35 wt% TS samples. The mean E of the C0 formulations was similar regardless of storage medium (water or LA/EtOH) or storage time (1 or 3 weeks). Meanwhile, the mean E of the experimental specimens, soaked in LA/EtOH, were significantly higher than that of samples stored in water (p < 0.05). When TS concentration was 5–20 wt%, the failure strain of experimental was comparable with that of the control (p < 0.05).


image file: c6ra09933e-f7.tif
Fig. 7 The stress–strain curves of the control and experimental, (A) samples stored in water for 7 week; (B) samples stored in LA/EtOH solution for 1 week; (C) samples stored in LA/EtOH solution for 3 weeks.
Table 4 Elastic modulus and stress data of the control and experimental
Run ME (MPa) Stress at 4% strain (MPa)
Water 1w LA/EtOH 1w LA/EtOH 3w Water 1w LA/EtOH 1w LA/EtOH 3w
a In the same column indicates the mean is significantly different compared with the C0 (p < 0.05).b In the same row indicates the mean is significantly different compared with the control (the value of water-1w used as the controls, p < 0.05), and with different superscript letter (b or c) indicates that the means difference in the same row is significant with each other (p < 0.05).c In the same row indicates the mean is significantly different compared with the control (the value of water-1w used as the controls, p < 0.05), and with different superscript letter (b or c) indicates that the means difference in the same row is significant with each other (p < 0.05).
C0 962 (35) 974 (21) 997 (29) 22.7 (1.4) 23.7 (0.6) 24.8b (0.8)
HBT-5 889a (43) 948b (23) 1019c (25) 22.4 (1.4) 23.6 (0.5) 25.1b (0.5)
HBT-10 885a (32) 955b (21) 1008c (22) 21.6 (1.1) 23.4b (0.3) 25.3c (0.7)
HBT-15 887a (20) 949b (33) 993c (20) 22.1 (0.3) 23.2b (0.6) 24.7c (0.4)
HBT-20 780a (14) 945b (21) 959b (17) 19.8a (0.4) 23.9b (0.8) 24.4b (0.6)
HBT-35 543a (34) 748a,b (22) 754a,b (40) 14.2a (0.6)


Fig. 8 shows the results of cumulative leachate from the copolymers of control and experimental as a function of incubation time in ethanol at 23 ± 2 °C. With the increase of TS concentration from 0 to 50 wt%, the cumulative release of HEMA decreased from 1187 ± 19 to 30 ± 1 μg mL−1 and the cumulative release of BisGMA decreased from 680 ± 19 to 25 ± 2 μg mL−1. With the increase of TS concentration from 0 to 50 wt%, the percentage of leached HEMA decreased from 13.2 to 0.7 wt% and the percentage of leached BisGMA decreased from 6.2 to 0.1 wt%, respectively. No leached BisGMA was detected in the formulation with 35 wt% TS.


image file: c6ra09933e-f8.tif
Fig. 8 Cumulative release from the dental adhesive copolymers as a function of incubation time in ethanol at 23 ± 2 °C: (A) HEMA and (B) BisGMA (the numbers in the legends are the mean values of the cumulative concentrations and values in the parenthesis are the standard deviations).

Discussion

Photoacid-induced or -catalyzed sol–gel reaction is now recognized as a powerful synthetic approach to prepare silica-based hybrid materials.27,45 In photoacid-catalyzed sol–gel reactions, the onium salts are crucial to the generation of the Brønsted acid, which can catalyze the hydrolysis and condensation of alkoxysilyl moieties through formation of silanol functions and their subsequent condensation. The iodonium salt cannot, however, be directly decomposed under visible light irradiation. The iodonium salt can be decomposed through redox reaction with the amine free radicals which generate phenyl free radicals and Brønsted acids.46–49 The initiation mechanism triggered by visible light irradiation and the polymerization mechanisms are also demonstrated in Scheme 1. The Brønsted acid has been used to initiate the cationic polymerization of epoxy or vinyl ether monomers to prepare interpenetrating polymer network (IPN) structure.32,33,49 Here, the generated photoacid is utilized to catalyze the sol–gel reaction of the methoxysilyl function and initiate the cationic ring-opening polymerization of the epoxide group. In our previous work, the dual polymerization mechanism (free radical polymerization and photoacid-induced sol–gel reaction) has been shown to work for the preparation of self-strengthening adhesive.26 The current investigation, which also utilizes the epoxy function, determined the effect of the triple polymerization mechanism on the network structure and mechanical properties of dental adhesive.

Real-time FTIR is not only useful for monitoring the absorbance band of the C[double bond, length as m-dash]C double bond but also for monitoring the progress of cationic polymerization and sol–gel reactions initiated by the visible-light generated photoacid. In the present study, when TS concentration was lower than 35 wt%, the signal of νsym(–SiO[C with combining low line][H with combining low line]3) was overlapping with that νsym(–CH2) of methacrylate in the FTIR spectra. To clearly show the variation of different functions before and after irradiation, 50 wt% TS (HBT-50) formulation was used to quantitatively characterize the triple polymerization reaction. The free radical photopolymerization behavior of methacrylate has been widely reported by several groups.50–56 The band ratio profile of 1637 cm−1 (C[double bond, length as m-dash]C)/1608 cm−1 (phenyl) was used to monitor the conversion of C[double bond, length as m-dash]C double bond. In the present study, the DC (double bond) of experimental was significantly higher than the control and reached a maximum value when TS was 20 wt%. This result indicated that the C[double bond, length as m-dash]C double bond was efficiently polymerized in the presence of the TS monomer. At the same time, conversion of the methoxysilyl group (stretching band at 2840 cm−1) is the first indication of the hydrolysis. The evolution of the OH stretching intensity may give insight into the silanol (Si–OH) concentration after visible-light irradiation. From Fig. 2B, with the elongation of storage time to 24 h, the intensity of methoxy at 2840 cm−1 decreased with the intensity of OH around 3400 cm−1. It should be noted that this latter band is not totally selective of silanol functions as it was also affected by other hydroxylated molecules: HEMA, H2O or methanol (released during the photoacid-induced sol–gel reaction). From Fig. 2D, the intensity of the characteristic peak of epoxy function at 884 cm−1 decreased during 40 s irradiation and continued to decrease with time. Due to the formation of silanol, the intensity of its characteristic peak at 900 cm−1 gradually increased and overlapped with the epoxy peak, it was therefore hard to quantitatively determine the conversion of the epoxy group.

One interesting feature concerns the discrepancy between the free radical polymerization (C[double bond, length as m-dash]C bond), sol–gel (methoxysilyl) and cationic (epoxy ring-opening) reaction kinetics of HBT-50 formulation. After 40 s irradiation, the hydrolysis of methoxysilyl has barely started (<5%), whereas the C[double bond, length as m-dash]C double bond conversion has reached about 60%, and the conversion of epoxy about 50%. Comparing the downward trend of 2840 and 884 cm−1 before and after light-irradiation, it can be inferred that the cationic polymerization rate was faster than the sol–gel reaction. This result indicated that the protons trapped in the polymethacrylate-based network can efficiently catalyze the epoxy ring-opening polymerization and sol–gel reaction after the visible light was turned off. At the same time, the photoacid-induced sol–gel reaction can be further affirmed by the mass change before and after storage in vacuum oven (due to the evaporation of generated volatile small molecules, such as methanol and water) and also by the DMA data (see ESI Fig. 2 and 3).

DMA data provide information on the relaxation of molecular motions, which are sensitive to the polymer network structure. In this study, the DMA tests were carried out using both standard 3-point bending (for dry condition test) and 3-point bending submersion methods (for wet condition test). In dry conditions, these tests give the bulk mechanical properties of adhesive copolymer while the results acquired in wet conditions are more representative of the copolymer behavior in the oral environment.

Storage modulus defines the energy stored elastically in the materials.57 The storage moduli of commercial dental adhesives ranged from 2–6 GPa at 25 °C in dry conditions.58 In the present study, storage moduli of the control and experimental copolymers were 3.5–4.5 GPa except HBT-35. The storage moduli of the control and experimental copolymers were generally comparable with the storage moduli reported for commercial dental adhesives. With the increase in TS concentration from 5 to 35 wt%, the storage modulus at 37 °C and rubbery moduli (Fig. 3A) were comparable or slightly higher than that of the control. However, the Tg (Fig. 3C) is significantly lower than that of the control (p < 0.05). There are three main reasons: with the increase in TS concentration, (i) number of Si–O–Si bonds generated from photoacid-induced sol–gel reaction increases; (ii) the concentration of crosslinker BisGMA decreases from 55 to 27.5 wt%; and (iii) number of linear polyether chains formed from the epoxy ring-opening cationic polymerization increases. In dental adhesives, crosslinked copolymers have been shown to exhibit better physico-mechanical strength than linear copolymers.59,60 With the decrease in BisGMA concentration, the crosslinking density of the polymethacrylate-based network decreases. However, photoacids were able to initiate the hydrolysis and condensation reaction of methoxysilyl groups, leading to the formation of Si–O–Si linear or Si–O–C crosslinked structures. All in all, the slightly increased rubbery modulus suggested that a highly crosslinked network was obtained in the experimental copolymers.

In the early 1980s, Penczek and Kubisa discovered that the addition of alcohols during the cationic polymerization of oxirane monomers caused the occurrence of the “activated monomer” (AM) propagation mechanism.61,62 In the AM mechanism, reaction of the protonated cyclic ether with the hydroxyl group containing compounds leads to ring-opening that reforms the hydroxyl group, which can affect the network structure of the polymer.63–65 In the present study, in excess of hydroxyl-containing methacrylate monomers (HEMA and BisGMA) and one epoxy function in TS, the cationic polymerization is better viewed as a transfer reaction affording short and non-crosslinked polyether chains. With the increase in TS concentration, the crosslinking density of polymethacrylate-based network decreased while the number and length of polyether chains increased. The result was a concomitant decrease in the glass transition temperature.

Conversely, when all of the samples were soaked in water for 8 weeks and dried again, the storage modulus at 37 °C showed no significant difference from the control (p < 0.05). Also the rubbery modulus and Tg of experimental formulations were significantly higher than that of the control (p < 0.05). These differences may be attributed to the following: first, most of the leachates (such as unpolymerized monomers, hydrophilic oligomers, methanol, etc.) have been removed during the aqueous storage.14,66 Secondly, the pendant C[double bond, length as m-dash]C double bonds are further polymerized and finally, due to the continuance of the sol–gel reaction in wet conditions, a highly cross-linked network structure was obtained. From the full width at half maximum (FWHM) versus temperature plots (see ESI Fig. 4), it can be observed that the experimental formulation with 10–15 wt% TS showed the lowest FWHM, which indicated the network became more homogeneous after storage in the wet environment.

The three-point bending water-submersion clamp method used in this work is expected to simulate the wet environment of the mouth. Increasing the storage time in aqueous media from 1 to 8 weeks provided the opportunity to gain insight regarding the autonomic self-strengthening process. With the increase in storage time, the storage modulus values of the control are similar about 270–315 MPa and the Tg increased by only 3 °C. When the samples were soaked in water, the water penetrates the network and the mobility of polymer chains is enhanced. The “trapped” free radical can further initiate the un-reacted C[double bond, length as m-dash]C double bond which leads to a slight improvement in the crosslink density, and the Tg value shifts to higher temperature.

With the exception of the samples containing 5 wt% TS, the storage modulus values of the experimental formulations at 70 °C were significantly higher than that of the control (p < 0.05). The storage modulus increased with storage time and reached maximum value (nearly 1 GPa) after 8 weeks when the TS concentration was between 15 and 20 wt%. With the addition of TS in the formulations, the “trapped” strong photo-generated Brønsted acid was efficient at driving the sol–gel reaction in wet conditions. The gradually formed Si–O–Si or Si–O–C bonds significantly improved the physico-mechanical strength.

To assess the resistance of the formulations to hydrolytic degradation, the properties were determined following specimen storage in low pH media.67,68 There is limited evidence to support significant degradation of dental adhesives at low pH.10,69 Results suggest that the degradation of resin-based dental materials occurs at similar rates in water, artificial saliva and in neutral to slightly low pH media.1 In our previous report, 1 mM lactic acid solution (LA, pH = 3.50/25 °C) was used to accelerate the degradation of HEMA/BisGMA copolymer. Under these conditions, the DMA results indicated that the mechanical properties of the control exhibited good stability.26

To accelerate the degradation of dental adhesive, 0.1 M LA solution (pH = 2.4/25 °C) was used as the storage solution. The storage modulus of the control in LA solution was slight lower than that in water (Tables 2 and 3). The storage modulus of the control at 70 °C decreased about 15%. This may be attributed to gradual degradation of the polymethacrylate-based network in acidic solution.

In an acidic environment (pH = 2.4/25 °C), the silanol species were likely protonated and the hydrolysis rate of methoxysilyl groups was fast. At the same time, the condensation rate was relatively slow when compared with the neutral conditions,70 which was prone to the formation of branched structure (lower crosslink density region). After 8 weeks storage in 0.1 M LA solution, the lower storage modulus at 70 °C with 5, 10, or 15 wt% TS, compared with that of samples stored in water, supported the formation of branched structure in acidic environment. However, the results appeared contradictory when the TS concentration was over 20 wt%, i.e. higher storage modulus at 70 °C in LA solution. In actuality, with the increase in TS concentration, the amount of unpolymerized epoxy function and the number of silanol groups increased. The higher concentration of silanol groups promote the sol–gel reaction and the epoxy ring-opening reaction, which contributed to the crosslink density. For the experimental formulations stored in acidic solution, the mechanical properties of polymethacrylate-based networks showed a slight decrease, but the newly formed Si–O–Si and/or Si–O–C bonds led to increased crosslink density and there was a gradual improvement in the mechanical properties of the hybrid copolymers.

To further investigate the effect of the self-strengthening process on the mechanical properties of the copolymers, we have performed monotonic stress–strain on the control and experimental formulations in wet conditions. When the samples were soaked in water for 1 week, the modulus of elasticity (E) of experimental formulation was significantly lower than that of the C0 (p < 0.05). After soaking in acidic solution for 1 week, the E values of the experimental were comparable with that of the C0. Due to pH dependence of hydrolysis, condensation, and depolymerization, at low pH (<3), the depolymerization rate decreased over 4 orders of magnitude, while the rate of condensation was low with respect to the rate of hydrolysis.70 Under these conditions, TS monomer may undergo essentially irreversible condensation, which improves the crosslink density of the network. It is apparent in Table 4, with the exception of samples containing TS concentration >20 wt%, the E of the experimental specimen soaked in LA/EtOH for 3 weeks was significantly higher than those samples soaked for 1 week (p < 0.05). When TS is 5–15 wt%, the failure strain is comparable to that of the control (data not published). However, by further increasing TS concentration to 20 or 35 wt%, the specimens became brittle after soaking in acidic solution (failure strain was less than 4% for sample with 35 wt% TS). These results indirectly support the formation of a highly crosslinked network structure.

It is conceivable that under clinical conditions with limited polymerization of the dental adhesive there could be significant leaching of monomers, such as HEMA, into the surrounding tissues. This is concerning since in vitro investigations report that HEMA can induce apoptosis, interfere with DNA synthesis and the production of reactive oxygen species (ROS).71–75 In addition, low concentrations of HEMA can interfere significantly with the expression of type I collagen by gingival fibroblasts.76 In the present study, HPLC results indicated considerable leaching of both HEMA (13.2 wt%) and BisGMA (6.2 wt%) from the control formulation. With the increase of TS concentration, the amount of both HEMA and BisGMA that was leached from the polymer decreased significantly, especially when the TS concentration was 35 wt%. Factors contributing to the differences in leachates include the higher DC of C[double bond, length as m-dash]C bond in the experimental formulations. The most important reason is related to the epoxy ring-opening polymerization and photoacid induced sol–gel reactions. The epoxy groups could react with the hydroxyl groups of HEMA or BisGMA and covalently bond the epoxide network to the polymethacrylate network. Meanwhile, the condensation reaction between the silanol/silanol or silanol/hydroxyl groups of HEMA/BisGMA further inhibited leaching of these species. In our previous study using MPS-containing copolymers, when the MPS concentration was 10 wt%, the leached percentages of HEMA and BisGMA were 3.8 and 2.3 wt%.26 In the present study, the leached percentages of HEMA and BisGMA from the copolymer with 10 wt% TS were 1.8 and 1.8 wt%, respectively. The molar concentration of MPS and TS in the formulation was similar (molecular weights of MPS and TS are 248.35 and 246.38 g mol−1). The lower leached percentage in TS-containing copolymer was mainly attributed to the epoxy ring-opening reaction with hydroxyl groups. Meanwhile, it can be observed that the release rates of HEMA/BisGMA in experimental samples were decreased according to the increase in the TS concentration. Both the epoxy ring-opening and the sol–gel reaction are beneficial in terms of enhancing the crosslink density and reducing the leaching of HEMA and BisGMA.

A schematic illustration of the hybrid network structure after light irradiation is given in Scheme 2. It is usually reported that the curing time is in the range of 30–60 seconds for dental resin polymerization.77–80 We used 40 s for this in vitro study to insure that the different resin formulations could polymerize well. Since the curing time, light source and energy were consistent for all of the formulations, the curing time should not be a major factor influencing the structure and properties of the cured polymers. The concentration of TS monomer in the formulation should be a major factor. Based on the FTIR results, the rate of free radical polymerization is the fastest and the photoacid-induced hydrolysis–condensation is the slowest. When the liquid resin is irradiated by visible-light, the polymethacrylate-based matrix network is formed first by free radical cross-linking polymerization of methacrylate monomers (HEMA and BisGMA). Simultaneously, the generated photoacids can catalyze the epoxy ring-opening polymerization and polyether chains are obtained. Due to the excess amount of hydroxyl groups (HEMA and BisGMA), most of the polyether chains are grafted onto the polymethacrylate chains via the AM mechanism.61,62 The degree of hydrolysis and condensation of methoxysilyl groups (<5%) is very limited during 40 s light-irradiation. After 24 h storage, the newly formed Si–O–Si covalent bonds are limited. The similar rubbery modulus obtained from the DMA in dry conditions (Fig. 3A) supported this proposed mechanism. When the specimens are soaked in water, the mobility of the backbone and side chains is improved due to the plasticizing effect of water. As a result of the increased mobility the opportunity for condensation between silanol groups or ring-opening reactions between the un-polymerized epoxy and silanol groups is enhanced. In summary, the copolymers containing TS showed higher crosslink density after storage in wet conditions.


image file: c6ra09933e-s2.tif
Scheme 2 Proposed polymethacrylate-based matrix network structure and the autonomic self-healing process with different TS concentrations. (A1 and A2) Polymethacrylate-based network formed by free radical polymerization, cationic ring-opening polymerization, and limited photoacid-induced sol–gel reaction in dry conditions after 40 s irradiation; (B1 and B2) photoacid-induced ring-opening polymerization and sol–gel reaction after 24 h; (C1 and C2) self-healing process via sol–gel reaction and ring-opening polymerization in wet environment (the black, red, blue, brown, and yellow lines represent the formed polymethacrylate chain, polyether chain, methoxysilyl group, epoxy group, and silanol group, respectively. The green point stands for the new formed crosslink point after the light irradiation was off).

The self-strengthening hybrid system developed here offers additional opportunities to integrate biological motifs into adhesive design. Biomolecular assisted design of hybrid interfaces that can be coupled into the polymerization scheme may further extend the capabilities of these promising systems. For example, biomolecules may be integrated with the polymeric networks to metabolize the volatile small molecules produced during the photoacid-induced sol–gel reaction. Biomolecular approaches could be further extended to bring bioactivity to the hybrid system to facilitate the integration of the restorative material–tissue interfaces.

Conclusions

With the introduction of epoxy cyclohexyl trimethoxysilane (TS) containing both epoxy and trimethoxysilyl functional groups, a self-strengthening hybrid system has been developed for potential use as a dental adhesive. During visible-light irradiation, a triple polymerization process occurred; the process included free radical, cationic (epoxy ring-opening) polymerization, and photoacid-induced sol–gel reactions. FTIR was used to access the free radical, cationic, and hydrolysis conversion during and after light irradiation. In this triple polymerization system, the free radical polymerization rate was the highest and the sol–gel reaction was the slowest. In acidic environments, the fast hydrolysis reaction of methoxysilyl groups and the limited condensation of silanol groups gave rise to the self-strengthening process, which significantly improved the mechanical properties, especially in wet conditions. When the TS concentration was 10–20 wt%, the copolymers became more homogeneous and the storage modulus at 70 °C reached maximum values. The static stress–strain results indicated that the copolymers with lower TS content (5–15 wt%) were stronger than the control. The HPLC results indicated that the cumulative amounts of leached HEMA and BisGMA were reduced significantly. The self-strengthening dental adhesive offers promise as a material that is both resistant to degradation and leaching of methacrylate monomers.

Acknowledgements

This investigation was supported by Research Grant: R01 DE022054 and R01 DE025476 from the National Institute of Dental and Craniofacial Research, National Institutes of Health-United State, Bethesda, MD 20892.

Notes and references

  1. A. Prakki, R. Cilli, R. F. L. Mondelli, S. Kalachandra and J. C. Pereira, J. Dent., 2005, 33, 91–98 CrossRef CAS PubMed.
  2. F. R. Tay and D. H. Pashley, Am. J. Dent., 2003, 16, 6–12 Search PubMed.
  3. M. Hagio, M. Kawaguchi, W. Motokawa and K. Miyazaki, Dent. Mater. J., 2006, 25, 241–246 CrossRef CAS.
  4. F. L. B. Amaral, V. Colucci, R. G. Palma-Dibb and S. A. M. Corona, Journal of Esthetic and Restorative Dentistry, 2007, 19, 340–353 CrossRef PubMed.
  5. E. L. Kostoryz, K. Dharmala, Q. Ye, Y. Wang, J. Huber, J. G. Park, G. Snider, J. L. Katz and P. Spencer, J. Biomed. Mater. Res., Part B, 2009, 88, 394–401 CrossRef PubMed.
  6. Y. A. Zou, J. L. P. Jessop and S. R. Armstrong, J. Biomed. Mater. Res., Part A, 2010, 94, 187–192 CrossRef PubMed.
  7. L. Tjaderhane, F. D. Nascimento, L. Breschi, A. Mazzoni, I. L. S. Tersariol, S. Geraldeli, A. Tezvergil-Mutluay, M. Carrilho, R. M. Carvalho, F. R. Tay and D. H. Pashley, Dent. Mater., 2013, 29, 999–1011 CrossRef CAS PubMed.
  8. Y. Delaviz, Y. Finer and J. P. Santerre, Dent. Mater., 2014, 30, 16–32 CrossRef CAS PubMed.
  9. A. Gopferich, Biomaterials, 1996, 17, 103–114 CrossRef CAS PubMed.
  10. R. Cilli, J. C. Pereira and A. Prakki, J. Dent., 2012, 40, 1144–1150 CrossRef CAS PubMed.
  11. P. Spencer, Q. Ye, J. Park, E. M. Topp, A. Misra, O. Marangos, Y. Wang, B. S. Bohaty, V. Singh, F. Sene, J. Eslick, K. Camarda and J. L. Katz, Ann. Biomed. Eng., 2010, 38, 1989–2003 CrossRef PubMed.
  12. J. L. Ferracane, Dent. Mater., 2006, 22, 211–222 CrossRef CAS PubMed.
  13. V. Singh, A. Misra, O. Marangos, J. Park, Q. Ye, S. L. Kieweg and P. Spencer, Dent. Mater., 2011, 27, E187–E195 CrossRef CAS PubMed.
  14. R. Parthasarathy, A. Misra, J. Park, Q. Ye and P. Spencer, J. Mater. Sci.: Mater. Med., 2012, 23, 1157–1172 CrossRef CAS PubMed.
  15. A. Misra, R. Parthasarathy, Q. Ye, V. Singh and P. Spencer, Acta Biomater., 2014, 10, 330–342 CrossRef CAS PubMed.
  16. V. Singh, A. Misra, R. Parthasarathy, Q. Ye and P. Spencer, J. Biomed. Mater. Res., Part A, 2015, 103, 646–657 CrossRef PubMed.
  17. V. Singh, A. Misra, R. Parthasarathy, Q. Ye, J. Park and P. Spencer, J. Biomed. Mater. Res., Part B, 2013, 101, 1437–1443 CrossRef PubMed.
  18. F. Abedin, B. Roughton, P. Spencer, Q. Ye and K. Camarda, Comput. Chem. Eng., 2015, 37, 2081–2086 Search PubMed.
  19. A. Ciferri, Polym. Chem., 2013, 4, 4980–4986 RSC.
  20. Y. C. Yuan, X. J. Ye, M. Z. Rong, M. Q. Zhang, G. C. Yang and J. Q. Zhao, ACS Appl. Mater. Interfaces, 2011, 3, 4487–4495 CAS.
  21. E. N. Brown, S. R. White and N. R. Sottos, J. Mater. Sci., 2004, 39, 1703–1710 CrossRef CAS.
  22. M. R. Kessler, N. R. Sottos and S. R. White, Composites, Part A, 2003, 34, 743–753 CrossRef.
  23. S. R. White, N. R. Sottos, P. H. Geubelle, J. S. Moore, M. R. Kessler, S. R. Sriram, E. N. Brown and S. Viswanathan, Nature, 2001, 409, 794–797 CrossRef CAS PubMed.
  24. B. J. Blaiszik, M. M. Caruso, D. A. McIlroy, J. S. Moore, S. R. White and N. R. Sottos, Polymer, 2009, 50, 990–997 CrossRef CAS.
  25. X. B. Ouyang, X. Q. Huang, Q. H. Pan, C. Q. Zuo, C. Huang, X. L. Yang and Y. B. Zhao, J. Dent., 2011, 39, 825–833 CrossRef CAS PubMed.
  26. L. Y. Song, Q. Ye, X. P. Ge, A. Misra and P. spencer, Acta Biomater., 2016, 35, 138–152 CrossRef CAS PubMed.
  27. A. Kowalewska, J. Mater. Chem., 2005, 15, 4997–5006 RSC.
  28. A. Chemtob, D. L. Versace, C. Belon, C. Croutxe-Barghorn and S. Rigolet, Macromolecules, 2008, 41, 7390–7398 CrossRef CAS.
  29. D. L. Versace, A. Chemtob, C. Croutxe-Barghorn and S. Rigolet, Macromol. Mater. Eng., 2010, 295, 355–365 CrossRef CAS.
  30. W. Weinmann, C. Thalacker and R. Guggenberger, Dent. Mater., 2005, 21, 68–74 CrossRef CAS PubMed.
  31. W. Weinmann, T. Luchterhandt, R. Guggenberger, A. Stippschild, S. Then and K. Dede, J. Dent. Res., 2002, 81, A417 Search PubMed.
  32. L. Y. Song, Q. Ye, X. P. Ge, V. Singh, A. Misra, J. S. Laurence, C. L. Berrie and P. Spencer, J. Biomed. Mater. Res., Part B, 2015 DOI:10.1002/jbm.b.33435.
  33. X. P. Ge, Q. Ye, L. Y. Song, A. Misra and P. Spencer, Macromol. Chem. Phys., 2015, 216, 856–872 CrossRef CAS.
  34. X. Guo, Y. Wang, P. Spencer, Q. Ye and X. Yao, Dent. Mater., 2008, 24, 824–831 CrossRef CAS PubMed.
  35. Q. Ye, J. Park, E. Topp and P. Spencer, Dent. Mater., 2009, 25, 452–458 CrossRef CAS PubMed.
  36. J. Park, Q. Ye, E. M. Topp, A. Misra, S. L. Kieweg and P. Spencer, J. Biomed. Mater. Res., Part A, 2010, 93, 1245–1251 Search PubMed.
  37. X. P. Ge, Q. Ye, L. Y. Song, A. Misra and P. Spencer, Dent. Mater., 2014, 30, 1073–1087 CrossRef CAS PubMed.
  38. Y. Cai and J. L. P. Jessop, Polymer, 2006, 47, 6560–6566 CrossRef CAS.
  39. Y. Cai and J. L. P. Jessop, Polymer, 2009, 50, 5406–5413 CrossRef CAS.
  40. Y. Chen, G. L. Li, H. Q. Zhang and T. Wang, J. Polym. Res., 2011, 18, 1425–1429 CrossRef CAS.
  41. J. Y. Kim, P. S. Patil, B. J. Seo, T. S. Kim, J. Kim and T. H. Kim, J. Appl. Polym. Sci., 2008, 108, 858–862 CrossRef CAS.
  42. J. G. Park, Q. Ye, E. M. Topp, A. Misra and P. Spencer, Dent. Mater., 2009, 25, 1569–1575 CrossRef CAS PubMed.
  43. J. G. Park, Q. Ye, E. M. Topp, C. H. Lee, E. L. Kostoryz, A. Misra and P. Spencer, J. Biomed. Mater. Res., Part B, 2009, 91, 61–70 CrossRef PubMed.
  44. V. Singh, A. Misra, O. Marangos, J. Park, Q. A. Ye, S. L. Kieweg and P. Spencer, J. Biomed. Mater. Res., Part B, 2010, 95, 283–290 CrossRef PubMed.
  45. H. De Paz, A. Chemtob, C. Croutxe-Barghorn, D. Le Nouen and S. Rigolet, J. Phys. Chem. B, 2012, 116, 5260–5268 CrossRef CAS PubMed.
  46. Y. B. Bi and D. C. Neckers, Macromolecules, 1994, 27, 3683–3693 CrossRef CAS.
  47. Y. Y. Durmaz, N. Moszner and Y. Yagci, Macromolecules, 2008, 41, 6714–6718 CrossRef CAS.
  48. J. V. Crivello, J. Photopolym. Sci. Technol., 2009, 22, 575–582 CrossRef CAS.
  49. J. V. Crivello, J. Macromol. Sci., Part A: Pure Appl. Chem., 2009, 46, 474–483 CrossRef CAS.
  50. C. Decker, J. Polym. Sci., Part A: Polym. Chem., 1992, 30, 913–928 CrossRef CAS.
  51. K. S. Anseth, C. M. Wang and C. N. Bowman, Polymer, 1994, 35, 3243–3250 CrossRef CAS.
  52. H. J. Naghash, O. Okay and Y. Yagci, Polymer, 1997, 38, 1187–1196 CrossRef CAS.
  53. L. G. Lovell, J. W. Stansbury, D. C. Syrpes and C. N. Bowman, Macromolecules, 1999, 32, 3913–3921 CrossRef CAS.
  54. P. Spencer, Y. Wang, J. L. Katz and A. Misra, J. Biomed. Opt., 2005, 10, 031104 CrossRef PubMed.
  55. G. Q. Wu and J. Nie, J. Photochem. Photobiol., A, 2006, 183, 154–158 CrossRef CAS.
  56. T. R. Aguiar, M. de Oliveira, C. A. G. Arrais, G. M. B. Ambrosano, F. Rueggeberg and M. Giannini, J. Prosthet. Dent., 2015, 113, 128–134 CrossRef CAS PubMed.
  57. D. Papadogiannis, R. S. Lakes, Y. Papadogiannis and K. Tolidis, Dent. Mater., 2013, 29, 693–701 CrossRef CAS PubMed.
  58. S. Ito, M. Hashimoto, B. Wadgaonkar, N. Svizero, R. M. Carvalho, C. Yiu, F. A. Rueggeberg, S. Foulger, T. Saito, Y. Nishitani, M. Yoshiyama, F. R. Tay and D. H. Pashley, Biomaterials, 2005, 26, 6449–6459 CrossRef CAS PubMed.
  59. E. Asmussen and A. Peutzfeldt, Eur. J. Oral Sci., 2001, 109, 282–285 CrossRef CAS PubMed.
  60. G. Odian, Principles of Polymerization, John Wiley & Sons, Inc., Hoboken, New Jersey, 4th edn, 2004 Search PubMed.
  61. S. Penczek, P. Kubisa and R. Szymanski, Makromol. Chem., Macromol. Symp., 1986, 3, 203–220 CrossRef CAS.
  62. M. Bednarek, P. Kubisa and S. Penczek, Makromol. Chem., 1989, 49–60 CrossRef CAS.
  63. M. Sangermano, R. Bongiovanni, A. Priola and D. Pospiech, J. Polym. Sci., Part A: Polym. Chem., 2005, 43, 4144–4150 CrossRef CAS.
  64. M. Sangermano, M. A. Tasdelen and Y. Yagci, J. Polym. Sci., Part A: Polym. Chem., 2007, 45, 4914–4920 CrossRef CAS.
  65. B. Dillman and J. L. P. Jessop, J. Polym. Sci., Part A: Polym. Chem., 2013, 51, 2058–2067 CrossRef CAS.
  66. M. H. Tabatabaei, H. S. Roudsari, S. H. Bassir, T. A. Saeed and H. Hasani, Aust. Dent. J., 2013, 58, 176–182 CrossRef CAS PubMed.
  67. A. J. deGee, S. L. Wendt, A. Werner and C. L. Davidson, Biomaterials, 1996, 17, 1327–1332 CrossRef CAS.
  68. S. Sauro, T. F. Watson, F. R. Tay, S. Chersoni, L. Breschi, F. Bernardi and C. Prati, Dent. Mater., 2006, 22, 671–680 CrossRef CAS PubMed.
  69. J. A. Skupien, A. H. Susin, P. D. M. Angst, R. Anesi, P. Machado, T. Bortolotto and I. Krejci, J. Adhes. Dent., 2010, 12, 435–442 CAS.
  70. C. J. Brinker, J. Non-Cryst. Solids, 1988, 100, 31–50 CrossRef CAS.
  71. H. H. Chang, M. K. Guo, F. H. Kasten, M. C. Chang, G. F. Huang, Y. L. Wang, R. S. Wang and J. H. Jeng, Biomaterials, 2005, 26, 745–753 CrossRef CAS PubMed.
  72. C. T. Hanks, S. E. Strawn, J. C. Wataha and R. G. Craig, J. Dent. Res., 1991, 70, 1450–1455 CrossRef CAS PubMed.
  73. A. Paranjpe, L. C. F. Bordador, M. Y. Wang, W. R. Hume and A. Jewett, J. Dent. Res., 2005, 84, 172–177 CrossRef CAS PubMed.
  74. G. Spagnuolo, V. D'Anto, C. Cosentino, G. Schmalz, H. Schweikl and S. Rengo, Biomaterials, 2006, 27, 1803–1809 CrossRef CAS PubMed.
  75. G. Spagnuolo, C. Mauro, A. Leonardi, M. Santillo, R. Paterno, H. Schweikl, E. V. Avvedimento and S. Rengo, J. Dent. Res., 2004, 83, 837–842 CrossRef CAS PubMed.
  76. M. Falconi, G. Teti, M. Zago, S. Pelotti, L. Breschi and G. Mazzotti, Cell Biol. Toxicol., 2007, 23, 313–322 CrossRef CAS PubMed.
  77. J. Jakubiak, X. Allonas, J. P. Fouassier, A. Sionkowska, E. Andrzejewska, L. A. Linden and J. F. Rabek, Polymer, 2003, 44, 5219–5226 CrossRef CAS.
  78. S. S. Davidson-Kaban, C. L. Davidson, A. J. Feilzer, A. J. de Gee and N. Erdilek, Dent. Mater., 1997, 13, 344–352 CrossRef CAS PubMed.
  79. Q. A. Ye, Y. Wang, K. Williams and P. Spencer, J. Biomed. Mater. Res., Part B, 2007, 80, 440–446 CrossRef PubMed.
  80. J. S. Kim, Y. H. Choi, B. H. Cho, H. H. Son, I. B. Lee, C. M. Um and C. K. Kim, J. Biomed. Mater. Res., Part B, 2006, 78, 115–123 CrossRef PubMed.

Footnote

Electronic supplementary information (ESI) available. See DOI: 10.1039/c6ra09933e

This journal is © The Royal Society of Chemistry 2016