
 Open Access Article
 This Open Access Article is licensed under a
 Creative Commons Attribution 3.0 Unported Licence
Nanosized (Y1−xGdx)2O2S:Tb3+ particles: synthesis, photoluminescence, cathodoluminescence studies and a model for energy transfer in establishing the roles of Tb3+ and Gd3+
Robert
Brüninghoff
b,
Daniel den
Engelsen
a,
George R.
Fern
a,
Terry G.
Ireland
a,
Rupinder
Dhillon
a and
Jack
Silver
*a
aCentre for Phosphor and Display Materials, Wolfson Centre for Materials Processing, Brunel University London, Uxbridge, Middlesex UB8 3PH, UK. E-mail: jack.silver@brunel.ac.uk
bDepartment of Chemical Engineering, Münster University of Applied Sciences, Stegerwaldstrasse, 39, Steinfurt, D-48565, Germany
First published on 29th April 2016
Abstract
Herein we describe the synthesis and spectral analysis of nanosized (Y1−xGdx)2O2S:Tb3+ phosphors between x = 0 and x = 1 with 0.1 and 2 mol% Tb3+. The concentration of Gd3+ was varied in steps of 0.1 (mole ratio Gd3+). X-ray diffraction analyses confirmed the purity and composition of the phosphor materials. The photoluminescence spectra of the series of phosphors with 0.1 mol% Tb3+ showed a colour change of the fluorescence light from blue to green when x was increased from 0 to 1, whereas the samples of the series with 2 mol% Tb3+ yielded essentially green light. These phenomena could be explained in terms of energy transfer from the Tb3+ 5D3-level at 26![[thin space (1/6-em)]](https://www.rsc.org/images/entities/char_2009.gif) 316 cm−1 to the CT-minimum of (Y1−xGdx)2O2S:Tb3+ for the series with 0.1 mol% Tb3+, while for the series with 2 mol% Tb3+ cross relaxation between the 5D3, 7FJ and 5D4 levels of Tb3+ caused additional depopulation of the 5D3-level at low Gd3+ concentrations. Cathodoluminescence spectra recorded at temperatures between −170 °C and 20 °C confirmed the proposed energy flow and enabled the evaluation of the energy barrier for this energy flow. By modelling the energy flow we were able to show that the concentration of Gd3+ is critical in controlling the change in colour of the (Y1−xGdx)2O2S:Tb3+ for the series with 0.1 mol% and that the presence of just over x = 0.1 of Gd3+ is enough to switch to the energy transfer route present in the x = 1.0 parent phosphor. In addition the charge transfer band of (Y1−xGdx)2O2S:Tb3+ showed a red shift of about 6 nm upon increasing x from 0 to 1. This red shift has been described in terms of an electrostatic model that enabled a calculation of the rearrangement of the electrons during the charge transfer.
316 cm−1 to the CT-minimum of (Y1−xGdx)2O2S:Tb3+ for the series with 0.1 mol% Tb3+, while for the series with 2 mol% Tb3+ cross relaxation between the 5D3, 7FJ and 5D4 levels of Tb3+ caused additional depopulation of the 5D3-level at low Gd3+ concentrations. Cathodoluminescence spectra recorded at temperatures between −170 °C and 20 °C confirmed the proposed energy flow and enabled the evaluation of the energy barrier for this energy flow. By modelling the energy flow we were able to show that the concentration of Gd3+ is critical in controlling the change in colour of the (Y1−xGdx)2O2S:Tb3+ for the series with 0.1 mol% and that the presence of just over x = 0.1 of Gd3+ is enough to switch to the energy transfer route present in the x = 1.0 parent phosphor. In addition the charge transfer band of (Y1−xGdx)2O2S:Tb3+ showed a red shift of about 6 nm upon increasing x from 0 to 1. This red shift has been described in terms of an electrostatic model that enabled a calculation of the rearrangement of the electrons during the charge transfer.
1. Introduction
Rare earth element oxysulfide phosphors have been intensely investigated since they were first reported over 70 years ago1 and have found widespread applications for a variety of industrial uses. In particular phosphors based on the host lattices yttrium oxysulfide (Y2O2S) and gadolinium oxysulfide (Gd2O2S) are industrially used. Both were shown to be ideal host lattices for rare earth activator cations. When doped with Eu3+, the Y2O2S lattice yields a red phosphor that has been extensively used for colour television picture tubes.2 In contrast when Tb3+ is used as the dopant in Y2O2S and Gd2O2S, the emission is in the bluish-white or green range3–6 and these phosphors have been exploited for X-ray detection and some CRT applications. The X-ray application is due to their inherent attributes including rather high densities, high radiation stability, high conversion efficiency from X-ray wavelengths to visible light, and rather short decay times.7 Moreover, the properties of the green emitting Gd2O2S:Tb3+ were found to be superior to other, earlier generation X-ray phosphors such as (ZnCd)S:Ag or CaWO4. Both Gd2O2S:Tb3+ and Gd2O2S:Pr3+ phosphors are used for XCT (X-ray computed tomography) as scintillator materials.7,8 Indeed Gd2O2S:Tb3+ is the most frequently employed phosphor in X-ray intensifying screens,9 its high density of 7.44 g cm−3 makes it an effective trap of the incident X-ray photon, allied with this are its further attributes of high intrinsic conversion efficiency (20%) and high quantum yield of Tb3+. Moreover, small particle phosphors with a narrow size distribution offer reduced structure noise in X-ray detection devices as well as facilitating high resolution and high screen weight.10,11 Recently the incorporation of Gd2O2S:Tb3+ into polyethylene microstructures to fabricate flexible scintillators for next-generation flexible X-ray image sensors has been reported. Pixel height and fill factor are two factors that affect the sensitivities of the as prepared scintillators with different pitch.12 Gd2O2S:Tb3+ and Y2O2S:Tb3+ have also been investigated for use in field emission displays (FED) where Y2O2S:Tb3+ was suggested to be a promising phosphor as the green component.13It has been reported that the composition of the lanthanide-based oxysulfide host lattice and the concentration of the Tb3+ dopant cations have a significant influence on the emission colour that can range from blue to green.3–6 The fact that tuning the composition of the phosphors controls the emission wavelength offers interesting opportunities for these phosphors in a range of novel applications as well as for improvements in current applications. A good example is the colour composition of the emitted light which is of great interest for X-ray detection. This is due to the sensitivity of photographic films or photodiodes to achieve high image qualities and good detection signals.7
In this paper, we describe the effects of varying the composition of the host cationic lattice and the Tb3+ doping concentrations on the emission bands in nanometre-sized (Y1−xGdx)2O2S:Tb3+ phosphor particles. The objective for the studies described in this work was to investigate the luminescent properties (especially the colour composition of the emitted light), in particular how the blue and green emission intensity depend on the Y3+/Gd3+ ratio. We previously presented an explanation of the photo luminescence (PL) spectra of Y2O2S:Tb3+ and Gd2O2S:Tb3+;3–6 this work is an extension to (Y1−xGdx)2O2S:Tb3+ materials with different Y3+/Gd3+ ratios. Although several studies on the parent compounds Gd2O2S:Tb3+ and Y2O2S:Tb3+ have been published on the synthesis of nanometre sized phosphor particles this is to our knowledge the first report of such materials having different Y3+/Gd3+ ratios.
2. Experimental
2.1. Sample preparation
Nanometre sized (Y1−xGdx)2O2S:Tb3+ phosphor particles (x values in the range 0 to 1 with 0.1 increments) with activator concentrations of 0.1 and 2 mol% were synthesized using a procedure based on the urea homogenous precipitation method that we have previously described3,4,10,13 and subsequent calcination at 900 °C. The 2 mol% Tb3+ sample series was also re-fired at 1100 °C. The following chemicals were used in this study: yttrium oxide and terbium oxide (99.99%, Neomaterials, UK) and gadolinium oxide (99.99%, Ampere Industrie, France); nitric acid (AnalaR, Fisher Scientific, UK), urea (99.9%, Fisher Scientific, UK), sulfur (99.5%, Sigma Aldrich, UK) and sodium carbonate (98%, Alfa Aesar, UK). All chemicals supplied were used without further purification.The precipitation step required the addition of 25.0 mL stock solution [Y(NO3)3 + Gd(NO3)3] for the host lattice ions and 25.0 mL Tb(NO3)3 for the 2 mol% Tb3+ series or 1.25 mL Tb(NO3)3 for the 0.1 mol% Tb3+ series respectively. The stock solutions were diluted to 500 mL with deionised water in a 1 litre beaker, heated to a temperature of 100 °C and 15 g urea was then added. The concentration of the rare earth (RE) ions amounted to 0.025 mol L−1 and the urea to 0.5 mol L−1. When turbidity was observed, the solutions were aged for a period of 1 hour; the resulting white precipitates were then filtered (without cooling) using vacuum filtration. The powder was washed three times with deionised water (∼50 mL) and placed in an oven to dry at a temperature of 100 °C for 24 h giving white powders. The yield of the precursor material was in the range between 1.4 and 2.4 g, depending on the Gd3+ content.
In the calcination step the precursors converted into oxysulfides. For calcination the precursor powders were initially mixed with a mortar and pestle for about 5 min with Na2CO3 (1.5 mole ratio) and sulfur (2 mole ratio), then packed into the bottom of an alumina crucible. To protect the bottom layer from oxidation during the calcination it was capped off with a cover layer. The cover layer consisted of mixed Y2O3, Gd2O3, Na2CO3 and sulfur. The total molar concentration of oxides was equal to molar concentration of the respective precursors. Furthermore, the ratio of Y2O3 and Gd2O3 was adjusted to the respective Y3+/Gd3+ ratio of the precursors. The same molar concentration of Na2CO3 and sulfur to the bottom layer was used in the cover layer. Each sample was calcined in a furnace and annealed for 1 h at 900 °C. After cooling the bottom layer was separated from the cover layer and ground with a mortar and pestle. To purify the obtained phosphor powders the ground samples were washed in approx. 70 mL deionised water at 100 °C for 20 min. Afterwards the phosphors were filtrated without cooling and washed 3 times with approx. 50 mL deionised water using vacuum filtration and were oven dried at ca. 100 °C. The yields of the obtained phosphors were about 1 g depending on the Y3+/Gd3+ ratio. The resulting oxysulfide phosphor powders had a white-beige colour.
A second annealing at higher temperature enhances the crystallinity and should additionally lead to a higher luminance.3 Therefore the obtained phosphor powders were packed in alumina boat crucibles and placed in a quartz tube for the annealing step. To prevent the phosphors from oxidising a nitrogen atmosphere was used for the entire annealing process. The quartz tube was sealed with quartz wool at the opening and purged for a period of 20 min before placing in a tube furnace at 450 °C. The temperature was then increased to 1100 °C and held for 1 h whereupon the temperature was decreased to 800 °C and finally the quartz tube was removed from the furnace and allowed to cool down to room temperature while still purging with nitrogen: the nitrogen flow was 200 cm3 min−1 during the entire annealing process. The samples were finally carefully ground with a mortar and pestle. The second firing step was carried out only for the 2 mol% Tb3+ series.
2.2. X-ray powder diffraction
X-ray powder diffraction (XRPD) of the samples was performed using a Bruker D8 Advance X-ray powder diffractometer fitted with a copper source and LynxEye silicon strip detector. The diffractometer was calibrated using an aluminium oxide line position standard from Bruker and the LaB6 NIST SRM 660a line profile standard. The emission of the nickel filtered Cu source and hence the instrumental line broadening was determined by fitting the NIST standard using the TOPAS version 3 software package of Bruker. The samples were scanned from 5 to 100° (2θ) for 35 minutes in step scan mode.The morphology and particle size of the samples were recorded with a field emission scanning electron microscope (FESEM) using a Zeiss Supra 35 VP (Jena, Germany) microscope. FESEM images were collected at 20000 and 100000 magnification. The samples did not require a conductive coating.
The elemental composition of individual particles was studied by energy dispersive analysis using X-rays (EDX) using an Oxford Instruments INCA energy 350 microanalysis suite (High Wycombe, UK).
2.3. Photoluminescence spectra
PL spectra were measured with a Bentham Instruments dual monochromator system. Emission spectra were recorded in the range of 300 nm to 800 nm. The CIE coordinates were calculated from the spectra according to the 1931 CIE standard for colorimetry.2.4. Electron microscopy and cathodoluminescence spectra
The nanosized Gd2O3S:Tb3+ sample was also analysed with a TEM, model 2100F, JEOL, (Japan). This microscope was operated in scanning mode with a spot size of either 0.2 nm or 1.5 nm. The TEM was equipped with a Vulcan™ CL detector, Gatan, USA, for imaging and spectroscopic purposes. This system used a Czerny–Turner spectrometer with back-illuminated CCD and a grating with 1200 lines per mm (blazed at 500 nm) for collection of CL emission spectra. A cooled photo-multiplier tube (PMT) was utilized for collection of the total light flux from the sample. By collecting the visible light with the Vulcan system simultaneously with the JEOL high angle annular dark field detector it was possible to observe the visible light that was emitted from the particles. A small cryostat connected to the sample holder enabled cooling of the samples in the TEM down to 102 K (−171 °C); adjustment of the sample temperature anywhere between 102 and 303 K could be made.2.5. Particle size analysis
The particle size of the samples was determined from the FESEM images (magnification 100000) using Able image analyser software (Mu Labs, Ljubljana, Slovenia); a population of 100 particles was measured.
3. Results and discussion
3.1. X-ray powder diffraction
The crystal symmetry of the Ln2O2S (Ln = Y, Gd) lattice is trigonal, and the space group is P![[3 with combining macron]](https://www.rsc.org/images/entities/char_0033_0304.gif) 1. Each Ln atom is bonded to four oxygen atoms and three sulfur atoms and has a seven-coordinated geometry. Both Ln and oxygen atoms have the same site symmetry of C3v and the S site has D3d-symmetry.14,15
1. Each Ln atom is bonded to four oxygen atoms and three sulfur atoms and has a seven-coordinated geometry. Both Ln and oxygen atoms have the same site symmetry of C3v and the S site has D3d-symmetry.14,15
In Fig. 1a XRPD patterns of the 2 mol% Tb3+ series calcined at 900 °C are presented. An increase of the 2θ angle with increasing Y3+ concentration is apparent. This was expected and is consistent with smaller spacing due to the smaller ionic radius of Y3+ (0.90 Å) as compared to Gd3+ (0.94 Å). The regular substitution of Gd3+ into the (Y1−xGdx)2O2S:Tb3+ lattices causes equal systematic increases in the unit cell sizes that can be better seen in Fig. 1b which presents an enlarged view of the main peak about 30° (2θ). This finding was observed for every reflecting atomic plane in all samples. The XRPD pattern of the re-fired series (2 mol% Tb3+, 1100 °C) and of the 0.1 mol% Tb3+ series calcined at 900 °C gave similar results.
 | ||
| Fig. 1 (a) XRPD pattern of the 2 mol% Tb3+ (Y1−xGdx)2O2S:Tb3+ phosphor family calcined at 900 °C. (b) Enlarged view of the main peak around 30° (2θ). | ||
Comparison with previous work3–6 confirmed the crystal phases for all 100% Y3+ and 100% Gd3+ samples, viz. Y2O2S or Gd2O2S respectively. Furthermore, no evidence for other phases such as sulfates or oxysulfates was found. Lattice parameters of the (Y1−xGdx)2O2S:Tb3+ phosphor family were calculated with the Topas software. Fig. 2 shows the linear relation of the lattice parameters a and c as a function of the Gd3+ concentration for the 2 mol% Tb3+, 900 °C series. Diagrams are similar for the other sample series (2 mol% Tb3+, 1100 °C; 0.1 mol% Tb3+, 900 °C). An increase of the lattice parameter depending on the Gd3+ concentration is observed as expected due to the larger ionic radius for the Gd3+ cations. The obtained lattice parameters are in good agreement with data published in the literature as indicated in Table 1. Because of the linear relation between the lattice parameters a (Fig. 2a) and c (Fig. 2b) versus the composition parameter x, it can be concluded that the prepared oxysulfide phosphors had the expected Y3+/Gd3+ ratios.
 | ||
| Fig. 2 Linear relation of the lattice parameters a (in (a)) and c (in (b)) versus the composition parameter χ of 2 mol% Tb3+ (YχGd1−χ)2O2S:Tb3+ fired at 900 °C. | ||
| RE oxysulfide | Firing temp. (°C) | Particle size | a/Å | c/Å | Ref. |
|---|---|---|---|---|---|
| a Values from europium doped Y2O2S. b 2 mol% Tb3+. c 0.1 mol% Tb3+. | |||||
| Y2O2S | 1100 | Bulk | 3.776a | 6.538a | 16 |
| Y2O2S:Tb3+ | 900 | ∼100 nm | 3.7856(1) | 6.5880(1) | 3 |
| Y2O2S:Tb3+ | 900 | ∼100 nm (max. < 1 μm) | 3.7857b, 3.7846c | 6.5872b, 6.5850c | This study |
| Y2O2S:Tb3+ | 1100 | ∼100 nm (max. < 1 μm) | 3.7922b | 6.5935b | This study |
| Gd2O2S | 1200 | Bulk | 3.8514(5) | 6.667(2) | 17 |
| Gd2O2S:Tb3+ | 900 | ∼100 nm | 3.8539(1) | 6.6668(1) | 3 |
| Gd2O2S:Tb3+ | 1100 | ∼100 nm | 3.8542(6) | 6.6677(1) | 3 |
| Gd2O2S:Tb3+ |
900 | ∼100 nm (max. < 1 μm) | 3.8518b, 3.8519c | 6.6635b, 6.6632c | This study |
| Gd2O2S:Tb3+ |
1100 | ∼100 nm (max. < 1 μm) | 3.8530b | 6.6659b | This study |
The crystallite size of the (Y1−xGdx)2O2S:Tb3+ phosphors was evaluated with the Topas-XRD software. For all of the series it was found that the crystallite size increased more or less linearly with the composition parameter x from approximately 70 nm for Y2O2S:Tb3+ to 145 nm for Gd2O2S:Tb3+.
3.2. Field emission scanning electron microscopy
In Fig. 3(a–f) FESEM images are shown for 100/0, 50/50 and 0/100 Y3+/Gd3+ ratio of the 2 mol% Tb3+ series (a–d) calcined at 900 °C and (e and f) calcined at 1100 °C. It can be seen that the particles of all samples are sub-micrometre sized. | ||
| Fig. 3 (a & b) Y2O2S:Tb3+ phosphor particles 2% Tb3+, 900 °C, (c & d) (Y0.50Gd0.50)2O2S:Tb3+ phosphor particles 2% Tb3+, 900 °C, and (e & f) Gd2O2S:Tb3+ phosphor particles 2% Tb3+, 1100 °C. Magnification (a, c, & e) 20k× and (b, d & f) 100k×. | ||
The majority of the particles are in the range of about 50–150 nm and show nearly spherical morphologies with smooth surfaces. These small particles appear to be discrete and are not sintered together. However, particles in the range of approx. 0.3–1.0 μm are polyhedra; these are present for every Y3+/Gd3+ ratio. An increase of bigger particles (0.3–1.0 μm range) with increasing Gd3+ concentration can be observed. It appears that the samples with higher Gd3+ concentrations show a wider particle size distribution. In addition energy dispersive X-ray spectroscopy (EDX) was carried out on several samples to confirm the elemental composition of individual particles with differing morphologies. Some smaller particles (∼100 nm) were investigated alongside larger polyhedra (∼1 μm). The results were in a good agreement with the expected Y3+/Gd3+ ratios and showed similar composition for both kinds of particle sizes. We have previously shown histograms of similar Y2O2S:Tb3+ phosphor particles and Gd2O2S:Tb3+ phosphor particles.3 FESEM images of the 0.1 mol% Tb3+ sample series calcined at 900 °C are not shown but are all similar to those shown in Fig. 3(a to d). From FESEM samples re-fired at 1100 °C (of the 2 mol% Tb3+ series) it was concluded that the particle size and morphology did not change significantly.
3.3. Photoluminescence spectra
In Fig. 4a and b photoluminescence (PL) excitation spectra of (Y1−xGdx)2O2S:Tb3+ for the 2 mol% Tb3+ and 0.1 mol% Tb3+ series respectively calcined at 900 °C are presented. For reasons of clarity only the spectra for x = 0, 0.3, 0.6 and 1 are presented in Fig. 4a and b. | ||
| Fig. 4 PL excitation spectra of (Y1−xGdx)2O2S:Tb3+ (x = 0, 0.3, 0.6 and 1) calcined at 900 °C and monitored at 545 nm with 2 mol% Tb3+ (a) and with 0.1 mol% Tb3+ (b). | ||
Fig. 5a and b show deconvolutions of the spectra of (Y1−xGdx)2O2S:Tb3+ at x = 0.7 with six Gaussian profiles, indicated by p1, p2, …, p6. For these deconvolutions a least squares fit was carried out using Microsoft's solver tool, as described in our earlier work.18,19 It can be seen that the CT-band of (Y1−xGdx)2O2S:Tb3+, consisting of the profiles p1, p2, p4 and p5, exhibits a red shift upon increasing the Gd3+ content (increasing x).
 | ||
| Fig. 5 Deconvolution of excitation spectrum of (Y1−xGdx)2O2S:Tb3+ with x = 0.7 and 2 mol% Tb3+ (a) and with x = 0.7 and 0.1 mol% Tb3+ (b) with six Gaussian profiles. | ||
The red shifts of the main components of the band, p2 and p4, are shown in Fig. 6a and b. The excitation spectra of the re-fired series (1100 °C) are similar and are not shown here. The excitation band p2 at 264 nm to 270 nm is the charge transfer (CT) band that is ascribed to the host lattice, whereas p4 at 288 nm to 292 nm is due to 4f8 → 4f75d Tb3+ transitions.20,21
 | ||
| Fig. 6 Red shift of the p2 and p4 components of the CT-band of (Y1−xGdx)2O2S:Tb3+ (calcined at 900 °C) monitored at 545 nm with 2 mol% Tb3+ (a) and with 0.1 mol% Tb3+ (b). Dashed curves (polynomials) have been fitted to the experimental points. | ||
The red shift for x = 0 (100% Y3+) to x = 1 (100% Gd3+) of the CT-band (p2) of the 2 mol% Tb3+ series according to Fig. 6a is −5.5 nm (from 264.1 nm to 269.6 nm), which is equivalent to 772 cm−1 (from 37864 cm−1 to 37092 cm−1) or 0.096 eV (from 4.695 eV to 4.599 eV). The total red shift of the 4f8 → 4f75d Tb3+ transition (p4) of the same series is significantly smaller, viz. −3.9 nm (from 287.9 nm to 291.8 nm): this illustrates the different nature of the p2 and p4 bands. The integrated absorption of the bands represented in Fig. 7a and b provides more evidence for the different natures of the p2 and p4 bands. In these latter figures the modest contributions of p1 and p5 have been added to the integrated absorption of the p2 and p4 bands respectively. The slopes of the p2 (+p1) and p4 (+p5) lines in Fig. 7b are significantly different, whereas in Fig. 7a these are more equal. The effect of the Tb3+ concentration is largest for the 4f8 → 4f75d Tb3+ transition (p4 + p5) band: the integrated absorption for this band increased with a factor of about 12 (15.5 for x = 0 and 8.8 for x = 1) when the Tb3+ is increased from 0.1 mol% to 2 mol%: this is a factor of 20.
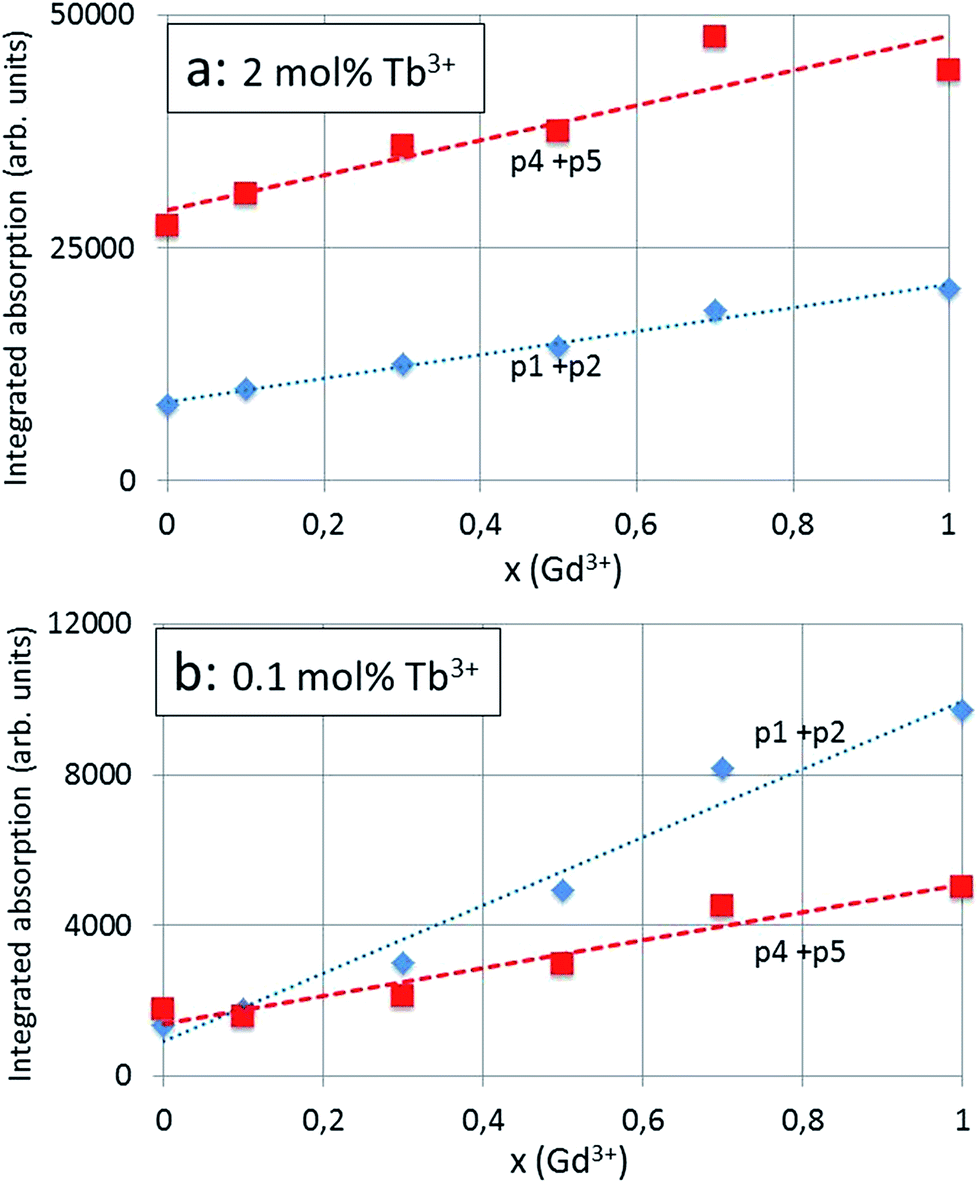 | ||
| Fig. 7 Integrated absorption of CT-band components of (Y1−xGdx)2O2S:Tb3+ (calcined at 900 °C) monitored at 545 nm with 2 mol% Tb3+ (a) and with 0.1 mol% Tb3+ (b). Dashed curves (polynomials) in (b) have been fitted to the experimental points. | ||
Because of starting saturation at 2 mol% Tb3+, the integrated absorption factor is lower, although it is not clear why this is different for x = 0 (100% Y3+) and x = 1 (100% Gd3+). The ratio between the integrated absorption of the CT-band (p2 + p1 band) for the 2 mol% Tb3+ and 0.1 mol% is much less than 20, showing the different behaviour of this component of the excitation spectrum, namely the less strong dependency of the CT-band upon the concentration of the spectral active rare earth ion, that is Tb3+.
It is important to mention that the excitation spectra presented in Fig. 4a and 5a were not normalised and were not based on quantitative measurements; however, all measurements were carried out in the same way: measurement conditions and sample volumes were kept equal. The low spread of the points around the curves in Fig. 7a and b illustrates the consistency of the measurements and the deconvolutions for the calculation of the integrated radiances.
Fig. 5a and b show that the rather weak absorption lines at 277 nm (p3) and 314 nm (p6) are clearly noticeable, whereas in Fig. 4a and b these are hardly noticeable due of the dominant absorption of the higher Tb3+ concentration. These two narrow absorption bands cannot be observed at x = 0 (100% Y3+) and do not show a red shift when x increases; therefore, we may ascribe these bands to 8S → 6I (277 nm) and 8S → 6P (314 nm) of the Gd3+ ion.20,21 It should be mentioned that because of the dominance of the Tb3+ absorption in Fig. 4a, the Gd3+ lines are dwarfed with respect to the total absorption; for that reason we could not evaluate the position of p3 and p6 in the deconvolution of the excitation spectrum, but these transitions, i.e. wavelength, amplitude and width, were added manually based on the results shown in Fig. 5b. The limited resolution of the recorded spectra did not allow the determination of the accompanying Gd3+ lines, which are weaker.20
Fig. 8a shows the emission spectra of (Y1−xGdx)2O2S:Tb3+ (calcined at 900 °C) with 2 mol% Tb3+ and Fig. 8b with 0.1 mol% Tb3+ excited at 270 nm.
 | ||
| Fig. 8 Emission spectra of (Y1−xGdx)2O2S:Tb3+ for x = 0 (blue) and x = 1 (red) and 2 mol% Tb3+ excited at 270 nm (a) and for 0.1 mol% Tb3+ (b). H in (b) indicates the normalised maximum spectral radiance of the 5D3 → 7F5 transition. | ||
All spectra have been normalised to the 5D4 → 7F5 transition of Tb3+ at 545 nm. Fig. 8a and b show a large difference: in Fig. 8a the spectral radiances of the 5D3 → 7FJ transitions between 380 and 480 nm are small compared to the that of the 5D4 → 7F5 transition, whereas in Fig. 8b the spectral radiances of the 5D3 → 7FJ transitions are stronger than that of the 5D4 → 7F5 transition at x = 0 (100% Y3+) and these decrease substantially when x increases.
Fig. 9a and b represent the CIE-1931 colour diagrams indicating the colour change in going from x = 0 to x = 1 in (Y1−xGdx)2O2S:Tb3+ in steps of 0.1. The colour changes from blue to green in Fig. 9b (0.1 mol% Tb3+), whereas in Fig. 9a (2 mol% Tb3+) the colour remains essentially green, because the change of the spectral radiance of the 5D3 → 7FJ transitions is modest, as can be seen in Fig. 8a.
 | ||
| Fig. 9 CIE-1931 colour diagrams indicating the colour change in going from x = 0 to x = 1 in steps of 0.1 for (Y1−xGdx)2O2S:Tb3+ with 2 mol% Tb3+ (a) and 0.1 mol% Tb3+ (b). | ||
From the total red shift of the CT-band (p2) represented in Fig. 6a it can be concluded that the CT-level in Gd2O2S:Tb3+ is lower than in Y2O2S:Tb3+. Based on this red shift and the considerations in our previous work,3 a configuration diagram is proposed in Fig. 10. This diagram will be used to explain the results shown in Fig. 4–8. A detail of the configuration diagram is represented in Fig. 10b. A configuration coordinate diagram for Y2O2S:Eu3+ was published by Fonger and Struck;22 this diagram was used by Ratinen in discussing the energy flow in Gd2O2S:Tb3+.23
 | ||
| Fig. 10 Configuration diagram of Y2O2S:Tb3+ and Gd2O2S:Tb3+. The configuration coordinate for the 7FJ and 5DJ levels is indicated as equal for reasons of clarity. (a): CT-levels of Y2O2S:Tb3+, Gd2O2S:Tb3+ have different coordination coordinates. Arrows 1 and 2 indicate radiationless energy transfer. Detail of diagram (a) is shown in (b). Vibrational energy levels are indicated for the 5D3 level. | ||
Let us first consider Fig. 10a: upon exciting Tb3+ in the ground state (7F6) with 37864 cm−1 or 37092 cm−1 the CT-levels of Y2O2S:Tb3+ or Gd2O2S:Tb3+ respectively at the configuration coordinate of 7FJ are reached. The minima of these CT-levels are lower than 37092 cm−1 at different configuration coordinates. In ref. 3 and 5 it has been assumed that the CT-minimum of Gd2O2S:Tb3+ is lower than the 5D3 level. This means that, if the activation energy for energy transfer from the Tb3+ 5D3-level at 26316 cm−1 to the CT-minimum of Gd2O2S:Tb3+ is not high, energy will be transferred at room temperature, as indicated by arrow 1 in the configuration diagram shown in Fig. 10a. From there, non-radiative energy can trickle down to the Tb3+ 5D4 level at 20661 cm−1, indicated by arrow 2. It is assumed that the minimum of the CT-level of Y2O2S:Tb3+ is higher than the Tb3+ 5D3-level; hence, the 5D3-level cannot feed the CT-level of Y2O2S:Tb3+ at cryogenic temperatures. However, at room temperature vibrational states with quantum number ν > 1 will be populated according to a Boltzmann distribution as illustrated in Fig. 10b. This will allow, even for Y2O2S:Tb3+, a small, non-zero, flow of energy from the 5D3 Tb3+ state to the CT-state of Y2O2S:Tb3+. Fig. 10b also shows that when the Gd3+ concentration of (Y1−xGdx)2O2S:Tb3+ increases, the flow of energy from the 5D3 Tb3+ state to the CT-state will be facilitated, because the CT-level is going down as a function of x. In other words, for x < 0.3 mole ratio Gd3+ there is hardly any flow of energy, whereas as x > 0.4 the energy flow increases strongly. This phenomenon is responsible for the strong 5D3 → 7FJ transitions in (Y1−xGdx)2O2S:Tb3+ at 0.1 mole ratio Tb3+ and x < 0.3: it explains the spectral changes of Fig. 8b with the low Tb3+ concentration of 0.1 mol%. The dominating green emission at the high Tb3+ concentrations of 2 mol% shown in Fig. 8a is due to the cross relaxation between adjacent Tb3+ ions.3,5 This process is illustrated by the following equation:
| Tb3+(5D3) + Tb3+(7F6) → Tb3+(5D4) + Tb3+(7F0) | (1) |
Because of this cross relaxation, the blue emission arising from the 5D3 state diminishes and the green emission arising from the 5D4 level increases.
In Fig. 10b it has schematically been indicated by the numbers 1, 2 and 3 that the activation energy EA for energy transfer from the 5D3 Tb3+ state to the CT-state of (Y1−xGdx)2O2S:Tb3+ is decreasing upon increasing x. Let's assume that EA(x) is a linear function of the Gd3+ mole ratio x according to:
| EA(x) = E0A − αx | (2) |
| H = SeEA(x)/kT | (3) |
 | ||
| Fig. 11 (a) Normalised amplitude of 5D3 → 7F5 transition at 418 nm versus Gd3+ concentration. Points are experimental values; the dashed lines are calculated with eqn (3). (b) EA for the two Tb3+ series, no. 1 for 0.1 mol% Tb3+ and no. 2 for 2 mol% Tb3+ are indicated as a function of x. EA−1 and EA−2 are expressed in eV. The insert of (a) is a linear plot of H418 (line 1) versus Gd3+ concentration. | ||
It is interesting to compare the reduction of the activation energy with the red shift of 0.13 eV of the CT-band (0.1 mol% Tb3+ series) as shown in Fig. 6b. The red shift of the CT-band refers to a different configuration coordinate than that of the activation energy as indicated in Fig. 10a and b. However, the difference of only a factor of 2 indicates that a consistent picture of the charge transfer has been described in the preceding paragraphs.
We shall now turn our attention to the configuration diagram of Fig. 12, which shows an alternative flow of energy in (Y1−xGdx)2O2S:Tb3+. It was suggested by da Silva et al.20 that energy from the 6I- and the 6P-levels of Gd3+ could be transferred to the highest energy levels of the Tb3+ 4f75d or 4f8 configuration in Gd2O2S:Tb3+. This flow of energy cannot be excluded a priori and is represented in the diagram of Fig. 12 by arrows 1 and 2. Instead of feeding the Tb3+ 4f75d state it is assumed that the energy trickles down radiationless to the CT-state of Gd2O2S:Tb3+ (arrow 2 at x = 1) or the CT-state of Y2O2S:Tb3+ (arrow 1 at x = 0). Since the level of 6IGd3+ is higher than the minima of both CT-states, energy may flow to both states at almost equal rates, if the activation energies allow so. At low Gd3+ concentration the CT-level of (Y1−xGdx)2O2S:Tb3+ is higher than the 5D3-level at 26313 cm−1: hence, the 5D3-level can be fed (arrow 3); however, at high Gd3+ concentration the CT-level of (Y1−xGdx)2O2S:Tb3+ is below the 5D3-level and the flow to the 5D3-level is blocked. In this situation energy will be transferred to the 5D4-level as shown by arrow 4.
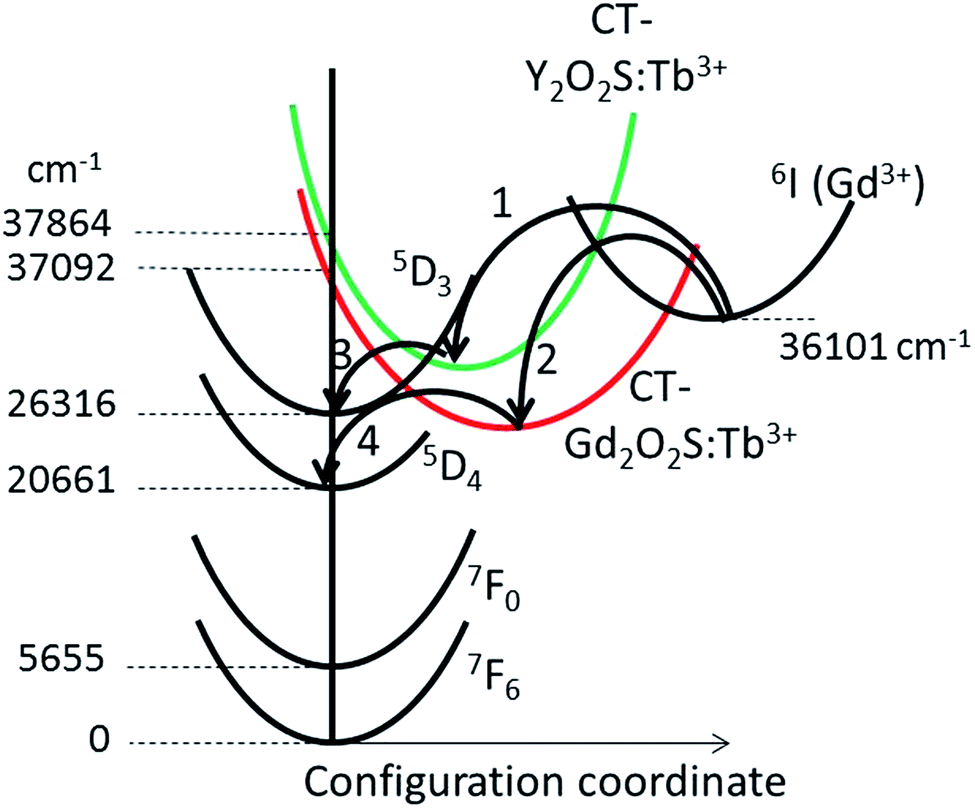 | ||
| Fig. 12 Configuration diagram of Y2O2S:Tb3+ and Gd2O2S:Tb3+. Configuration coordinates of CT-levels of Y2O2S:Tb3+, Gd2O2S:Tb3+ and 6I Gd3+ levels are different. Arrows 1, 2, 3 and 4 indicate radiationless energy transfer. | ||
The important feature of both energy transfer processes depicted in the Fig. 10a and 12 is the red shift of the CT-band of (Y1−xGdx)2O2S:Tb3+ when x increases. The minimum of the CT-level sinks below the 5D3-level of Tb3+: this latter energy level is hardly changing upon changing the composition, as may be concluded from Fig. 8. In the configuration diagrams in Fig. 10 barriers between the minima of the various states have been indicated: in other words, the radiationless transfers of energy indicated by arrow 1 in Fig. 10a or arrows 1 and 2 in Fig. 12 have activation energies and could thus exhibit an Arrhenius-type-rate behaviour. At low temperature this flow energy will therefore largely be blocked and thus, we expect much stronger blue emission at cryogenic temperatures than that indicated in Fig. 8a, which refers to room temperature. In the next section we shall argue that the energy flow represented in Fig. 12 is more likely than the flow represented in Fig. 10a.
3.4. Cathodoluminescence spectra
Fig. 13a shows cathodoluminescence (CL) spectra of Gd2O2S:Tb3+ with 2 mol% Tb3+ recorded in the TEM at temperatures between −170 °C and 20 °C. The energy of the electron beam was 200 keV. It can be seen in Fig. 13a that at low temperatures the spectral radiance of the 5D3 → 7F5 Tb3+ transition is much larger than at room temperature. Hence, it can indeed be concluded that at low temperature the energy flow indicated by arrow 1 in Fig. 10a is largely blocked. At low temperature the fluorescence colour of Gd2O2S:Tb3+ is bluish, which changes to green upon increasing the temperature. In the alternative scheme of Fig. 12 the flow represented by arrow 2 must be largely blocked at low temperatures. Fig. 13b shows that the temperature behaviour of the 5D3 → 7F5 Tb3+ transition in Gd2O2S:Tb3+ is described by two processes, at low temperatures with an activation energy (EA) of 0.0061 eV and at temperatures > 0 °C with EA = 0.116 eV, which is about 20 times larger. | ||
| Fig. 13 (a) Overlay of CL-spectra of Gd2O2S:Tb3+ with 2 mol% Tb3+ at various temperatures (indicated in °C) between 400 and 500 nm, normalised with respect to the spectral radiance of the 5D4 → 7F5 Tb3+ transition at 545 nm. (b) Arrhenius plot of the normalised radiance of the 5D3 → 7F5 Tb3+ transition at 418 nm. | ||
The spectral radiances represented in CL and PL spectra of the same material are usually different because of the different excitation mechanisms. Notwithstanding this difference, it is interesting to compare the activation energies in Fig. 11b and 13b at x = 1 (100% Gd3+). For the 2 mol% Tb3+ in Fig. 11b we find 0.08 eV, whereas the high temperature activation energy in Fig. 13b is 0.12 eV. Since the error bar for the latter value is considerable, ±0.02 eV, the agreement between the PL-based activation energy and the CL-based value is satisfactory. The two values of EA represented in Fig. 13b could indicate that the two routes for energy flow depicted in Fig. 10a and 12 respectively are simultaneously taking place, one at high temperatures, the second at low temperatures. PL-spectra recorded at cryogenic temperatures could probably provide the missing data.
Another point arising from this work and our previous studies5,6 is the realisation that only around 10 mol% Gd3+ substitution (that is an x value of 0.1 in the (Y1−xGdx)2O2S:Tb3+ for a Tb3+ concentration of 0.1 mol%) is sufficient to change the energy transfer mechanism to that found in the pure Gd2O2S:Tb3+ parent compound. This is already shown in the inset of Fig. 11a, but more clearly it follows from the fact that in Y2O2S:Tb3+ the spectral radiance of the 5D3 → 7FJ Tb3+ transitions does not change with temperature with respect to the spectral radiance of the 5D4 → 7F5 transition.5 This is the reason why we think that the energy flow depicted in Fig. 12 is more likely than the energy transfer mechanism represented in Fig. 10a. The activation energy model presented in eqn (2) and (3) can easily deal with this view by setting α = 0 for 0 < x < 0.1 in (Y1−xGdx)2O2S:Tb3+. The results presented in Fig. 11 have not been adapted for this parameter change, because the effect is very small. Furthermore, as the change in unit cell size for an x value of 0.1 in the (Y1−xGdx)2O2S:Tb3+ is very small (see Fig. 2) it is obvious that these changes shown in Fig. 11 are based on electronic structure rather than lattice size. This causes a gradual change of the CT-level and the corresponding change of the flow of energy. From Fig. 11 the decrease of the blue emission intensity is apparent for Gd3+ contents greater than 10 mol%. This implies an exponential depopulation of the excited electrons in the 5D3 level with increasing Gd3+ concentrations above 10%, described by eqn (3) and shown in the inset of Fig. 11a.
3.5. Redshift of CT-band
Recently we have introduced an electrostatic model in terms of the Madelung energy of the transferred charge that could quantitatively describe the red shift of the CT-band in Y2O3:Eu3+.24 This model will now be applied to the data presented in Fig. 6a and 7a. The Madelung energy EM of an ionic lanthanide oxysulfide Ln2O2S can be written as:24 | (4) |
m1 lattice and dLn–O is the shortest distance between the lanthanide ion and the oxygen anions. When dLn–O is expressed in nm, EM is given in eV. The Madelung constant for hexagonal Ln2O2S is 24.179.25 The charge transfer during excitation of a photon can be represented by the following reaction:| Ln2O2S + hν → 2O2−(1−ε/2) + S2−(1−ε/2) + 2Ln3+(1−ε/2) + 3ε(h + e) | (5) |
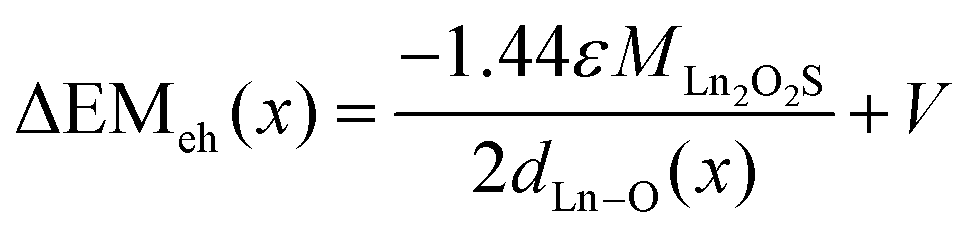 | (6) |
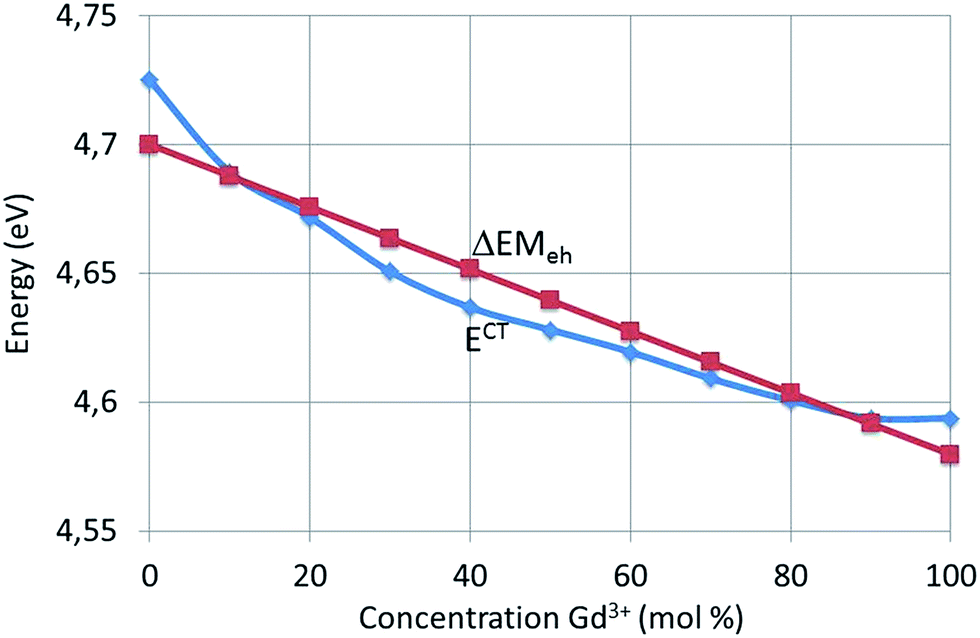 | ||
| Fig. 14 E CT (experimental data) and ΔEMeh as a function of Gd3+ concentration for (Y1−xGdx)2O2S:Tb3+. | ||
The Y–O distance in Y2O2S:Eu3+ is 0.223 nm (ref. 15) and for Y2O2S:Tb3+ with 0.1 mol% Tb3+ the same distance will be taken. From the data represented in Fig. 2a and b it can be concluded that the lattice of Gd2O2S:Tb3+ has been dilated by a factor of 1.055, which means that the Gd–O distance in Gd2O2S:Tb3+ is 0.226 nm. For 0 < x < 1 a linear interpolation of dLn–O has been made, in accordance with the linear variation of the lattice constants as shown in Fig. 2. The best fit ΔEMeh(x) curve shown in Fig. 14 refers to ε = 0.12. The ΔEMeh(x) curve in Fig. 14 does not describe the curvature of the experimental ECT. In ref. 24 we have suggested that this could be caused by a difference in compressibility between the Y2O2S:Tb3+ and the Gd2O2S:Tb3+ lattices. In this reference we have already mentioned that the proposed electrostatic model in terms of the Madelung energy leads to a similar result as the chemical shift model proposed by Dorenbos.26,27 The difference is that in our treatment the transferred charge ε is an adaptable parameter, whereas Dorenbos prefers a screening distance, which appears in the denominator of an equation that is similar to eqn (6).
The red shift ΔECT from Y2O2S:Tb3+ to Gd2O2S:Tb3+ amounts to 0.13 eV, which is much smaller than the red shift from Y2O3:Eu3+ (0.1 mol% Eu3+) to Eu2O3, which is 0.45 eV, while the Madelung constants of (Y1−xEux)2O3 and (Y1−xGdx)2O2S:Tb3+ are almost equal. In the case of (Y1−xEux)2O3 we found 0.33 for ε, whereas in (Y1−xGdx)2O2S:Tb3+ it is almost a factor of 3 smaller. This illustrates that an analysis in terms of the Madelung energy provides a new tool to describe the red shift of the CT-band in phosphors: a large red shift of the CT-band indicates a large rearrangement of charges in the lattice.
4. Conclusions
The most important result coming out of this work is the detailed model for the energy flow that explains the colour change of the fluorescence light from blue to green when x is increased from 0 to 1 in (Y1−xGdx)2O2S:Tb3+ with 0.1 mol% Tb3+. In fact, we have suggested two routes of radiationless energy flow, one from the Tb3+ 5D3-level at 26316 cm−1 to the CT-minimum of Gd2O2S:Tb3+ and the other from the 6I- and the 6P-levels of Gd3+ to the same level: the CT-minimum of Gd2O2S:Tb3+. CL spectra recorded at various temperatures confirmed these models for energy flow. Since no preferred flow schedule can be selected from the presented data, we conclude that both schedules are taking place, one dominating at low temperatures and the other dominating at high temperatures. The proposed flow of energy in (Y1−xGdx)2O2S:Tb3+ with 0.1 mol% Tb3+ explains qualitatively the colour change, while cross relaxation between the 5D3, 7FJ and 5D4 levels of Tb3+ in the 2 mol% Tb3+ series caused additional depopulation of the 5D3-level at low Gd3+ concentrations, leading to the prevailing green colour of the fluorescence light. The colour change of (Y1−xGdx)2O2S:Tb3+ upon changing the temperature offers new opportunities to optimize scintillators for X-ray detection in X-ray computed tomography. Furthermore, by modelling the energy flow it has been shown herein that the concentration of Gd3+ is critical in controlling the change in colour of the (Y1−xGdx)2O2S:Tb3+ phosphors for the series with the Tb3+ concentration 0.1 mol% and that the presence of just over x = 0.1 of Gd3+ is enough to switch to the energy transfer route present in the x = 1.0 parent phosphor.
The red shift of the CT-band of (Y1−xGdx)2O2S:Tb3+ upon increasing x can adequately be described with an electrostatic model in terms of the Madelung energy. This model provides a simple method to evaluate quantitatively the rearrangement of the electrons during the charge transfer transitions in phosphors doped with lanthanide ions.
Acknowledgements
We are grateful to the EPSRC and the Technology Strategy Board (TSB) for funding the PURPOSE (TP11/MFE/6/I/AA129F; EPSRC TS/G000271/1), CONVERTED (JeS no. TS/1003053/1) and PRISM (EP/N508974/1) programs. We are also grateful to the TSB for funding the CONVERT program.References
- J. J. Pitha, A. L. Smith and R. Ward, J. Am. Chem. Soc., 1947, 69, 1870 CrossRef CAS.
- L. Ozawa, Cathodoluminescence-Theory and Applications, Kodansha/VCH, Tokyo, Japan/Weinheim, Germany, 1990 Search PubMed.
- X. Yan, G. R. Fern, R. Withnall and J. Silver, Nanoscale, 2013, 5, 8640 RSC.
- X. Yan, G. R. Fern, R. Withnall and J. Silver, Nanoscale, 2013, 5, 1091 RSC.
- J. Silver, X. Yan, G. Fern and N. Wilkinson, Proceedings of the 20th International Display Workshops, IDW'13, 2013, p. 823 Search PubMed.
- G. R. Fern, X. Yan, N. Wilkinson and J. Silver, Proceedings of the 20th International Display Workshops, IDW'13, 2013, p. 820 Search PubMed.
- N. Miura, in Phosphor Handbook, ed. S. Shionoya, W. M. Yen and H. Yamamoto, CRC press, Boca Rotan, Florida, 2nd edn, 2006, ch. 7 Search PubMed.
- G. Blasse and B. C. Grabmaier, Luminescent Materials, Springer-Verlag, Berlin, 1994 Search PubMed.
- C. W. E. van Eijk, Phys. Med. Biol., 2002, 47, R85 CrossRef PubMed.
- G. R. Fern, T. Ireland, J. Silver, R. Withnall, A. Michette, C. McFaul and S. Pfauntsch, Nucl. Instrum. Methods Phys. Res., Sect. A, 2009, 600, 434 CrossRef CAS.
- N. Kalivas, L. Costaridou, I. Kandarakis, D. Cavouras, C. D. Nomicos and G. Panayiotakis, Nucl. Instrum. Methods Phys. Res., Sect. A, 2002, 490, 614 CrossRef CAS.
- I. D. Jung, M. K. Cho, S. M. Lee, K. M. Bae, P. G. Jung, C. H. Lee, J. M. Lee, S. Yun, H. K. Kim, S. S. Kim and J. S. Ko, J. Micromech. Microeng., 2009, 19, 015014 CrossRef.
- J. Silver, R. Withnall, P. J. Marsh, A. Lipman, T. G. Ireland and G. R. Fern, SID Int. Symp. Dig. Tech. Pap., 2005, 36, 594 CrossRef CAS.
- W. H. Zachariassen, Acta Crystallogr., 1949, 2, 57 CrossRef.
- O. J. Sovers and T. Yoshikoka, J. Chem. Phys., 1968, 49, 4945 CrossRef CAS.
- A. Abdel-Kader and M. M. Elkholy, J. Mater. Sci., 1992, 27, 2887 CrossRef CAS.
- W. H. Zachariasen, Acta Crystallogr., 1949, 2, 60 CrossRef CAS.
- D. den Engelsen, P. G. Harris, T. G. Ireland, G. Fern and J. Silver, ECS J. Solid State Sci. Technol., 2015, 4, R145 CrossRef CAS.
- D. den Engelsen, P. G. Harris, T. G. Ireland, G. Fern and J. Silver, ECS J. Solid State Sci. Technol., 2015, 4, R105 CrossRef CAS.
- A. A. da Silva, M. A. Cebim and M. R. Davolos, J. Lumin., 2008, 128, 1165 CrossRef.
- E. I. Gorokhova, V. A. Demidenko and O. A. Khristich, J. Opt. Technol., 2003, 70, 693 CrossRef CAS.
- W. H. Fonger and C. W. Struck, J. Chem. Phys., 1970, 52, 6364 CrossRef CAS.
- H. Ratinen, Phys. Status Solidi A, 1972, 12, 447 CrossRef CAS.
- D. den Engelsen, T. G. Ireland, R. Dhillon, G. Fern, P. G. Harris and J. Silver, ECS J. Solid State Sci. Technol., 2016, 5, R59 CrossRef CAS.
- Q. C. Johnson and D. H. Templeton, J. Chem. Phys., 1961, 34, 2004 CrossRef CAS.
- P. Dorenbos, Phys. Rev. B: Condens. Matter Mater. Phys., 2012, 85, 165107 CrossRef.
- P. Dorenbos, ECS J. Solid State Sci. Technol., 2013, 2, R3001 CrossRef CAS.
| This journal is © The Royal Society of Chemistry 2016 |