Pulsatile release from pH triggered imidazoline switchable surfactant liposomes†
Dylan Y. Hegh,
Sean M. Mackay and
Eng Wui Tan*
Department of Chemistry, University of Otago, Dunedin, New Zealand. E-mail: ewtan@chemistry.otago.ac.nz; Tel: +64 3 4797926
First published on 9th June 2016
Abstract
The incorporation of an imidazoline (IDZ) based switchable surfactant into the lipid membrane of a liposome produces a system that can be triggered to release its solute upon pH change. However, unlike traditional pH-triggered controlled release systems, IDZ–liposomes are capable of undergoing multiple triggering events, resulting in solute release in a pulsatile manner. Furthermore near-total release can be achieved incrementally with temporal control. A mechanism for this reversible behaviour is also proposed, and dependence on the physical properties of the surfactant is discussed.
1. Introduction
Liposomes have been widely investigated for the applications in systemic1 and topical drug2 delivery due to their ability to impart control over the release profile of a therapeutic agent. Tremendous progress has been made in the development of liposome-based systems since their discovery, for their ability to encapsulate a therapeutic agent and target it to specific tissue types; however content release is generally achieved via passive means.3 Thus there is a growing demand for the design of liposome-based systems which incorporate mechanisms to facilitate on-demand release of the encapsulated contents.Stimuli-responsive liposomes are one potential avenue in meeting this challenge.4 These systems possess a switchable moiety, for example, an additional constituent or structural modification to the lipid comprising the membrane, which can be activated via the application of a trigger. Numerous stimuli have been investigated to activate liposome systems, generally utilizing a change in conditions, such as pH,4 temperature,5 or CO2 levels,6 or an external input of energy, for example light,7 oscillating magnetic fields,8 or ultrasound.9,10 These systems generally release their contents entirely, either all at once or in a slow continuous fashion. More sophisticated stimuli-responsive liposomes are those that have been adapted to exhibit a pulsatile release profile, through repeated triggering of a reversible switch, providing enhanced temporal control over drug release. Examples include the addition of near infrared absorbing gold nanoparticles to the liposome surface11,12 and the addition of a UV activated azobenzene moiety to cholesterol.13
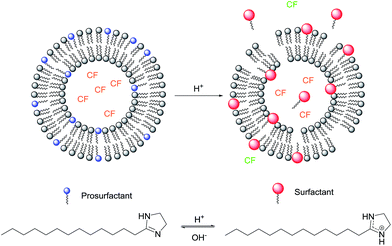
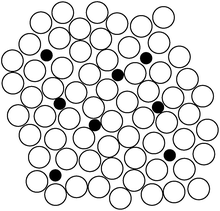
One method to increase the permeability and, thereby induce the release of an encapsulated solute, is through the use of surfactants.14–16 A recent extension of this strategy for achieving surfactant mediated controlled release from liposomes is through the incorporation of a switchable surfactant.6 A switchable surfactant (SS) can be reversibly converted, typically via a chemical or photochemical trigger, into a “prosurfactant” (PS), whose amphiphilicity is greatly diminished, with an associated increase in lipophilicity. This enhanced lipophilic nature allows the prosurfactant to reside benignly within the liposome membrane, until it is “switched” to the surfactant form, via the application of a trigger, inducing solute release, for example the self-quenching fluorescent dye carboxyfluorescein (CF) as shown in Fig. 1.
A number of systems have previously been described incorporating SSs with weakly basic,6,17 acidic,18 or cleavable head groups,19 where activation of these systems is primarily achieved through a change in pH (Fig. 1). Typically, liposomes incorporating SS with ‘classical’ architecture of alkyl tail and charged head group release a fraction of the total encapsulated solute upon application of the trigger. Incorporation of classical PS in greater quantities to induce additional release is unfeasible as PS incorporation above 20 mol% generally inhibits stable liposome formation.20,21 Alternatively, it has been suggested by Asokan (2005)17 that an increase in the head group polarity of SS results in greater membrane permeabilisation. However, despite the use of the very hydrophilic N,N-dimethylacetamidine (DMA) head group by Hegh et al. (2014)6 which resulted in greater solute release, a single triggering event was found to release up to 40%, after which the system was found to be irreversible.
To this end, it is reported herein the development, characterization, and behaviour of a stimuli-responsive liposome system incorporating a SS which contains IDZ as the head group (Fig. 1). The system can be triggered repeatedly to release CF in a pulsatile manner providing increased release with greater temporal control, which may be useful for pH-triggered topical delivery of bioactives to the skin.
2. Results and discussion
2.1 Characterisation of the system
To ascertain the effect of PS incorporation on bilayer permeability CF encapsulated 0–20 mol% C13IDZ–liposomes were heated at pH 12.4 and the CF leakage was estimated by measuring the change in fluorescence. All liposome formulations exhibited approximately the same characteristic temperature until a temperature was reached at which all the profile, with leakage slowly increasing with increasing remaining encapsulated CF rapidly leaked (Fig. 2). Where these profiles departed from one another was in the temperature at which the leakage occurred, with increasing C13IDZ inducing in a translocation of the leakage profiles to increasingly lower temperatures resulting in significant CF release (>10%) occurring earlier (Fig. 2). This suggests that the incorporation of increasing amounts of C13IDZ results in an increase in the permeability of the bilayer and accounts for the inability to form stable liposomes above 20 mol% C13IDZ. However, despite the increased permeability of liposomes containing ≤20 mol% C13IDZ, leakage at 25 °C was negligible enabling additional experimentation to proceed at this temperature (Fig. 2).
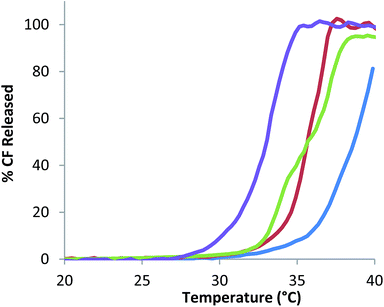 | ||
| Fig. 2 Percentage CF release from 0% (blue), 5% (red), 10% (green) and 20% (purple) C13IDZ incorporated liposomes with increasing temperature (0.7 °C min−1). | ||
The apparent pKa (pKa(app)) of 20 mol% C13IDZ–liposomes was determined to be 6.7, which is significantly less than the pKa of 8.3 measured for the free surfactant in solution (ESI 2.5.†). This is consistent with the observation that lipophilic forms of pH sensitive amphiphiles are stabilised within a bilayer with a subsequent reduction in pKa on the order of between 1 and 1.5 units.25 The pKa(app) also gives an estimation of parameters required for incorporation of C13DMA (pH > 8.7) and activation which is restricted by CF fluorescence to no lower than pH 5.5.
The concentration of surfactant required to saturate a 1 mmol L−1 liposome suspension was found from OD measurements to be 0.31 mmol L−1 (ESI 2.3.†). At this saturation concentration the membrane water partition coefficient (Psatmem/w) of C13IDZ·HCl was calculated to be 1.6. This suggests that provided the surfactant concentration remains below saturation (∼30% of the DPPC concentration) the majority of the surfactant should remain in the bilayer after PS activation.16
The effect of triggering, by decreasing the pH to 6.0, on the stability of 20% C13IDZ–liposomes was investigated using DLS and passive leakage of CF with increasing temperature. By DLS, no significant change in the size of C13IDZ–liposomes was observed after activation (ESI 2.4.†). Furthermore, the PDI remained below 0.20 suggesting that the liposomes remained monodisperse and that surfactant induced fusion, which has been observed in other surfactant–liposome suspensions,26–28 was not significant in this system.
Finally, these liposome suspensions appear unremarkable optically and by DLS with an absence of smaller micelles (<10 nm). The lack of any significant changes in the suspension is thought to be because at a maximum of 20 μmol L−1 the C13IDZ·HCl concentration was not high enough to induce liposome solubilisation, which is typically observed in the mmol L−1 concentration range for surfactants.27,29–32
2.2 Triggered CF release
The effect on CF release from liposomes incorporating varying amounts of C13IDZ (0, 5, 10 and 20 mol%) upon a decrease of pH, from pH 12.4 to 6.0 (significantly below the pKa) was investigated and compared to that of a previously published SS C14DMA.6 The rate of release was monitored over 250 seconds as no appreciable increase in the percentage release was observed after this interval (ESI 3.3.†). For those liposomes incorporating C13IDZ, the majority of release was observed to have occurred over the first 75 seconds, after which the rate of release decays significantly until a constant rate is attained (Fig. 3(A)). In contrast, no significant CF release was observed from the control liposomes (Fig. 3(A)).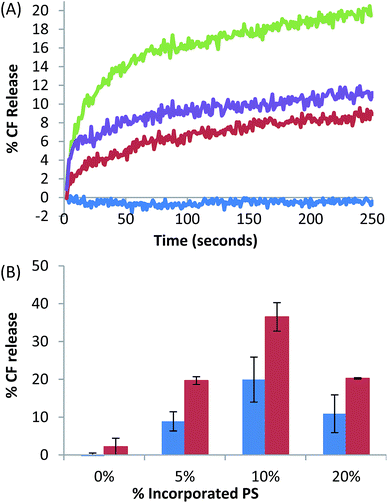 | ||
| Fig. 3 (A) Percentage CF release over 250 seconds from liposomes incorporated with 0% (blue), 5% (red), 10% (green) and 20% (purple) C13IDZ induced by the addition of HCl to change the pH of the suspension from 12.4 to 6.0. (B) Total% CF release after 250 seconds from 0, 5, 10 and 20% C13IDZ–(blue) liposomes induced by switching the pH from 12.4 to 6.0, which is compared to previously investigated PS C14DMA6 (red) which was switched from pH 12.4 to 7.4. Error bars = ±SEM (n = 3). | ||
The total amount of CF released was proportional up to 10 mol% C13IDZ, which exhibited a maximum release of approximately 20%, with an increase of C13IDZ to 20 mol% CF release declined to 11% (Fig. 3(B)). The CF release trend with amount of C13IDZ incorporated is consistent with that observed previously for C14DMA–liposomes, although the amount of CF release at comparable PS concentrations is typically 10% lower (Fig. 3(B)).6
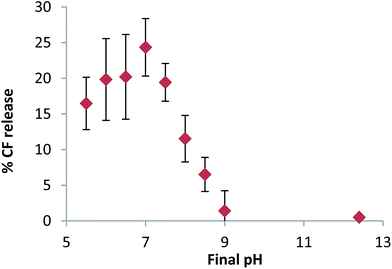
In order to optimise the magnitude of CF release the final pH of the system was investigated. From an initial pH of 12.4 the target pH was adjusted to give varying final pH values and the total percentage of CF released from 10% C13IDZ–liposomes was measured after 250 seconds. Significant CF release was observed to occur at a final pH as high as 8.5, which increased with decreasing final pH to reach a maximum of 24% at pH 7.0 (Fig. 4). Continued decreases in final pH, to as low as 5.5, did not liberate additional CF (Fig. 4).
The concentration of C13IDZ (in the μmol L−1 range) is well below the CMC of C13IDZ·HCl (5.5 mmol L−1) and the critical concentration at which liposome solubilisation is observed (ESI 2.1.†), which is confirmed by the absence of micelles and presence of liposomes in DLS measurements of the system after switching. The mechanism of triggered solute release is therefore believed to occur not by solubilisation, but rather due to a rearrangement of the surfactant in the membrane after activation of C13IDZ, where the surfactant either remains incorporated within the lipid bilayer, ejected monomerically into the aqueous phase, or a combination of these two effects leading to CF release.
2.3 Multiple triggering
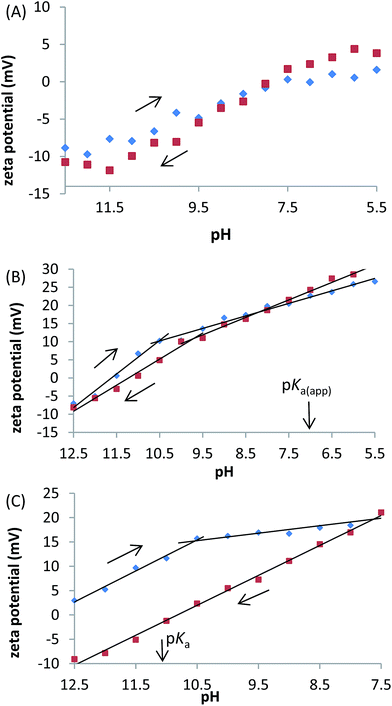
Unlike the control liposomes, the PS systems also exhibited biphasic behaviour with a period of constant substantial change in zeta potential at higher pH, followed by a period of reduced zeta potential change at lower pH (Fig. 6). The biphasic behaviour occurs in both directions for C13IDZ whereas it is only observed upon acidification for C14DMA. Furthermore, the intercept occurs between pH 10.0 and 10.5 in both systems and is therefore not obviously correlated to the pKa(app) of either system.
Despite their structural similarity, C13IDZ·HCl is less hydrophilic (Psatmem/w 1.0 vs. 1.66) than C14DMA·HCl. It is thought that the reversible nature of the C13IDZ trigger arises from the reduced hydrophilicity resulting in the majority of the activated SS remaining in the bilayer. This is supported by the observation that the zeta potential measurements of C13IDZ– and C14DMA–liposomes where the former exhibits a biphasic profile at similar zeta values during both basification and acidification whereas the latter exhibits a monophasic profile at significantly lower zeta values during basification. Lower zeta potential values during basification suggests ejection of charged C14DMA·HCl from the bilayer with the system not returning to equilibrium which is consistent with the previous observation that C14DMA–liposomes are limited to a single release event with repeated switching6 (Fig. 6).
The loss of biphasic character of the C14DMA zeta profile during basification suggests that it is a SS mediated process. However, a biphasic profile is thought not an indication of the initiation SS protonation or deprotonation, as the inflection points of both C13IDZ and C14DMA zeta profiles occur at a similar pH (10.5–9.5) and are not correlated with their respective pKas (Fig. 6). Instead, the similarity in the inflection points is thought to be the result of a sudden change in lipid packing with pH33 which, in this case, relies on the presence of a single tailed amphiphile in the membrane as the control liposomes do not exhibit biphasic zeta potential behaviour (Fig. 6(A)).
The location of an inflection point in the zeta potential profile also occurs at a similar pH (9.5–10.5) to the pH at which CF release is first detected (9.0), which is observed for both C13IDZ– and C14DMA–liposomes despite their dissimilar pKa values (Fig. 6). Furthermore, increasing zeta potential values at higher pH values (>10.5) strongly implies PS protonation which occurs in the absence of CF leakage (Fig. 4 and 6). This suggests that the bilayer arrangement at lower pH values is required for SS triggered CF release.
The C13IDZ–liposomes were observed to release a reduced amount of CF compared to the C14DMA liposomes, however the relationship between the amount of CF released and the concentration of PS incorporated shows a similar profile (Fig. 3). The decline in CF release from 10 to 20% PS in both systems suggests that the SS has a stabilising effect on the bilayer similar to that of cholesterol, whose incorporation in specific quantities is found to reduce bilayer permeability by inducing conformational ordering of lipid chains preserving lateral diffusion, increasing bilayer thickness and mechanical strength, resulting in reduced solute leakage.34,35
From 10–20% PS the additional C13IDZ would possibly have a reduced ability to increase bilayer permeability. It is thought that on a molecular level, PS activation should induce rearrangement in the neighbouring lipid molecules, via a combination of an increase in head group area, shuttling along and ejection from the bilayer (Fig. 7). Given ideal mixing, at 10 mol% C13IDZ each PS is on average surrounded by as few as 10 DPPC molecules and thus only 1.5 head group radii (Fig. 8). Due to the close proximity of the PS molecules to one another in the bilayer, at higher concentrations, the influence of its activation on the surrounding lipid would be expected to diminish as the lipid molecules have already been perturbed or rearranged to the greatest extent by an adjacent surfactant.
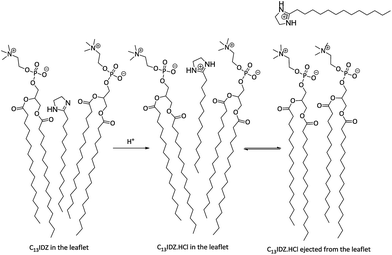 | ||
| Fig. 7 Protonation of C13IDZ PS resulting in shuttling and ejection of the surfactant from the bilayer. | ||
3. Conclusion
Liposomes incorporating the PS C13IDZ were formulated which can be activated by pH change to the surfactant form and, in the process, disrupt the bilayer, triggering release of encapsulated CF. Unlike SS–liposome systems previously investigated, these liposomes exhibited pulsatile release behaviour of the contents, providing temporal control with the added benefit of greater release. The behaviour of which was attributed to the hydrophobicity of C13IDZ·HCl, preventing ejection from the bilayer and resulting in a reversible system.4. Experimental section
4.1 Materials
All chemical reagents for synthesis were of analytical grade, obtained Sigma-Aldrich (St. Louis, MO, USA) and used without further purification. 1,2-Dipalmitoyl-sn-glycero-3-phospho-choline (DPPC) was purchased from Avanti Polar Lipids (Alabaster, AL, USA). 5,6-Carboxyfluoroscein was obtained from Molekula (Dorset, UK). C14DMA and C14DMA·HCl was available from a previous investigation.64.2 SS synthesis
C13IDZ was synthesised by a method adapted from Mannheimer (1968)36 and Shi and Gu (1997)37 where tetradecanoic acid is refluxed with a slight excess ethylene diamine in toluene until no water was produced (24–36 h) (ESI 1.1.†). To form C13IDZ·HCl, HCl(g) was bubbled through a hot ethereal solution of C13IDZ until a precipitate formed.4.3 Surfactant characterisation
The critical micelle concentration (CMC) of C13IDZ·HCl was determined using conductivity as described previously.6 The critical micelle temperature (CMT) of C13IDZ·HCl was determined using the visual observation method described by Weers (1991).38The pKa of C13IDZ·HCl was experimentally determined via pH titration using a Mettler Toledo MP220 pH Meter (referenced to pH 4.0 and 9.2). A stock solution (4 mL) of C13IDZ·HCl was prepared at a concentration of 1 mmol L−1 (below the CMC) using Milli-Q™ water and thermostated at 25 °C. The initial pH of the resulting solution was recorded and sequential additions of 10 μL of a 0.01 mol L−1 NaOH solution were made, recording the change in pH upon each addition. The pKa was determined from the derivative of the titration curve (graph of dpH against volume of NaOH) at half the equivalence point.
4.4 Liposome preparation
Liposomes consisting of 6 mmol L−1 DPPC, 5 mol% cholesterol, and incorporating varying amounts (0, 5, 10 and 20 mol%) of C13IDZ, were prepared. Lipids, in chloroform, were mixed in a round bottom flask and the solvent was removed in vacuo over one hour to produce a dry thin lipid film. The lipid film was rehydrated with 1 mL phosphate buffer (20 mmol L−1, pH 12.4) containing 100 mmol L−1 CF. To ensure complete rehydration, whilst avoiding saponification, solutions was heated for short periods (<1 min) to between 45 and 50 °C, above the gel to liquid-crystal phase transition of DPPC (41 °C)39 and vortexed until absence of the lipid film on the glass was observed. Unilamellar liposomes of high homogeneity were formed by extruding the solution 11 times through an Avanti® Mini-Extruder (Avanti Polar Lipids Alabaster, AL, USA), heated to 50 °C, fitted with a 1000 nm polycarbonate membrane, and a further 11 times through a 200 nm membrane.The unentrapped CF was separated from the liposomes using a Sephadex® G-100 column and phosphate buffer (20 mmol L−1, pH 12.4) as the eluant. The liposome fraction was collected and the DPPC concentration was determined using the Stewart assay40 whereupon the concentration was adjusted to 1 mmol L−1 with phosphate buffer pH 12.4. To ensure consistent results the final suspension was then subjected to any further measurements within four hours of being collected.
4.5 Partitioning of surfactant into liposomes
The membrane water partition coefficient (Pmem/w) of C13IDZ·HCl was calculated by measuring the optical density (OD) of a DPPC liposome suspension during surfactant mediated solubilisation using the method outlined by de la Maza and Parra (1995)41 (ESI 2.3.†). OD measurements were taken at 350 nm in duplicate on an Asus UVM3HO plate reader in Immuno 96 Microwell™ Plates (Nunc) over a range of DPPC concentrations (0.5, 1.0, 1.5, 2.0 mmol L−1) to which increasing amounts of C13IDZ·HCl were added, to give a total volume of 200 μL (ESI 2.3.†). The concentration of surfactant was increased until a decrease in OD drop followed by stabilisation was observed. Before measurement, the mixtures were equilibrated for 1 h at room temperature.4.6 CF release assay
For each measurement, 100 μL of the CF loaded liposome suspension (pH 12.4) was added to a quartz fluorescence cuvette filled with 2.9 mL of phosphate buffer (20 mmol L−1) at the desired pH (9.0, 8.5, 8.0, 7.5, 7.0, 6.5, 6.0, 5.5). The resultant suspension was thoroughly mixed for 1 second by aspirating and expelling with a pipette. The sample temperature within the fluorimeter was maintained at the desired temperature using a Tectron Bio-100 adjustable thermostat controlled heating unit. The fluorescence intensity of the CF (Ex. 465 nm, Em. 520 nm) was then recorded in a on a LS50B luminescence fluorimeter (Perkin-Elmer) at a scattering angle of 90°. To determine the initial fluorescence, the fluorescence intensity over the 10 seconds directly after addition and mixing of the liposome suspension from this data the fluorescence at T = 0 was determined. After 250 seconds 100 μL of a solution of 10% T-X 100 was added to the liposome suspension to lyse the liposomes, releasing all remaining encapsulated CF. Fluorescence intensity was again measured after lysis, and corrected for dilution (ESI 3.2†). CF fluorescence intensity is both pH dependent and not linear with concentration, thus the raw fluorescence values were converted to CF concentration using the pH appropriate standard curve (ESI 2.3.†). The % CF release was calculated by the following equation;
 | (1) |
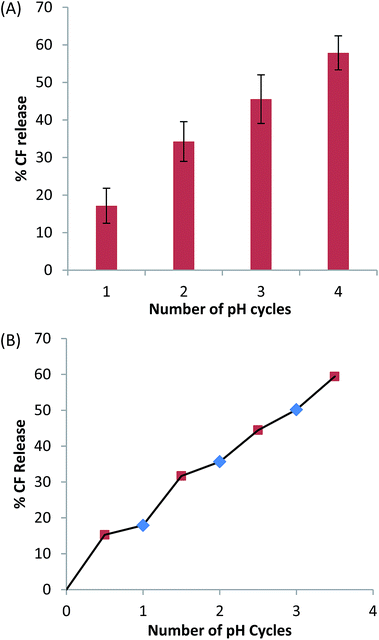
To measure CF release arising from consecutive switching, the initial switch from pH 12.4 to 6.5 was undertaken as described as above. To switch from pH 6.5 back to 12.4, a volume (∼75 μL) of 1 M NaOH was added until the desired pH was reached as measured by a MP220 pH meter (Mettler Toledo) and the resultant fluorescence was measured over 250 seconds. To switch back to pH 7.4, a volume of 1 M HCl was added (∼50 μL) and fluorescence was measured over 250 seconds. After switching, TX 100 was added to quantify maximum fluorescence. The % CF released was determined as described above, with dilution being taken into account.
4.7 SS–liposome characterisation measurement
The size and polydispersity of the C13IDZ–liposomes at pH 12.4 and 6.0 were determined using dynamic light scattering (DLS) as described previously.6The apparent pKa (pKa(app)) of 20 mol% C13IDZ–liposome suspensions were determined using the pH titration method outlined above with the following modifications. A 5 mmol L−1 liposome suspension was prepared to give a PS concentration of 1 mmol L−1 in a 4 mL volume of unbuffered Milli-Q™ H2O (pH 12.4). Sequential additions of 10 μL of 0.01 mol L−1 HCl were made, with the subsequent pH recorded upon each addition.
The integrity of the liposome bilayer was determined by measuring the fluorescence arising from passive leakage of encapsulated CF. The procedure was similar to that described for the CF release assay (Section 4.6) with the following departures. The fluorescence of CF encapsulated C13IDZ–liposome suspensions (33 μmol L−1, 3 mL, pH 12.4) was measured over temperatures ranging from 20 °C to 40 °C, at a rate of 0.7 °C min−1. From the fluorescence measurements % CF released was calculated using eqn (1).
4.8 Surface charge measurements
The zeta potential of control (0 mol% C13IDZ) and C13IDZ–liposomes were measured on a Malvern Zetasizer Nano ZS (Malvern Instruments, Worcestershire, U.K.). Measurements were performed in triplicate in a disposable capillary cell (DTS1070, Malvern Instruments, Worcestershire, U.K.) at 25 °C. Control and 20% C13IDZ–liposome suspensions were prepared as previously described, without encapsulated CF and standardised to a DPPC concentration of 1 mmol L−1 before measurement.Zeta potential measurements were performed. A 30 mL standard solution of 1 mmol L−1 of the required liposome solution at pH 12.5 was made. Using a small volume of concentrated NaOH (1 mol L−1) the pH of this suspension was decreased in increments of 0.5 pH units down to 5.5 then using small volumes of concentrated HCl (1 mol L−1) back to pH 12.5. At each 0.5 pH increment a 1 mL sample was taken and the zeta potential was measured.
Notes and references
- S. Mura, J. Nicolas and P. Couvreur, Nat. Mater., 2013, 12, 991–1003 CrossRef CAS PubMed.
- W. Gao, D. Vecchio, J. Li, J. Zhu, Q. Zhang, V. Fu, J. Li, S. Thamphiwatana, D. Lu and L. Zhang, ACS Nano, 2014, 8, 2900–2907 CrossRef CAS PubMed.
- T. M. Allen and P. R. Cullis, Adv. Drug Delivery Rev., 2013, 65, 36–48 CrossRef CAS PubMed.
- S. Ganta, H. Devalapally, A. Shahiwala and M. Amiji, J. Controlled Release, 2008, 126, 187–204 CrossRef CAS PubMed.
- L. H. Lindner, M. E. Eichhorn, H. Eibl, N. Teichert, M. Schmitt-Sody, R. D. Issels and M. Dellian, Clin. Cancer Res., 2004, 10, 2168–2178 CrossRef CAS PubMed.
- D. Y. Hegh, S. M. Mackay and E. W. Tan, RSC Adv., 2014, 4, 31771–31774 RSC.
- G. Wu, A. Mikhailovsky, H. A. Khant, C. Fu, W. Chiu and J. A. Zasadzinski, J. Am. Chem. Soc., 2008, 130, 8175–8177 CrossRef CAS PubMed.
- E. Amstad, J. Kohlbrecher, E. Müller, T. Schweizer, M. Textor and E. Reimhult, Nano Lett., 2011, 11, 1664–1670 CrossRef CAS PubMed.
- A. Schroeder, J. Kost and Y. Barenholz, Chem. Phys. Lipids, 2009, 162, 1–16 CrossRef CAS PubMed.
- P. Hinow, A. Radunskaya, S. M. Mackay, J. N. Reynolds, M. Schroeder, E. W. Tan and I. G. Tucker, J. Liposome Res., 2015, 1–13 Search PubMed.
- N. Forbes, A. Pallaoro, N. O. Reich and J. A. Zasadzinski, Part. Part. Syst. Charact., 2014, 31, 1158–1167 CrossRef CAS.
- T. Nakano, C. Chin, D. M. A. Myint, E. W. Tan, P. J. Hale, J. N. Reynolds, J. Wickens and K. M. Dani, Sci. Rep., 2014, 4, 5398 CAS.
- X.-M. Liu, B. Yang, Y.-L. Wang and J.-Y. Wang, Chem. Mater., 2005, 17, 2792–2795 CrossRef CAS.
- M. C. Annesini, A. Memoli and S. Petralito, J. Membr. Sci., 2000, 180, 121–131 CrossRef CAS.
- A. De la Maza, O. Lopez, M. Cocera, L. Coderch and J. Parra, Chem. Phys. Lipids, 1998, 94, 181–191 CrossRef CAS PubMed.
- A. de la Maza, O. Lopez, L. Coderch and J. L. Parra, Chem. Phys. Lipids, 1998, 94, 71–79 CrossRef CAS PubMed.
- A. Asokan and M. J. Cho, J. Controlled Release, 2005, 106, 146–153 CrossRef CAS PubMed.
- N. Duzgunes, R. M. Straubinger, P. A. Baldwin, D. S. Friend and D. Papahadjopoulos, Biochemistry, 1985, 24, 3091–3098 CrossRef CAS PubMed.
- A. Asokan and M. J. Cho, Bioconjugate Chem., 2004, 15, 1166–1173 CrossRef CAS PubMed.
- E. Liang and J. Hughes, Biochim. Biophys. Acta, Biomembr., 1998, 1369, 39–50 CrossRef CAS.
- A. Asokan and M. J. Cho, Biochim. Biophys. Acta, Biomembr., 2003, 1611, 151–160 CrossRef CAS.
- J. Škerjanc, K. Kogej and J. Cerar, Langmuir, 1999, 15, 5023–5028 CrossRef.
- E. Liang and J. Hughes, J. Membr. Biol., 1998, 166, 37–49 CrossRef CAS PubMed.
- J. Mandersloot, F. Reman, L. Van Deenen and J. De Gier, Biochim. Biophys. Acta, Biomembr., 1975, 382, 22–26 CrossRef CAS.
- J. Miyazaki, K. Hideg and D. Marsh, Biochim. Biophys. Acta, Biomembr., 1992, 1103, 62–68 CrossRef CAS.
- F. M. Goñi and A. Alonso, in Biotechnological Applications of Lipid Microstructures, Springer, 1988, pp. 81–103 Search PubMed.
- R. Saez, F. M. Goñi and A. Alonso, FEBS Lett., 1985, 179, 311–315 CrossRef CAS PubMed.
- F. R. Poulain, S. Nir and S. Hawgood, Biochim. Biophys. Acta, Biomembr., 1996, 1278, 169–175 CrossRef.
- R. Narayanan and J. M. Andérez, Interfacial Processes and Molecular Aggregation of Surfactants, Springer, 2008 Search PubMed.
- N. Deo and P. Somasundaran, Langmuir, 2003, 19, 7271–7275 CrossRef CAS.
- O. López, A. de la Maza, L. Coderch, C. López-Iglesias, E. Wehrli and J. L. Parra, FEBS Lett., 1998, 426, 314–318 CrossRef.
- D. Hegh, M. Sc, University of Otago, 2010.
- W. Sułkowski, D. Pentak, K. Nowak and A. Sułkowska, J. Mol. Struct., 2005, 744, 737–747 CrossRef.
- S. Raffy and J. Teissié, Biophys. J., 1999, 76, 2072–2080 CrossRef CAS PubMed.
- M. G. Benesch, D. A. Mannock, R. N. Lewis and R. N. McElhaney, Biochemistry, 2011, 50, 9982–9997 CrossRef CAS PubMed.
- H. S. Mannheimer, US Pat., US3408361 A, 1968.
- Z. Shi and H. Gu, Synth. Commun., 1997, 27, 2701–2707 CrossRef CAS.
- J. G. Weers, J. F. Rathman, F. U. Axe, C. A. Crichlow, L. D. Foland, D. R. Scheuing, R. J. Wiersema and A. G. Zielske, Langmuir, 1991, 7, 854–867 CrossRef CAS.
- K. Jacobson and D. Papahadjopoulos, Biochemistry, 1975, 14, 152–161 CrossRef CAS PubMed.
- J. C. M. Stewart, Anal. Biochem., 1980, 104, 10–14 CrossRef CAS PubMed.
- A. de la Maza and J. L. Parra, J. Controlled Release, 1995, 37, 33–42 CrossRef CAS.
Footnote |
| † Electronic supplementary information (ESI) available. See DOI: 10.1039/c6ra08814g |
| This journal is © The Royal Society of Chemistry 2016 |

