

A mechanistic study of the EC′ mechanism – the split wave in cyclic voltammetry and square wave voltammetry
Peng Songad,
Adrian C. Fishera,
Jay D. Wadhawanbc,
Joshua J. Cooperc,
Haydn J. Wardc and
Nathan S. Lawrence*bd
aDepartment of Chemical Engineering and Biotechnology, University of Cambridge, Pembroke Street, Cambridge, CB3 2RA, UK
bSchool of Engineering, University of Hull, Cottingham Road, Hull, HU6 7RX, UK. E-mail: Nathan.Lawrence@hull.ac.uk
cDepartment of Chemistry, University of Hull, Cottingham Road, Hull, HU6 7RX, UK
dSchlumberger Gould Research Center, High Cross, Madingley Road, Cambridge, CB3 0EL, UK
First published on 14th July 2016
Abstract
In this paper, a detailed investigation of electrochemical reactions coupled with homogenous chemical steps using cyclic voltammetry (CV) and square wave voltammetry (SWV) was carried out to study the electrocatalytic (EC′) mechanism. In CV, parameters including scan rate, electrode material and redox reactant were investigated while in SWV, parameters including substrate concentrations and frequencies were altered to demonstrate the EC′ mechanism. Mechanistic studies focused on the EC′ mechanism using L-cysteine with ferrocenecarboxylic acid and 1,1′-ferrocenedicarboxylic acid respectively. Voltammetric responses were recorded and under conditions of high chemical rate constant and low substrate concentration, a split wave was observed in both CV and SWV studies.
1. Introduction
1.1 Theoretical background-EC′ reaction
Electrochemical reaction are sometimes accompanied by homogeneous chemical steps which involve the reactant or product in the electron transfer process, especially with organic reactants as those organic components are very often chemically unstable.1 The EC′ mechanism is one of the most well-studied pathways among all the electrode reactions with coupled homogeneous chemical reactions in part due to its unique electrochemical response in sulfide sensing.2 The EC′ mechanism can be summarized by the scheme as shown below:| R − e−⇌O | (1.1) |
| O + S → R + Y | (1.2) |
The EC′ reaction proceeds by the product of the electrode reaction, O, reacting with a non-electroactive species S. The result of the chemical reaction is the transformation of reactant species O to reproduce R, catalyzed by species S.3,4
The EC′ mechanism can be illustrated via cyclic voltammetry as shown in Fig. 1. The reversible wave shows the situation where no substrate (S) is present in the solution. As the concentration of S is increased, the voltammogram alters in response from the classical reversible reaction where no chemical reaction occurs. The single electron transfer reaction occurs first so an oxidative peak is observed similar to a typical reversible reaction. However, when the voltage is swept back there is little reconversion of O back to R electrochemically since most species O that is made electrochemically has reacted by the chemical reaction step and thus little reductive current is observed. The scale of the catalytic current measured is dependent on the amount of substrate S present in the solution as well as the second order rate constant, kEC′, of the chemical reaction between O and S.
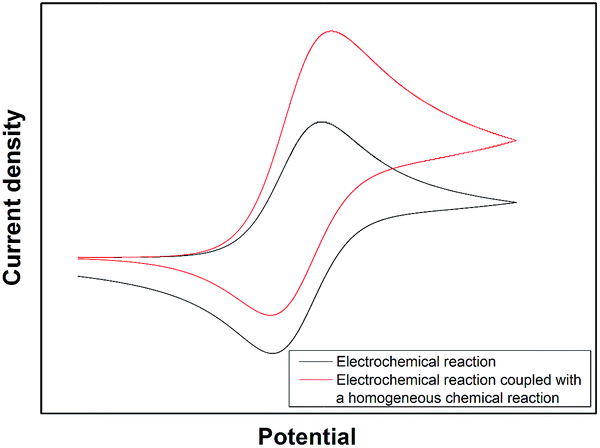 | ||
| Fig. 1 The theoretically cyclic voltammograms obtained with an E and EC′ reaction. | ||
1.2 Sensor development under EC′ mechanism
Electrochemical methodologies are also robust techniques for sulfide detection especially in extreme environments due to its low cost, simplicity of design and high sensitivity.5 Various sensors are developed under electrocatalytic mechanism to detect catechol,6 hydrazine,7 acetylcholine,8 sulfide,9,10 NADH,11 and captopril.12 A number of results have been reported under EC′ mechanism in the development of electrode materials,13–15 electrocatalysts,5,14,15 electrocatalytic pathway studies16 and electrocatalyst modification on electrode surfaces.17,18Numerical simulation work has been carried out with cyclic voltammetry (CV) of the electrocatalytic reaction on hemispherical particles and their arrays electrode.2 Parameters including scan rate, rate constant, surface coverage and concentration of substrate have been studied in terms of this electrochemical mechanism. A high rate constant is predicted to be required to resolve the split wave, as reported in related theoretical studies.1,19 A low scan rate is also preferable to increase the split wave resolution and also, the substrate concentration is reported to need to be similar with the redox reactant since if it is too low, then little current response is observed and if it is too high, then those two peaks will combine to give one peak. Consequently, the split wave phenomenon is observed due to the proper kinetics parameters between the electrochemical step and chemical step.
Besides CV, square wave voltammetry (SWV) is also utilised to study electrocatalytic mechanisms.20–30 Theoretical studies were conducted under diffusion-controlled system,31 partial absorbed system22 and surface systems.31–34 Experimental data under a ferrocene modified gold electrode was included to support the theoretical predictions.33 However, to the best of our knowledge, there are very few square-wave voltammograms showing split wave experimentally due to a limited second order rate constant and proper SWV parameters.
1.3 EC′ mechanism review
In order to identify different classes of reactivity for the EC′ mechanism a kinetic zone diagram has been developed as shown in Fig. 2.1,19,35 Two parameters including the kinetic parameter and excess factor are both influential on the voltammetric behaviour observed. In the research presented in this paper, three conditions are explored. The first, the pure kinetic zone with substrate consumption, here the substrate diffuses to the electrode continuously, resulting in a peaked shape in the cyclic voltammogram and the reverse scan does not overlap with the forward scan. Also, no reverse wave is observed because effectively all the oxidized or reduced catalyst is reduced or oxidized via catalytic step. When the substrate concentration is reduced to an appropriate value, the voltammetric response enters the total catalysis zone with pure kinetic conditions and substrate consumption or KT2.19 This zone requires a similar kinetic parameter with the pure kinetic zone and substrate consumption, but a much smaller excess factor. Consequently the catalyst reacts immediately with all of the substrate near the electrode within the timescale of forward scan and a split wave phenomenon is observed. The first peak indicates the catalytic current and the second one is related to the catalyst reactant since the substrate is totally consumed within that timescale. Furthermore, a corresponding peak is demonstrated in the reverse scan due to the total consumption of substrate. When the rate constant is not sufficiently large and the excess factor is still small, the experimental response enters the substrate consumption zone or KG zone.19 Within this zone, the substrate diffusion is the limiting step when it diffuses from the bulk solution to the electrode surface. Also, the dimensionless kinetic parameter is relatively small. Therefore, the response moves from the KT2 to the KG zone and the main difference between these two zones are the position of the first voltammetric wave. In the later zone, those two peaks combine to one due solely to the sluggish kinetic parameters.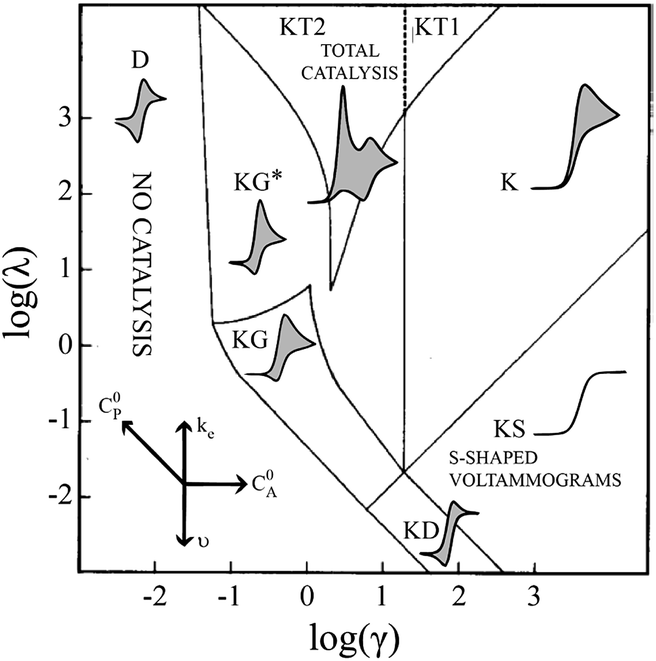 | ||
| Fig. 2 The schematic of kinetic zone diagram and simulated cyclic voltammetric waveforms for EC′ mechanism.11 Reprinted with permission from ref. 11. Copyright 2014 American Chemical Society. | ||
2 Experimental
All chemicals were supplied by Aldrich with the exception of 1,1′-ferrocenedicarboxylic acid (FDA) which was supplied by Tokyo Chemical Industry and all chemicals are used without further purification. The buffered solutions were prepared as follows: pH 9 disodium tetraborate solution in a concentration of 0.05 M.Electrocatalysts including ferrocenecarboxylic acid (FCA) and FDA were used in this paper. All solution contains 0.1 M potassium chloride as an electrolyte to minimize any migration effects. All of the investigations associated with sulfide in this paper are developed via L-cysteine, which is a common mimic of hydrogen sulfide widely applied in sulfide detection.
Electrochemical experiments were recorded with a PGSTAT30 potentiostat (Ecochemie, Netherlands) using a standard three-electrode configuration. The counter electrode was provided by a platinum wire and a saturated calomel electrode (SCE, Radiometer, Copenhagen) or silver/silver chloride electrode (BASi, USA) were employed to be the reference electrode. The working electrode was composed of either glassy carbon (GC, 0.07 cm2, BAS Technicol, UK) or boron-doped diamond (BDD, 0.07 cm2, DeBeers Industry Diamond Division, Ascot, UK). Experimental temperature was 20 ± 2 °C.
3 Results and discussion
3.1 Electro-oxidation of L-cysteine with FDA: a study of split waves with cyclic voltammetry
First the electrochemical properties of FDA were examined in a pH = 9 buffer solution via cyclic voltammetry. Hydrostatic cyclic voltammetry with aqueous FDA (2.0 mM, pH = 9 0.05 M tetraborate buffer, 0.1 M KCl) was first investigated. The voltammetric response revealed an oxidation wave and a corresponding reduction wave were observed at +0.42 V and +0.34 V respectively at the scan rate of 10 mV s−1 vs. silver/silver chloride reference electrode demonstrating a quasi-reversible behaviour with FDA. Also, the oxidation peak current of FDA increased linearly with the square root of the scan rate (Ip/A = 1.45 × 10⁻⁶ [square root of the scan rate/(mV s−1)1/2]+4.68 × 10−6, N = 8, R = 0.998) implying a diffusion controlled electrochemical reaction.The oxidation of L-cysteine by FDA was then investigated experimentally via hydrostatic cyclic voltammetry at a glassy carbon electrode. Fig. 3 demonstrates the voltammetric response of aqueous FDA (2 mM, pH = 9 0.05 M borate buffer, 0.1 M KCl, scan rate = 20 mV s−1) with 0.2 mM addition of L-cysteine (1.0–9.0 mM) at a glassy carbon electrode. It can be seen from the voltammogram that two distinct current peaks were observed at +0.24 V and +0.44 V respectively. A corresponding reductive current peak was observed at +0.34 V (concentration of L-cysteine = 1.0 mM). As the concentration of L-cysteine increases, both oxidative peaks shift positively. The explanation is here: as the concentration of L-cysteine increases, it takes more time for the electrode to consume all the reactant near the electrode surface, which results in shifts of both oxidative peaks. When the applied potential is reversed, the reductive peak exists at the same position with relatively lower concentrations of L-cysteine and keeps decreasing. Furthermore, the reductive peak was further reduced until it was negligible when the excess factor was above 3. As noticed in the kinetic zone diagram,19 this experimental result is identical to the simulated waveforms in the KT2 and K zones.
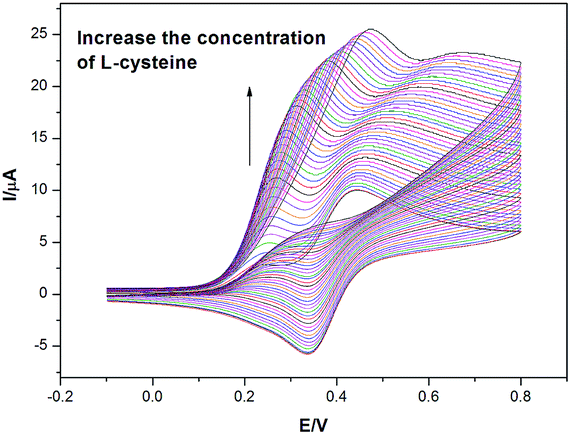 | ||
| Fig. 3 Cyclic voltammograms (scan rate = 20 mV s−1) in 0.05 M borate buffer (pH = 9) with 0.1 M KCl detailing the response of FDA to the addition of L-cysteine at a glassy carbon electrode. | ||
This split wave phenomenon is attributed to both kinetic and diffusional factors. The appearance of the first peak is due to a fast homogeneous rate constant. This fast kinetics guarantees a rapid regeneration of FDA within the diffusion layer. As the rate constant becomes even more rapid, the separation of those two peaks becomes more obvious.
One interesting phenomenon is that anodic shift of both oxidative peaks and reductive peak as shown in Fig. 3. As the experiment is undertaken by a continuous addition of L-cysteine, the absorption of L-cysteine on glassy carbon electrode surface cannot be neglected when the concentrations goes effectively high. However, the shift of the first oxidative peak is still expected according to previous research work.36
The voltammetric response at varying scan rates (50–400 mV s−1) for a solution of (pH = 9, 0.05 M borate buffer, 0.1 M KCl) containing 2 mM FDA and 0.0–3.0 mM cysteine at a GC working electrode is shown in Fig. 4(a)–(c). In the absence of L-cysteine, the voltammetric response for a simple E process was observed at a GC working electrode. At a scan rate of 50 mV s−1, a similar voltammetric response is shown compared with the voltammograms given at a scan rate of 20 mV s−1 in the absence of L-cysteine. As the scan rate increases, the first peak becomes less obvious since the fast scan takes a shorter time and the regenerated ‘R’ has less time to give an electrochemical response on these voltammograms. Also, the increased fractions of both peaks become smaller along with the increasing of scan rate. A similar explanation is drawn here: a relatively bigger scan rate gives the electrochemical system less time to demonstrate the split wave feature, which results in a less distinct double wave.
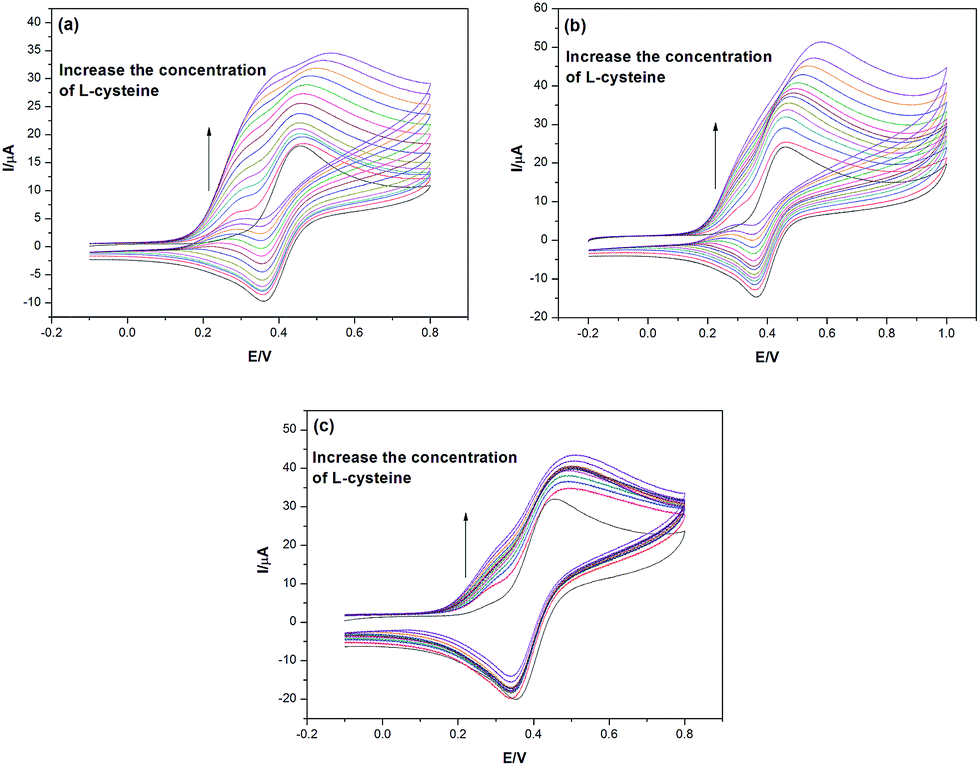 | ||
| Fig. 4 Cyclic voltammograms in 0.05 M borate buffer (pH = 9) with 0.1 M KCl detailing the response of FDA to increase the addition of L-cysteine (0.0–3.0 mM) at a glassy carbon electrode with a scan rate of 50 (a), 100 (b) and 200 (c) mV s−1. | ||
Fig. 5(a) demonstrates the influence of scan rate on the voltammetric response in a direct way. It is clear that with an increased scan rate, the peak to peak separation on the forward sweep is reduced as observed on Fig. 5(a) and (b). The peak to peak separation at a scan rate of 5 mV s−1 and 20 mV s−1 are 0.151 V and 0.110 V respectively. This occurs because the slow scan takes a longer time for ‘S’ to be consumed, which leads to the depletion of ‘R’ at a relatively lower potential and demonstrates a pre peak before the oxidation of the redox couple.
 | ||
| Fig. 5 (a) Cyclic voltammograms in 0.1 M borate buffer (pH = 9) detailing the response of 2 mM FDA and 4 mM L-cysteine to increase the scan rate (2–100 mV s−1) at a glassy carbon electrode. (b) A zoom-in view of the voltammogram at scan rates of 5, 10 and 20 mV s−1. | ||
3.2 Split wave phenomena under square-wave voltammetry
Square wave voltammetry is highly recommended for the study of electron transfer process coupled with homogeneous chemical reaction due to its distinctive ability on background current discrimination and the relatively high sensitivity of faradic current. In this section, this technique is utilized to illustrate the electrocatalytic (EC′) reaction with the split wave feature. As demonstrated in the above, the conditions are chosen to give the most obvious feature of the split wave phenomenon. Parameters including substrate concentrations and frequencies are all investigated to characterize the behaviour of electron transfer process coupled with homogeneous chemical reactions.Fig. 6 details the square wave voltammetric response of 2 mM FDA and various concentrations of L-cysteine ranging from 0.0 mM to 6.0 mM in a 0.05 M borate buffer (pH = 9) at an amplitude of 40 mV, staircase shift of 2 mV and various frequencies between 10 and 200 Hz. In Fig. 6(a), a standard case which is corresponding to a simple charge transfer process (k = 0) is introduced for comparison. Both the frequency and staircase shift have an influence on the scan rate of SWV, when the frequency increases from 10 to 200 Hz, the corresponding current peaks increases as well. Addition of 1 mM L-cysteine (Fig. 6(b)) produces no significant changes in the voltammetric profiles. However, upon addition of 2 mM L-cysteine a shoulder can be observed at the lowest frequencies. Increasing the concentration further produced a distinct pre wave which was enhanced as the concentration increased (Fig. 6(d)). This phenomenon is rationalized by the transition of ‘S’. As the L-cysteine concentration is close to the concentration of FDA, the substrate is consuming rapidly, which generates the pre wave feature. This feature is not as evident with the higher frequency-consistent with the factor scan rates for these parameters. Consequently the transition of ‘S’ is not that obvious in these two graphs.
 | ||
| Fig. 6 Square wave voltammograms detailing of 2 mM FDA with various frequencies in the absence of L-cysteine (a) and in the presence of L-cysteine at a concentration of 1(b), 2(c), 3(d), 4(e) and 5(f) mM. Conditions: 0.05 M borate buffer (pH = 9), GC working electrode, amplitude = 40 mV, staircase shift = 2 mV. | ||
Fig. 7 depicts the response of a 6 mM cysteine solution with FDA at various frequencies. As the frequency is increased the distinct pre-wave merges into the oxidation wave of FDA consistent with the CV data shown earlier. At the highest equivalent scan rate shown in this series of curves, the shoulder is more like a protuberance. This is because that the equivalent scan rate is much bigger to show a split wave feature. When the scan rate equals to 200 mV s−1 in CV in the same background solution, the feature is less obvious compared with the one in SWV. This could be rationalized by the most notable benefits of this particular technique: the ability to decouple the non-faradic current to the faradic ones.
 | ||
| Fig. 7 Square wave voltammograms detailing of 2 mM FDA with various frequencies ranging from 10–250 Hz in the presence of L-cysteine at a concentration of 6 mM. Conditions: 0.05 M borate buffer (pH = 9), GC working electrode, amplitude = 40 mV, staircase shift = 2 mV. | ||
Furthermore, the comparison between various concentrations of L-cysteine is achieved under the same frequency value as depicted in Fig. 8. All the peak currents at 0.40 V increase along with the increase of frequency because of the relationship between frequency and equivalent scan rate. When the frequency is equals to 10 Hz as shown in Fig. 8(a), there are two distinct peaks-one of them sits at the potential of around 0.25 V while the other one is at 0.40 V. This second peak is related to the electrochemical property of FDA due to its potential position. However, the first peak is the evidence of the transition of ‘S’ at the electrode surface rather than any other electron transfer process. This can be explained by the changing of peak height. As SWV has already weakened the influence of non-faradic current, when the concentration of L-cysteine increased, the peak current is increasing as well. Moreover, another supporting phenomenon is the peak current value of second peak. There is no significant change being observed of this peak value. Because SWV gives the integrated current of the redox reaction, which means when the oxidative current is much greater due to the chemical step in EC′ mechanism, the corresponding reductive current is much smaller. However, the total current should be effectively remained the same.
 | ||
| Fig. 8 Square wave voltammograms detailing of 2 mM FDA with various concentrations of L-cysteine (0.0–6.0 mM) with a frequency of 10 (a), 25 (b), 50 (c), 100 (d) and 200 (e) Hz. Conditions: 0.05 M borate buffer (pH = 9), GC working electrode, amplitude = 40 mV, staircase shift = 2 mV. | ||
When the frequency increases to 25 and 50 Hz (Fig. 8(b) and (c)), a similar trend is observed. The only difference is that the peak becomes less distinct due to the increased frequency. Eventually, under all concentrations of L-cysteine from 1.0 to 6.0 mM, the I–E curves with high frequencies (Fig. 8(d) and (e)) demonstrate a less distinct feature of the first peak. Similar to the reason given in previous sections, this high frequency leaves less time for the substrate to be reacted and give the pre peak before the formal redox peak.
4 Conclusions
An experimental phenomenon in EC′ mechanism has been analyzed via CV and SWV by different redox reactants via glassy carbon electrode. A split wave is observed under certain conditions in these electrochemical techniques. This phenomenon reveals how kinetic and diffusion conditions influence the shape of experimental results in electron transfer process coupled with homogeneous chemical reaction.In CV, parameters including scan rate, electrode material and redox reactant are investigated to find the best conditions to demonstrate the split wave phenomenon. The phenomenon is highly depended on the experimental timescale, which is scan rate in cyclic voltammograms. For options of electrodes, the heterogeneous electron transfer process on the electrode substrate is highly depending on the electrode material. Also, the physical property of ferrocene derivatives illustrates how a carboxyl group shows its influence on the pre wave feature. The experimental result under SWV gives a convictive evidence on the study of EC′ reaction due to their special features to decouple non-faradic current.
Acknowledgements
The author Peng Song expresses gratitude to Schlumberger Gould Research Centre (SGR) for technical support. Also, the authors Peng Song and Adrian C. Fisher acknowledge the support of the Campus for Research Excellence and Technological Enterprise (CREATE) programme in Singapore.References
- R. G. Compton and C. E. Banks, Understanding Voltammetry, World Scientific, Singapore, 2007 Search PubMed.
- R. W. Kristopher, N. S. Lawrence, R. S. Hartshorne and R. G. Compton, J. Phys. Chem. C, 2011, 115, 11204–11215 Search PubMed.
- A. J. Bard and L. R. Faulkner, Electrochemical Methods: Fundamentals and Applications, John Wiley & Sons, New York, 2nd edn, 2001 Search PubMed.
- A. C. Fisher, Electrode Dynamics, Oxford University Press, Oxford, 1996 Search PubMed.
- C. E. Banks, G. J. Tustion, V. G. H. Lafitte, T. G. J. Jones and N. S. Lawrence, Electroanalysis, 2007, 19, 2518–2522 CrossRef CAS.
- D. Nematollahi, M. Alimoradi and S. W. Husain, Electroanalysis, 2004, 16, 1359–1365 CrossRef CAS.
- H. M. Nassef, A.-E. Radi and C. K. O'Sullivan, J. Electroanal. Chem., 2006, 592, 139–146 CrossRef CAS.
- H. Heli, M. Hajjizadeh, A. Jabbari and A. A. Moosavi-Movahedi, Biosens. Bioelectron., 2009, 24, 2328–2333 CrossRef CAS PubMed.
- A. B. Florou, M. I. Prodromidis, M. I. Karayannis and S. M. Tzouwara-Karayanni, Talanta, 2000, 52, 465–472 CrossRef CAS PubMed.
- N. S. Lawrence, J. Davis and R. G. Compton, Talanta, 2000, 52, 771–784 CrossRef CAS PubMed.
- H. M. Nassef, A.-E. Radi and C. K. O'Sullivan, Electrochem. Commun., 2006, 8, 1719–1725 CrossRef CAS.
- S. Shahrokhian, M. Karimi and H. Khajehsharifi, Sens. Actuators, B, 2005, 109, 278–284 CrossRef CAS.
- N. S. Lawrence, M. Thompson, C. Prado, J. Li, T. G. J. Jones and R. G. Compton, Electroanalysis, 2002, 14, 499–504 CrossRef CAS.
- N. S. Lawrence, Electroanalysis, 2006, 18, 1658–1663 CrossRef CAS.
- N. S. Lawrence, G. J. Tustion, F. Michael and T. G. J. Jones, Electrochim. Acta, 2006, 52, 499–503 CrossRef CAS.
- O. Nekrassova, G. D. Allen, N. S. Lawrence, J. Li, T. G. J. Jones and R. G. Compton, Electroanalysis, 2002, 14, 1464–1469 CrossRef CAS.
- J.-B. Raoof, R. Ojani and M. Kolbadinezhad, Electroanalysis, 2005, 17, 2043–2051 CrossRef CAS.
- J.-B. Raoof, R. Ojani and H. Beitollahi, Electroanalysis, 2007, 19, 1822–1830 CrossRef CAS.
- E. S. Rountree, B. D. McCarthy, T. T. Eisenhart and J. L. Dempsey, Inorg. Chem., 2014, 53, 9983–10002 CrossRef CAS PubMed.
- J. J. O'Dea, K. Wikiel and J. Osteryoung, J. Phys. Chem., 1990, 94, 3628–3636 CrossRef.
- A. B. Miles and R. G. Compton, J. Phys. Chem. B, 2000, 104, 5331–5342 CrossRef CAS.
- V. Mirceski, J. Electroanal. Chem., 2001, 508, 138–149 CrossRef CAS.
- F. Garay and M. Lovrić, J. Electroanal. Chem., 2002, 527, 85–92 CrossRef CAS.
- R. Gulaboski, J. Solid State Electrochem., 2009, 13, 1015–1024 CrossRef CAS.
- Y. Wang, E. Laborda and R. G. Compton, J. Electroanal. Chem., 2012, 670, 56–61 CrossRef CAS.
- A. B. Miles and R. G. Compton, J. Electroanal. Chem., 2001, 499, 1–16 CrossRef CAS.
- F. Garay and M. Lovrić, J. Electroanal. Chem., 2002, 518, 91–102 CrossRef CAS.
- R. Gulaboski and L. Mihajlov, Biophys. Chem., 2011, 155, 1–9 CrossRef CAS PubMed.
- R. Gulaboski, V. Mirceski and I. Bogeski, J. Solid State Electrochem., 2012, 16, 2315–2328 CrossRef CAS.
- V. Mirceski, R. Gulaboski, M. Lovrić, I. Bogeski, R. Kappl and M. Hoth, Electroanalysis, 2013, 25, 2411–2422 CrossRef CAS.
- R. Gulaboski and V. Mirceski, Electrochim. Acta, 2015, 167, 219–225 CrossRef CAS.
- V. Mirceski and R. Gulaboski, Electroanalysis, 2001, 13, 1326–1334 CrossRef CAS.
- J. González, C. M. Soto and A. Molina, J. Electroanal. Chem., 2009, 634, 90–97 CrossRef.
- V. Mirceski and R. Gulaboski, J. Solid State Electrochem., 2003, 7, 157–165 CrossRef CAS.
- J. M. Savéant, Elements of Molecular and Biomolecular Electrochemistry: An Electrochemical Approach to Electron Transfer Chemistry, John Wiley & Sons, 2006 Search PubMed.
- J. M. Savéant and K. B. Su, J. Electroanal. Chem. Interfacial Electrochem., 1984, 171, 341–349 CrossRef.
| This journal is © The Royal Society of Chemistry 2016 |