
Gallic acid loaded onto polyethylenimine-coated human serum albumin nanoparticles (PEI-HSA-GA NPs) stabilizes α-synuclein in the unfolded conformation and inhibits aggregation†
Hossein Mohammad-Beigiabc,
Dina Morshedic,
Seyed Abbas Shojaosadati*b,
Jannik Nedergaard Pedersena,
Amir Tayaranian Marviand,
Farhang Aliakbarice,
Gunna Christiansend,
Jan Skov Pedersenaf and
Daniel E. Otzen*ag
aInterdisciplinary Nanoscience Centre (iNANO), Aarhus University, Gustav Wieds Vej 14, DK – 8000 Aarhus C, Denmark. E-mail: dao@inano.au.dk
bBiotechnology Group, Faculty of Chemical Engineering, Tarbiat Modares University, P. O. Box 14115-143, Tehran, Iran. E-mail: Shoja_sa@modares.ac.ir
cDepartment of Industrial and Environmental Biotechnology, National Institute of Genetic Engineering and Biotechnology, P. O. Box: 1417863171, Tehran, Iran
dDepartment of Biomedicine-Medical Microbiology and Immunology, Aarhus University, 8000 Aarhus C, Denmark
eStudent Research Committee and Department of Medical Biotechnology, School of Medicine, Semnan University of Medical Sciences, Semnan, Iran
fDepartment of Chemistry, Aarhus University, Langelandsgade 120, DK – 8000 Aarhus C, Denmark
gDepartment of Molecular Biology and Genetics, Aarhus University, Gustav Wieds Vej 10C, DK – 8000 Aarhus C, Denmark
First published on 2nd September 2016
Abstract
The aggregation of the 140-residue protein α-synuclein (αSN) plays a major role in the pathogenesis of different neurodegenerative disorders such as Parkinson's Disease (PD). Previous reports indicated that the antioxidant gallic acid (GA) can inhibit αSN aggregation. As the transport of GA to the brain due to the lipophilic nature of endothelial cells is prevented, we loaded GA onto positively charged polyethylenimine-coated human serum albumin (PEI-HSA) NPs and investigated the properties of these nanoparticles as drug carriers. Using an array of different techniques, we determined that GA on GA loaded PEI-HSA NPs (PEI-HSA-GA NPs) decreases the interaction of the NPs with αSN and stabilizes αSN in the unfolded conformation. These interactions lead to different effects on the αSN aggregation. While the rate of αSN aggregation increased in the presence of PEI-HSA NPs and free GA (PEI-HSA NPs + GA) due to the effect of PEI-HSA NPs, PEI-HSA-GA NPs inhibited αSN aggregation to the same extent as free GA in a concentration dependent manner. Additionally, GA inhibited the interaction of PEI-HSA-GA NPs with calcein filled vesicles, in accordance with our previous study indicating that loading GA can decrease the toxicity of PEI-HSA NPs. Also, PEI-HSA NPs not only inhibited αSN oligomers' perturbation of the membrane but also decreased the level of toxic oligomers. We conclude from our data that PEI-HSA-GA NPs are promising candidates for efficient delivery of GA to the brain.
1 Introduction
Parkinson's disease is a neurodegenerative disease characterized by the loss of dopamine-producing neurons in the substantia nigra pars compacta resulting in motor impairment and movement disorders.1 α-synuclein (αSN) as an intrinsically disordered protein is highly conserved, abundantly expressed in nervous tissue, and the main component of PD-associated toxic intracellular inclusions known as Lewy Bodies (LBs).2,3 αSN forms soluble oligomers that are the most important toxic species and possess the ability to disrupt membrane functions and thereby have the ability to disrupt neuronal damage.4–6 Accumulated evidence from both in vitro and in vivo studies postulates the toxic impact of oligomers in different ways such as the disruption of membranes,7–10 cytoskeleton changes,11,12 mitochondrial dysfunction13,14 and enhanced oxidative stress.14The compounds that prevent the aggregation and fibrillation of αSN and formation of toxic oligomers and/or reduce the toxicity of toxic species could represent potential drug leads for PD prevention. Over the years, different small molecules have emerged as potent amyloid inhibitors.9,15–18 Some of the inhibitors not only inhibits αSN fibrillation but also interferes strongly with oligomers–membrane interactions.17 Gallic acid (GA) is a phenolic antioxidant found in many plants such as green tea, sumac, berries, and gallnuts.9 GA is able to reduce highly oxidizing free radicals. This has led to intense interest in its use as a possible therapeutic against diseases associated with oxidative stress.19 GA is suggested to protect against chronic cerebral hypoperfusion-induced cognitive deficit via enhancement of the cerebral antioxidant defense.20 In addition to its antioxidant activity, GA not only inhibits αSN fibrillation and toxicity but also disaggregates preformed αSN amyloid fibrils.9 GA binds to and stabilizes the class of non-toxic αSN oligomers which lacks β-sheet structure and is predominantly in an unfolded conformation,9 consistent with its ability to also stabilize the extended, natively unfolded structure of monomeric αSN.18 The inhibitory effect of GA is related to the hydroxyl moieties and their positions on the phenyl ring.9
The blood–brain barrier (BBB) formed by endothelial cells only allows small (<400–500 Da) lipophilic molecules to cross the BBB.21 To circumvent this, human serum albumin nanoparticles (HSA NPs) targeted with different ligands such as ApoE,22 insulin23 and transferin24 have gained considerable attention as drug-delivery carriers to transport drugs into the brain. Due to the presence of amine and carboxyl groups, they can be coated with different polymers and loaded with a significant amount of drugs.25,26 We have previously prepared cationic HSA NPs coated with polyethyleneimine (PEI-HSA NPs) where GA was loaded by adsorption onto the surface of the NPs.27
Accumulated evidences from different studies indicate that NPs also interact with αSN and can increase or decrease the αSN aggregation rate, affecting the toxicity of the aggregates that form in the presence of NPs.28–33 It was shown that αSN interacts strongly with PEI-HSA NPs, and this interaction changes the secondary conformation of αSN and increases the rate of primary nucleation in a NP-concentration dependent and size independent manner.32 Furthermore, the toxicity of αSN aggregates that form in the presence PEI-HSA NPs is less than NP-free oligomers, which highlight a potential role for the NPs in reducing αSN pathogenicity in vivo. Combining the data obtained from different studies, it can be concluded that the interactions depend on the charges and nature of NPs. For instance, while Au NPs accelerate the nucleation rate of αSN aggregation, both in a size- and charge dependent manner,29 the interaction is independent of the sizes of vesicles,34 HSA NPs,32 and PEI-HSA NPs.32
In the present study we elucidate the interaction of the GA-loaded PEI-HSA NPs (PEI-HSA-GA NPs) with αSN and the effect of this interaction on αSN fibrillation and formation of toxic aggregates. To gain insight of the interaction of the NPs with αSN, centrifugation methods, small angle X-ray scattering, fluorescence anisotropy and circular dichroism (CD) have been applied. Thioflavin T (ThT) assay was used to study the effect of the NPs on αSN fibrillation. Finally, the effect of the NPs on the level of toxic oligomers, interaction of oligomers with vesicles and cytotoxicity of the aggregates were studied.
2 Materials and methods
2.1 Reagents and chemicals
Gallic acid and branched ployethylenimine (PEI, 10 kDa) were obtained from Acros Organics (Thermo Fisher Scientific, Geel, Belgium) and Alfa Aesar (Haverhill, MA), respectively. Penicillin–streptomycin, fetal bovine serum (FBS), and Dulbecco's Modified Eagle Medium (DMEM) were purchased from Gibco BRL (Gaithersberg, MD). 1,2-dioleoyl-sn-3-phosphatidyl-glycerol (DOPG) was from Avanti Polar Lipids (Alabaster, AL). All other chemicals were from Sigma Aldrich (St. Louis, MO). Rat pheochromocytoma (PC-12) cells were acquired from the Pasteur Institute (Tehran, Iran).2.2 Protein production, purification and handeling
αSN was expressed in E. coli BL21(DE3) strain with a plasmid vector pET11-D as described.35 Briefly, the harvested cells were quickly resuspended in 10% volume osmotic shock buffer (30 mM Tris–HCl, 2 mM EDTA, 40% sucrose, pH 7.2) and incubated for 10 min followed by centrifugation (9000×g, 20 °C, 30 min). The pellet was resuspended in 90 mL ice-cold deionized water and 40 μL of saturated MgCl2 was added, followed by incubation on ice for 3 min. The supernatant was collected after centrifugation (9000×g, 4 °C, and 20 min), precipitated by titration to pH 3.5 and then incubated for 5 min. The supernatant was collected by centrifugation (9000×g, 4 °C, and 20 min) and immediately titrated to pH 7.5. The protein extract was filtered (0.45 μm) and loaded on a Q-Sepharose column (HiTrap Q H P) with a 20 mM Tris–HCl pH 7.5 running buffer. Then, the column was washed with 0.1 M NaCl in buffer and αSN was eluted with a NaCl gradient from 0.1–0.5 M. SDS-PAGE analysis was used to identify fractions containing αSN. The collected purified αSN was dialyzed against deionized water, lyophilized and stored at −20 °C. Prior to use, freshly dissolved αSN was filtered (0.2 μm), and protein concentration was determined by absorbance measurements using a theoretical extinction coefficient of 0.412 (mg mL−1)−1 cm −1 for αSN at 280 nm.2.3 Preparation of HSA NPs
HSA NPs were prepared based on a desolvation technique using acetone as the solvent as described.27 Briefly, HSA was dissolved in 10 mM NaCl solution (100 mg mL−1) and the pH was adjusted to 8.2. Acetone was added dropwise to the HSA solution at 1.0 mL min−1 under continuous stirring (550 rpm) until the solution became turbid. Subsequently, 60 μL of 8% glutaraldehyde solution was added to induce particle crosslinking by stirring for 12 h. The resulting NPs were collected by centrifugation (28![[thin space (1/6-em)]](https://www.rsc.org/images/entities/char_2009.gif) 000×g, 25 min at 4 °C), washed three times, and finally redispersed in 10 mM NaCl.
000×g, 25 min at 4 °C), washed three times, and finally redispersed in 10 mM NaCl.
2.4 Preparation of PEI-HSA NPs
PEI-HSA NPs were prepared as described.27 Briefly, HSA NPs were coated with PEI via covalent amide bond formation between the carboxyl groups of HSA NPs and amine groups of PEI using N-hydroxysuccinimide (NHS) and N-(3-dimethylaminopropyl)-N-ethylcarbodiimide hydrochloride (EDC·HCl). Phosphate-buffered saline (PBS) buffer (10 mM, pH 7.4) containing EDC (1 mg mL−1), NHS (0.2 mg mL−1), and HSA NPs (5 mg mL−1) was stirred slowly for 7 min. The resulting carboxyl activated NPs particles were purified by centrifugation and resuspended to PBS buffer containing PEI (5 mg mL−1). The coating was allowed to proceed for 1 h and the resulting PEI-HSA NPs were purified by centrifugation and redispersion three times with PBS buffer, and finally redispersed in ethanol.2.5 Preparation of gallic acid loaded PEI-HSA NPs (PEI-HSA-GA NPs)
GA was loaded by adsorption onto the surface of PEI-HSA NPs.27 PEI-HSA NPs (10 mg) were dispersed in 1 mL ethanol containing GA (20 mg). The solution was stirred at 80 rpm for 24 h. GA-loaded NPs were separated by centrifugation and washed with ethanol and water. The supernatants were collected and the GA content was measured by HPLC. The drug loading efficiency (DLE) was calculated using the following formula:
 | (1) |
2.6 Adsorption of αSN onto the surface of NPs
To quantify the NPs, we dried 100 μL of the solution of NPs, measured the weight of the dried NPs and then estimated the total weight of the NPs dispersed in 2000 μL. Finally, the NPs were diluted to the desired concentration. Then, solutions of αSN with different concentrations (0.2, 0.3, 0.5, 1, and 2 mg mL−1) were incubated with PEI-HSA-GA NPs in PBS buffer (0.5 mg mL−1) for 30 min at 37 °C. The solutions were then centrifuged (14500 rpm, 20 min) to separate free αSN from αSN in complex with NPs. To measure the amount of free αSN, the supernatant was loaded on a 24 mL Superose 6 10/300 column, GE Healthcare Lifescience. The Langmuir equation was used to determine the binding constant of αSN to PEI-HSA-GA NPs.
 | (2) |
2.7 Fluorescence anisotropy
The fluorescence anisotropy of fluorophore-labelled αSN is expected to change when αSN binds to the NPs. αSN was labelled with Alexa Fluor 594 carboxylic acid (Invitrogen) to the manufacturer's instructions, leading to a labeling molar ratio of 0.5 dye:protein. Fluorescence anisotropy measurements were performed on an LS 55 Luminescence Spectrometer (Perkin Elmer). The anisotropies were obtained at a protein concentration of 2 μM and a NPs concentration of 0.5 mg mL−1. Samples were incubated for 30 min at 37 °C before measurements. The emission intensity was measured at 617 nm through both parallel and perpendicular polarizers with excitation at 594 nm.
2.8 Small-angle X-ray scattering (SAXS)
Samples for SAXS were prepared by incubating 1 mg mL−1 αSN with 0.5 mg mL−1 PEI-HSA-GA NPs in PBS buffer for 30 min at 37 °C. SAXS of solutions containing only NPs or only αSN at the above concentrations were recorded as control samples. The measurements were done based on a method developed previously36 The data are presented as a function of the magnitude of the scattering vector q = 4πsinθ/λ, where λ is the X-ray wavelength (1.54 Å) and 2θ is the scattering angle.
Indirect Fourier transformation (IFT) was used to transform the scattering profile to obtain the pair distance distribution function p(r) using the method37 implemented in the WIFT program.38 The function p(r) describes the probable frequency of interatomic vector length (r) within a particle, which gives information about the particle size and shape in real space.
The intensity data were fitted by a model of polydisperse spheres, consistent with the p(r) functions. The number size distribution was described by a Gaussian expression. A Lorentzian term with a scale factor was added to the scattering from the polydisperse spheres for describing random parts of the αSN or free αSN. The expressions for scattering model can be found in.39
2.9 Circular dichroism (CD) spectroscopy
Far UV CD spectra were measured from 250 to 195 nm with a Jasco J-810 spectrophotometer (Jasco Spectroscopic Co. Ltd., Japan), using a sonicated fibril solution with 0.2 mg mL−1 αSN (14 μM) in a 1 mm cuvette. To measure the NP-induced changes in the secondary structure of αSN, 0.1 mg mL−1 of NPs was mixed with 0.2 mg mL−1 of αSN in PBS buffer. Each spectrum was the average of five scans. CD spectra of PBS buffer and the NPs were recorded and subtracted from the protein spectra and the CD signal given as mean residue ellipticity (degrees cm2 dmol−1).2.10 Selection of NPs and GA concentration
In this study, GA and NPs concentrations were selected based on our previous study.27,40 Based on the toxicity results, 100 μM and 100 μg mL−1 were selected as the maximum concentration of GA and the NPs, respectively. It should be noted that GA at 50 μM completely inhibited the fibrillation and for oligomerization studies 50 μM GA was used. 25 μg mL−1 of PEI-HSA-GA NPs contain about 50 μM of GA. But, about 50% of the loaded GA (25 μM) are released to the medium and the rest remains on the surface of the NPs.27 So, from 25 μg mL−1 of the PEI-HSA-GA NPs about 25 μM of GA are released to the medium. Accordingly, we compared the results of αSN fibrillation in the presence of PEI-HSA-GA NPs (25 μg mL−1) with the results of PEI-HSA NPs (25 μg mL−1) + GA (25 μM), and GA (25 μM).2.11 Plate reader fibril formation assays
αSN fibril formation was carried out as previously described.41 Briefly, the αSN concentration was kept at 1 mg mL−1 (70 μM) in 150 μL PBS solution containing 40 μM ThT and increasing concentration of GA and/or NPs in each well of a sealed 96-well-plate (Nunc, Thermo Fischer Scientific, Roskilde, Denmark) with a 3 mm diameter glass bead at 37 °C. The fibrillation was followed in a Genios Pro fluorescence plate reader (Tecan, Mänerdorf, Switzerland) with 300 rpm orbital shaking. ThT fluorescence was recorded at 12 min intervals (excitation/emission 448/485 nm).2.12 Transmission electron microscopy (TEM)
5 μL of αSN sample in PBS buffer was transferred to a carbon-coated, glow-discharged 400-mesh grid for 30 s. The grids were washed using 2 drops of doubly distilled water, stained with 1% phosphotungstic acid (pH 6.8), and blotted dry. The samples were viewed in a microscope (JEM-1010; JEOL, Tokyo, Japan) operating at 60 kV. Images were obtained using an Olympus KeenView G2 camera.2.13 Oligomerization assays
The effect of GA and NPs on soluble aggregates were studied by employing our previously developed method.42 1 mg mL−1 αSN monomer was incubated on an Eppendorf thermoshaker, TS-100, BioSan, Latvia with 50 μg mL−1 of NPs or 50 μM of GA (1 h at 37 °C and 900 rpm). The insoluble species were removed by centrifugation (14500 rpm, 20 min), and the supernatant was separated on a Superose 6 10/300 column, GE Healthcare Lifescience. To determine the % of small oligomers, the surface area under the oligomers's peak were calculated and compared to the surface area under the peaks of large aggregates and monomers.
2.14 Preparation of oligomers
αSN oligomers were prepared as previously described.17 Briefly, 12 mg mL−1 αSN was incubated in PBS buffer for 5 h at 37 °C and 900 rpm on a Eppendorf thermoshaker, TS-100, BioSan, Latvia. The sample was then centrifuged (13400 rpm, 10 min) to remove insoluble material and the supernatant was loaded on a Superose 6 Prep Grade column, GE healthcare Life Sciences, Sweden, in PBS at 2.5 mL min−1. Small oligomers were collected and were concentrated with 15 mL Amicon ultracentrifugal filters (Merck).
2.15 Preparation of large unilamellar vesicles (LUVs)
LUVs were prepared as described before.43 Briefly, 5 mg mL−1 solution of 1,2-dioleoyl-sn-3-phosphatidylglycerol (DOPG) in PBS was subjected to 10 freeze thaw cycles and extruded 21 times through filters of 100 nm pore size. DOPG vesicles for calcein release were prepared in the presence of calcein at self-quenching concentration (70 mM). After extrusion, vesicles solution was run on a PD-10 desalting column (GE Healthcare) to separate free calcein from calcein entrapped vesicles.2.16 Calcein release assays
Two μL of calcein containing vesicles were added in triplicate in a 140 μL assay solution onto a clear-bottomed 96-well plate (Nunc, Thermo Fisher Scientific, Roskilde, Denmark). The background fluorescence (excitation/emission 485/520 nm) was measured on Genios Pro fluorescence plate reader (Tecan, Mänerdorf, Switzerland) before and after addition of vesicles. The NPs, GA, and/or oligomers at a final concentration of 1–10 μg mL−1, 1–10 μM, and 0.5 μM, respectively, were mixed with vesicles in a final volume of 150 μL. Data were collected for 1 h at 37 °C, measuring every two minutes preceded by 2 s of autoshaking. Finally, full rupture of calcein vesicles was measured by adding 1 μL Triton X-100 (0.1% (w/v)). Background fluorescence was subtracted.2.17 Isothermal titration calorimetry (ITC)
ITC Experiments were carried out with a MicroCal VP-ITC system. The cell contained a solution of 5 mM DOPG vesicles and was equilibrated at 37 °C. The αSN oligomer (20 μM) with or without GA (60 μM) was incubated for 30 min at 37 °C prior to titration in the calorimeter. The titration involved 27 injections of 10 μL oligomer, each with a duration time of 40 s and a spacing time of 400 s. The solution in the cell was continuously stirred at 307 rpm and the reference power and initial delay were set to 15 μcal s−1 and 1800 s, respectively. The relevant control titrations were done and the heat of dilution subtracted from the titration data. The fitting calculation was performed using a model describing a single set of binding sites with Origin software.2.18 Evaluation of cell viability
In vitro acute toxicity formed aggregates alone and in the presence of GA or PEI-HSA-GA NPs during the fibrillation process were assessed using 3-[4,5-dimethylthiazol-2-yl]-2,5-diphenyltetrazolium bromide (MTT) assay. PC-12 cells were seeded in 96 well-plates at a density of 30000 cells per 100 μL per well in DMEM supplemented with 10% FBS, 100 μg mL−1 streptomycin, 100 units per mL penicillin, and incubated at 37 °C in an incubator in a 5% CO2 atmosphere with 95% relative humidity for 24 h. Media were then replaced with fresh media containing αSN samples (collected at different time courses (0, 0.5, 1.5, 4, 8, 10, 12, and 24 h) during the fibrillation process). After a further period of 24 h, the old media were replaced with fresh ones containing 10% MTT (5 mg mL−1). The plates were incubated for an additional 4 h at 37 °C. The medium was removed and replaced by 100 μL DMSO in order to dissolve Formazan crystals. The plates were shaken slowly and incubated in darkness for 1 h. Finally, absorbance was determined by a plate reader at 570 nm using 650 nm as a reference wavelength.
2.19 Statistical analysis
Data were obtained in triplicate averaged. The results are shown as mean ± standard deviation (SD). Statistical differences between group means were analyzed by analysis of variance (ANOVA). A value of p < 0.05 was considered statistically significant.3 Results and discussion
3.1 Loading GA onto PEI-HSA NPs reduces the interaction with αSN and retains αSN conformation
HSA NPs were synthesized based on the desolvation method. When the NPs were coated with the cationic polymer PEI, the size and zeta potential value of HSA NPs increased from 75 ± 3 nm to 82 ± 4.1 nm and −36 ± 3.1 mV to +35 ± 2.8 mV, respectively, consistent with the accumulation of positively charged polymers on the NPs. Subsequently, GA was incubated with PEI-HSA NPs to prepare GA loaded PEI-HSA NPs (PEI-HSA-GA NPs). A drug loading efficiency of 37.1 ± 3% was obtained based on eqn (1). While no change in the size of the NPs was observed by loading with GA, the zeta potential value decreased to 21 ± 2.1 mV. We attribute this to the shielding of positive surface charges of PEI by the carboxyl and hydroxyl groups of GA.27 TEM images confirmed the spherical shape of PEI-HSA-GA NPs (Fig. S1†).To explore the effect of free and loaded GA on the interaction of PEI-HSA NPs with αSN, PEI-HSA-GA NPs and PEI-HSA NPs + GA were incubated with αSN and analyzed with different techniques. In order to separate free and weakly bound protein from strongly attached ones, we incubated 0.2–2 mg mL−1 αSN with 0.5 mg mL−1 NPs for 30 min, then pelleted the protein-particle complexes and analyzed the supernatant on a gel filtration. A fraction of αSN either does not bind to the NPs, or binds reversibly and exchanges with proteins in the bulk during centrifugation, aided by shear forces. SEC analysis revealed that αSN binds strongly to PEI-HSA-GA NPs and PEI-HSA NPs + GA (Fig. 1A). To quantify the binding of αSN to the NPs, an equation describing the Langmuir binding isotherm was fitted to absorption data (Table 1).
 | ||
| Fig. 1 Interaction of αSN with the NPs. (A) Adsorption of αSN onto the surface of NPs. The supernatant containing 0.5 mg mL−1 NP and 1 mg mL−1 αSN was injected into a 24 mL Superose 6 10/300 column and the amount of free αSN determined from the area of the monomeric αSN elution peak. The continuous lines represent the best fit of the Langmuir model (eqn (2)) to the data. (B) Fluorescence anisotropy values of αSN alone and incubated with either PEI-HSA-GA NPs or PEI-HSA NPs + GA (mean ± SD, n = 3, *p < 0.05 significant compared with αSN). (C) SAXS data (scattering intensity I(q) vs. length of scattering vector (q) for free αSN, PEI-HSA-GA NPs and PEI-HSA-GA NPs + αSN). The lines are the best fit to the data of the models described in the text. Far-UV CD spectra of αSN alone and incubated with (D) PEI-HSA NPs (from our previous study32), (E) PEI-HSA NPs + GA, and (F) PEI-HSA-GA NPs. 0.1 mg mL−1 of NPs was mixed with 0.2 mg mL−1 of αSN in PBS buffer and incubated for 30 min at 37 °C without shaking before spectral acquisition. Comparing the equilibrium adsorption capacity (qmax) of binding of αSN to PEI-HSA-GA NPs with the one related to the adsorption on the surface of PEI-HSA NPs indicates that the presence of GA can slightly decreases αSN binding on the surface of the NPs. | ||
In order to study the in situ interactions of αSN and the NPs in solution, the solutions were not centrifuged before SAXS and fluorescence anisotropy measurements. We saw a significant increase in the fluorescence anisotropy of αSN when it was added to PEI-HSA-GA NPs and PEI-HSA NPs + GA (Fig. 1B). An increase in the fluorescence anisotropy of αSN likely arises from strong binding of αSN to the NPs and consequent changes in the rotational correlation time of the protein.32 However, the increase in the fluorescence anisotropy in the presence of PEI-HSA-GA NPs is slightly less than the one in the presence of PEI-HSA NPs + GA, which shows that loaded GA decreases somehow the interaction of αSN with the NPs.
SAXS analysis also provides information about the shape and size of PEI-HSA-GA, αSN, and αSN-NP complexes in solution. NPs have a much larger mass than αSN, so that free αSN hardly contributes to the total scattering at a low q when the NPs and αSN are mixed. SAXS analysis was done based on the method developed previously.32 To provide information on the structure of the NPs and protein–NPs complexes, indirect Fourier transformation of data was used to obtain a pair distance distribution function p(r) (Fig. S2†). As the NPs have some degree of polydispersity, we used a model with spherical particles with a variable level of polydispersity to fit the SAXS data. Based on the first fit, the polydispersity was fixed to 18% and the size of particles and the scale of the fluctuation term were varied. The fluctuation term with a scale and a correlation length of 30 Å was included to account for signals from the free αSN monomer and loosely bound αSN on the NP surface. The results from the fitting were compared with the results of complex of PEI-HSA and αSN.32 The radius of PEI-HSA-GA NPs (Rg) was 38.6 ± 0.4 nm, which is slightly larger than that of PEI-HSA NPs (37.3 ± 0.2 nm), which we attribute to the presence of GA on the PEI-HSA-GA NPs. However, it is slightly smaller than the hydrodynamic size (Rh) determined by DLS (44 ± 2 nm), which is because the random parts outside the particle will contribute only to the hydrodynamics of the particles.39 The Rg/Rh for PEI-HSA-GA NPs is 0.88, which lies neatly in the middle between 0.77 (the theoretical value for hard spheres) and 0.977 (the theoretical value for soft spheres).44 Furthermore, Rg/Rh for proteins changes from 1.8 to 0.774 when the structure of polymer changes from a random coil to a uniform hard sphere. A decrease in the compactness of the spheres leads to an increase in the Rg/Rh value.45 Upon addition of αSN to the PEI-HSA-GA NPs and PEI-HSA NPs, the size of the particles increased to 39.8 ± 0.3 nm and 39.2 ± 0.3 nm, respectively, showing that αSN had attached to the particle surface. The smaller increase in the size of PEI-HSA-GA NPs compared to the PEI-HSA NPs upon addition of αSN (1.2 ± 0.34 nm vs. 1.9 ± 0.33 nm) suggests that the presence of GA on the surface of PEI-HSA-GA NPs slightly decreases the interaction of αSN and the NPs and as a consequence possibly decreases the extent of nucleation of the protein on the surface of the NPs. Addition of αSN to the PEI-HSA-GA NPs increased the scale for the NPs from 25.2 ± 8 to 142 ± 10. The slightly larger change in the scale of PEI-HSA-GA NPs compared to the PEI-HSA NPs upon addition of αSN could reflect a higher amount of αSN either free in solution or loosely bound to the PEI-HSA-GA NPs surface.
To gain insight into the changes in protein conformation upon addition to the NPs, far-UV circular dichroism spectroscopy (CD) was used. The mass ratio of αSN to the NPs was maintained at 2:1. αSN is natively unfolded and this is confirmed by the CD spectrum. GA caused no significant change in the αSN secondary structure (data not shown). Addition of PEI HSA NPs and PEI-HSA NPs + GA leads to a small shift in the far UV spectrum of αSN (Fig. 1D and E, respectively), though the overall shape remains characteristic of a random coil. In contrast, αSN adsorption onto PEI-HSA-GA NPs did not induce any observable spectral change, i.e. αSN remains unfolded when adsorbed (Fig. 1F). The lack of shift in the far UV spectrum of αSN conformational change in the presence of GA and PEI-HSA-GA NPs and αSN's spectral change in the presence of PEI-HSA NPs and PEI-HSA NPs + GA confirm that the nature of this interaction with PEI-HSA-GA NPs is different from the one with PEI-HSA NPs and PEI-HSA NPs + GA. Taken together, combining the evidences from different analytical approaches, we conclude that the nature of the NPs govern the interaction with αSN. PEI-HSA NPs and PEI-HSA NPs + GA have zeta potential value of +35 ± 2.8 mV with exposed PEI polymers on the surface, while positive surface charges of PEI of PEI-HSA-GA NPs are shielded by GA and the zeta potential value of the NPs is +21 ± 2.1 mV. Consequently, PEI-HSA NPs and PEI-HSA NPs + GA lead to a small shift in the far UV spectrum of αSN, and GA loaded onto PEI-HSA NPs changes the nature of the NPs, slightly reduces the interaction with αSN and consequently retains αSN in an unfolded conformation.
3.2 PEI-HSA-GA NPs inhibit fibrillation of αSN
To investigate the effect of free and loaded GA on αSN fibrillation, ThT fluorescence emission upon binding to the amyloid fibrils was used. αSN was incubated with varying molar concentrations of GA (10, 25, 50 and 100 μM). GA inhibits αSN fibrillation in a concentration dependent manner as indicated by the ThT assay (Fig. 2A). In the presence of 100 μM GA, αSN fibrillation was completely inhibited, as indicated by the TEM images (Fig. 3B) and the negligible changes in the ThT fluorescence over the time course. The results are in agreement with previous studies indicating that GA strongly inhibits aggregation of αSN.9,18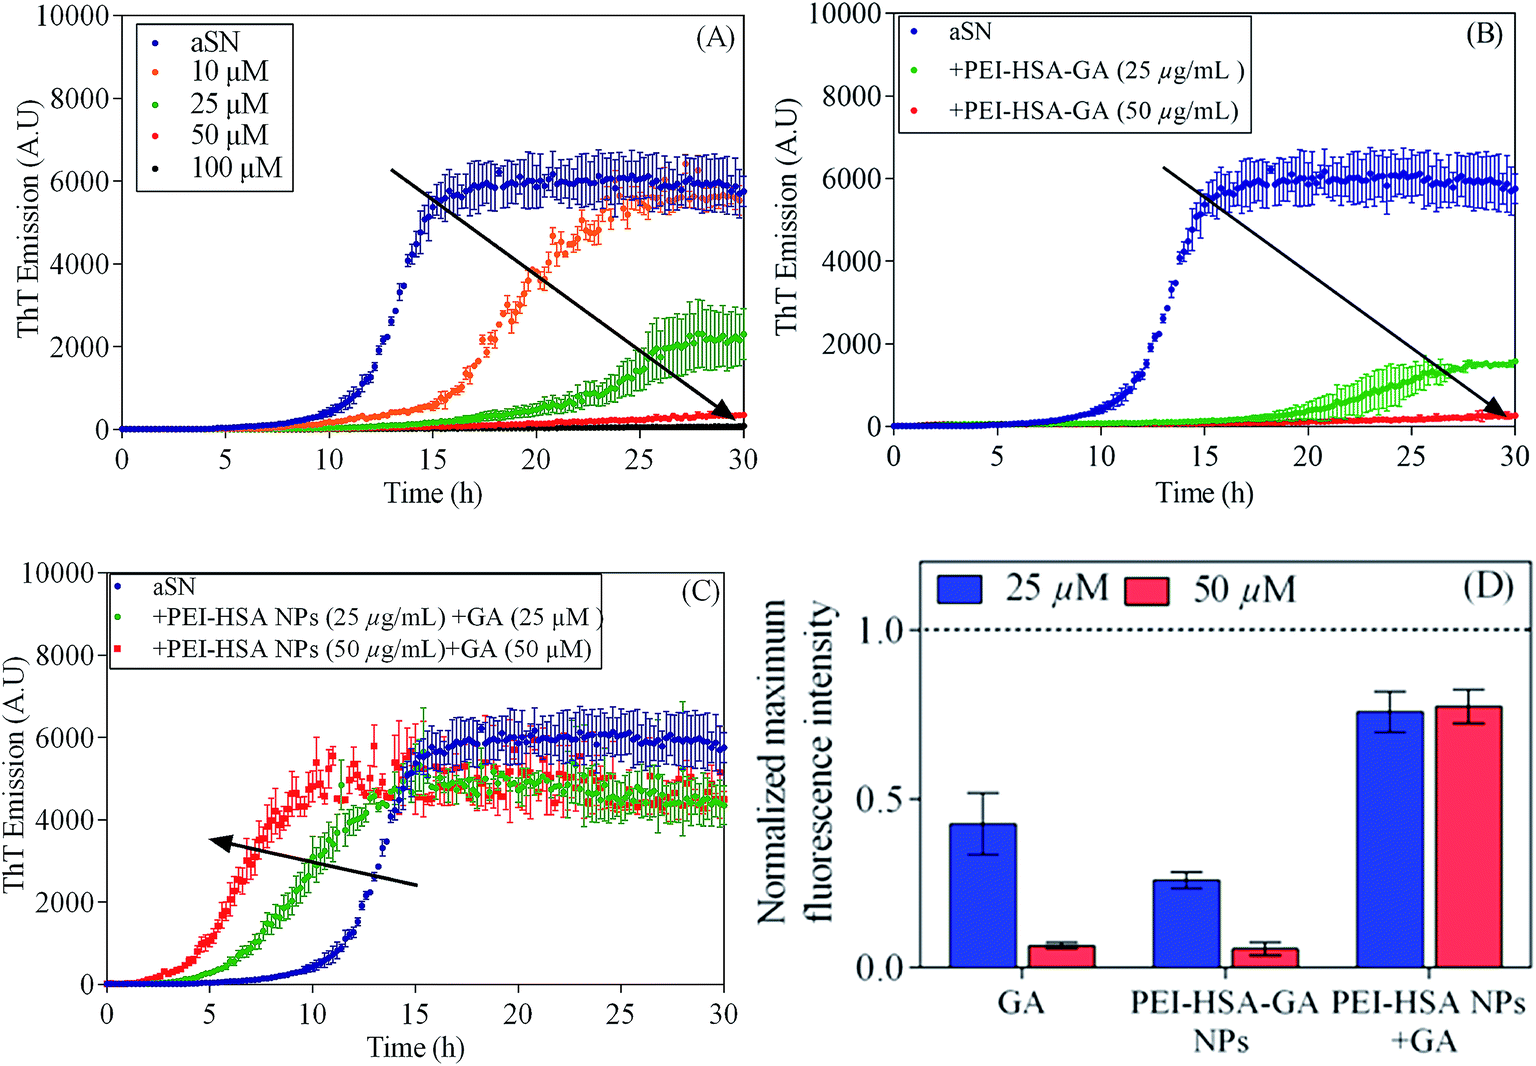 | ||
| Fig. 2 The effect of the NPs on αSN fibrillation. Effect of (A) GA (10, 25, 50, and 100 μM), (B) PEI-HSA-GA NPs (25 and 50 μM) and (C) PEI-HSA NPs + GA (25 and 50 μM) monitored by ThT fluorescence. The arrow indicates the increasing concentration of the NPs. (D) The normalized (compared to control, stippled line) maximum ThT fluorescence intensity. Our previous study showed that PEI-HSA NPs did not change the extent of fibrillation.32 | ||
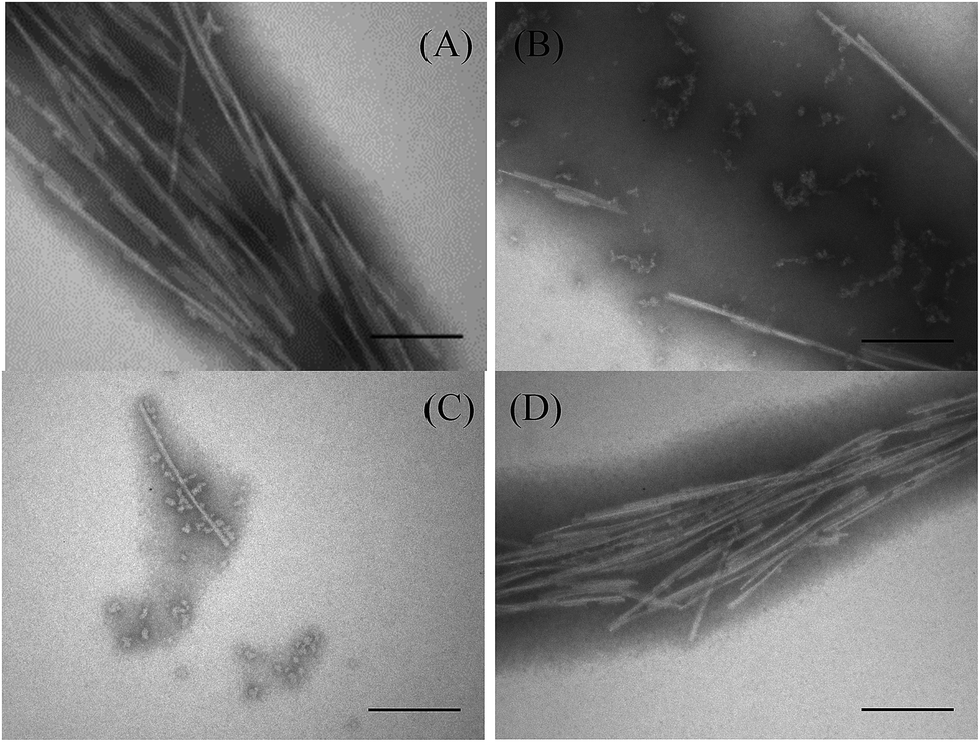 | ||
| Fig. 3 Electron microscopy of αSN incubated alone (A) and in the presence of either GA (B), PEI-HSA-GA (C) NPs or PEI-HSA NPs + GA (D) at 50 μM after 24 h. Scale bar, 200 nm. | ||
We have previously shown that PEI-HSA NPs accelerate the fibrillation of αSN in a dose dependent manner and the rate of primary nucleation increases in the presence of PEI-HSA NPs. Here, we studied the effect of PEI-HSA-GA NPs on the kinetics of αSN fibrillation. ThT data (Fig. 2B) showed that αSN fibrillation is dramatically decreased in the presence of PEI-HSA-GA NPs in a dose dependent manner. In accordance with these findings, TEM images revealed that αSN in the presence of PEI-HSA-GA NPs only formed oligomers and short fibrils (Fig. 3C). These results confirm the effectiveness of loaded GA in inhibiting the αSN fibrillation.
In the next step, the effect of free GA in the presence of PEI-HSA NPs (PEI-HSA NPs + GA) was studied. ThT data (Fig. 2C) showed that free GA (in the ranges were used in our study) does not inhibit αSN fibrillation in the presence of PEI-HSA NPs, conversely, αSN fibrillation accelerate in a PEI-HSA NPs dose manner. These findings were confirmed by TEM (Fig. 3D). We expect that GA at higher concentrations shield the PEI-HSA NPs, reduce the interaction with αSN, and subsequently inhibit αSN fibrillation.
Comparing the end point signals of ThT without and with either GA or the NPs shows that the extent of fibrillation is almost the same in the presence of free and loaded GA; however, the extent of fibrillation in the presence of PEI-HSA NPs + GA is almost the same as control. Previously, we have shown that PEI-HSA NPs also did not change the extent of fibrillation.32
The CD spectra of fibrils formed alone or in the presence of either free GA, PEI-HSA-GA NPs, or PEI-HSA NPs + GA are characterized by a negative peak at 222 nm and a positive peak at 204 nm. Increasing amounts of GA and PEI-HSA-GA NPs led to identical decreases in the minimum peak around 222 nm, reflecting a substantially unfolded protein (Fig. 4A). However, far UV-CD spectra measured for samples with PEI-HSA NPs + GA retained the features characteristic of β-sheet-rich fibrils and seen for the control fibrils alone (Fig. 4B).
 | ||
| Fig. 4 Far-UV CD analysis of the fibrils formed alone or in the presence of either (A) GA or PEI-HSA-GA NPs or (B) PEI-HSA NPs + GA at 25 and 50 μM concentration. Fibrils were formed in a plate reader using ThT fluorescence to monitor fibrillation. | ||
Based on our finding using the techniques for studying the interaction of αSN with the NPs and αSN fibrillation, we present a scheme for the possible mechanism of the effect of the NPs in αSN's adsorption, orientation and aggregation (Fig. 5). In summary, GA and loaded GA NPs (PEI-HSA-GA NPs) retain αSN in an unfolded conformation and inhibit its aggregation, while PEI-HSA NPs32 and PEI-HSA NPs + GA induce a catalytic mechanism in the primary nucleation step without changing the extent of fibrillation.
 | ||
| Fig. 5 Schematic illustration of the possible mechanism of the effect of PEI-HSA NPs, PEI-HSA-GA NPs, PEI-HSA NPs + GA on αSN's adsorption, orientation and aggregation. Strong interactions with PEI-HSA NPs and PEI-HSA NPs + GA alter UV spectrum of αSN and accelerate the primary nucleation step of aggregation, while interactions with PEI-HSA-GA NPs stabilize the unfolded monomeric αSN conformation and inhibit the elongation step of aggregation. | ||
3.3 PEI-HSA-GA NPs reduce the level of membrane-perturbing oligomers
In the next step, the effect of GA and PEI-HSA-GA NPs on the level of soluble aggregates were studied. αSN monomer was incubated in the presence of either GA or PEI-HSA-GA NPs, the insoluble species were removed by centrifugation and the supernatant was injected on a gel filtration column.The elution profile of αSN incubated in the presence of either GA or PEI-HSA-GA NPs had three major peaks (Fig. 6 – note that NPs are spun down and therefore not eluted on the column). Besides the monomer and GA peaks, the peak corresponding to oligomers was detected. SEC analyses revealed that the amount of oligomers in the presence of GA showed no significant difference with the control. However, PEI-HSA-GA NPs, significantly decreased the amount of oligomers. At the equivalent concentration (50 μM), the GA peak for samples with PEI-HSA-GA NPs is smaller than the one for free GA, indicating that only part of GA is released during the incubation time (1 h) and the remaining part remains attached on the surface of the NPs.
 | ||
| Fig. 6 The effect of GA and the NPs on the SEC profiles of the supernatant of αSN samples. All spectra are averages of duplicates that were carried out twice. Percentage value of oligomers formed in the presence and absence of the NPs are listed in the table. | ||
3.4 PEI-HSA-GA NPs reduce the perturbation of oligomers in membranes
Different studies show that oligomers are the key players in the disease process.46,47 The permeabilization of phospholipid membranes by oligomers is a pathway to cellular toxicity. To assess the toxicity of oligomers, the calcein release assay was used to investigate if the NPs can change the membrane permeabilization by αSN oligomers. In this assay, perturbation of the phospholipid membrane leads to release of calcein (present at self-quenching concentrations inside the vesicles) and a consequent increase in fluorescence. In the first step, the effect of GA and the NPs alone on the membrane permeabilization was studied. GA alone did not lead to any calcein release up to 100 μM (Fig. 7A). Previously, it was shown that PEI-HSA NPs at high concentrations (>10 μg mL−1) induce a significant calcein release.32 Similarly, PEI-HSA NPs + GA led to a significant release above 10 μg mL−1 (Fig. 7B). Interestingly, GA-loaded NPs (PEI-NPs) alone did not lead to any calcein release up to 100 μg mL−1 (Fig. 7C). We suggest that loaded GA inhibits the interaction of the NPs with vesicles by shielding the PEI groups. Loading GA on the PEI-HSA NPs also neutralizes the deleterious effect of high doses of PEI-HSA NPs in free radical formation in PC-12 cells.27 A schematic is depicted in the Fig. 7D, which shows the effectiveness of loaded GA compare to free ones in reducing the interaction of the PEI-HSA NPs with vesicles. | ||
| Fig. 7 Calcein release from DOPG vesicles in the presence of (A) GA, (B) PEI-HSA-GA NPs, and (C) PEI-HSA NPs + GA. The arrows indicate the direction of increased NPs concentration. (D) Schematic representation of the interaction between calcein loaded vesicles and PEI-HSA-GA NPs and PEI-HSA NPs + GA. | ||
To directly assess the effect of GA on the membrane permeabilization by αSN oligomers, we turned to ITC to measure oligomer–membrane interactions. ITC directly measures the binding affinity constant, enthalpy changes, and binding stoichiometry between NPs and proteins. We have previously shown that EGCG inhibits oligomer–membrane interactions.17 Oligomers give exothermic signals when they are added to the vesicles (Fig. 8A). But GA showed no inhibitory effect on the interaction of oligomers and vesicles, which suggests that GA cannot decrease the toxicity of oligomers. The heat change profiles were fitted using a model describing a single set of binding sites and best fit parameters were calculated using non-linear least-squares fitting. The interaction of oligomers and vesicles shows a favourable enthalpy change (−608.6 kcal mol−1) and an unfavorable entropy loss (−1.93 kcal mol−1 K), resulting in an overall favourable (negative) free energy change (−8.7 kcal mol−1). The thermodynamic quantities of the interaction of oligomers and vesicles did not change in the presence of GA, which shows that GA does not affect the interaction.
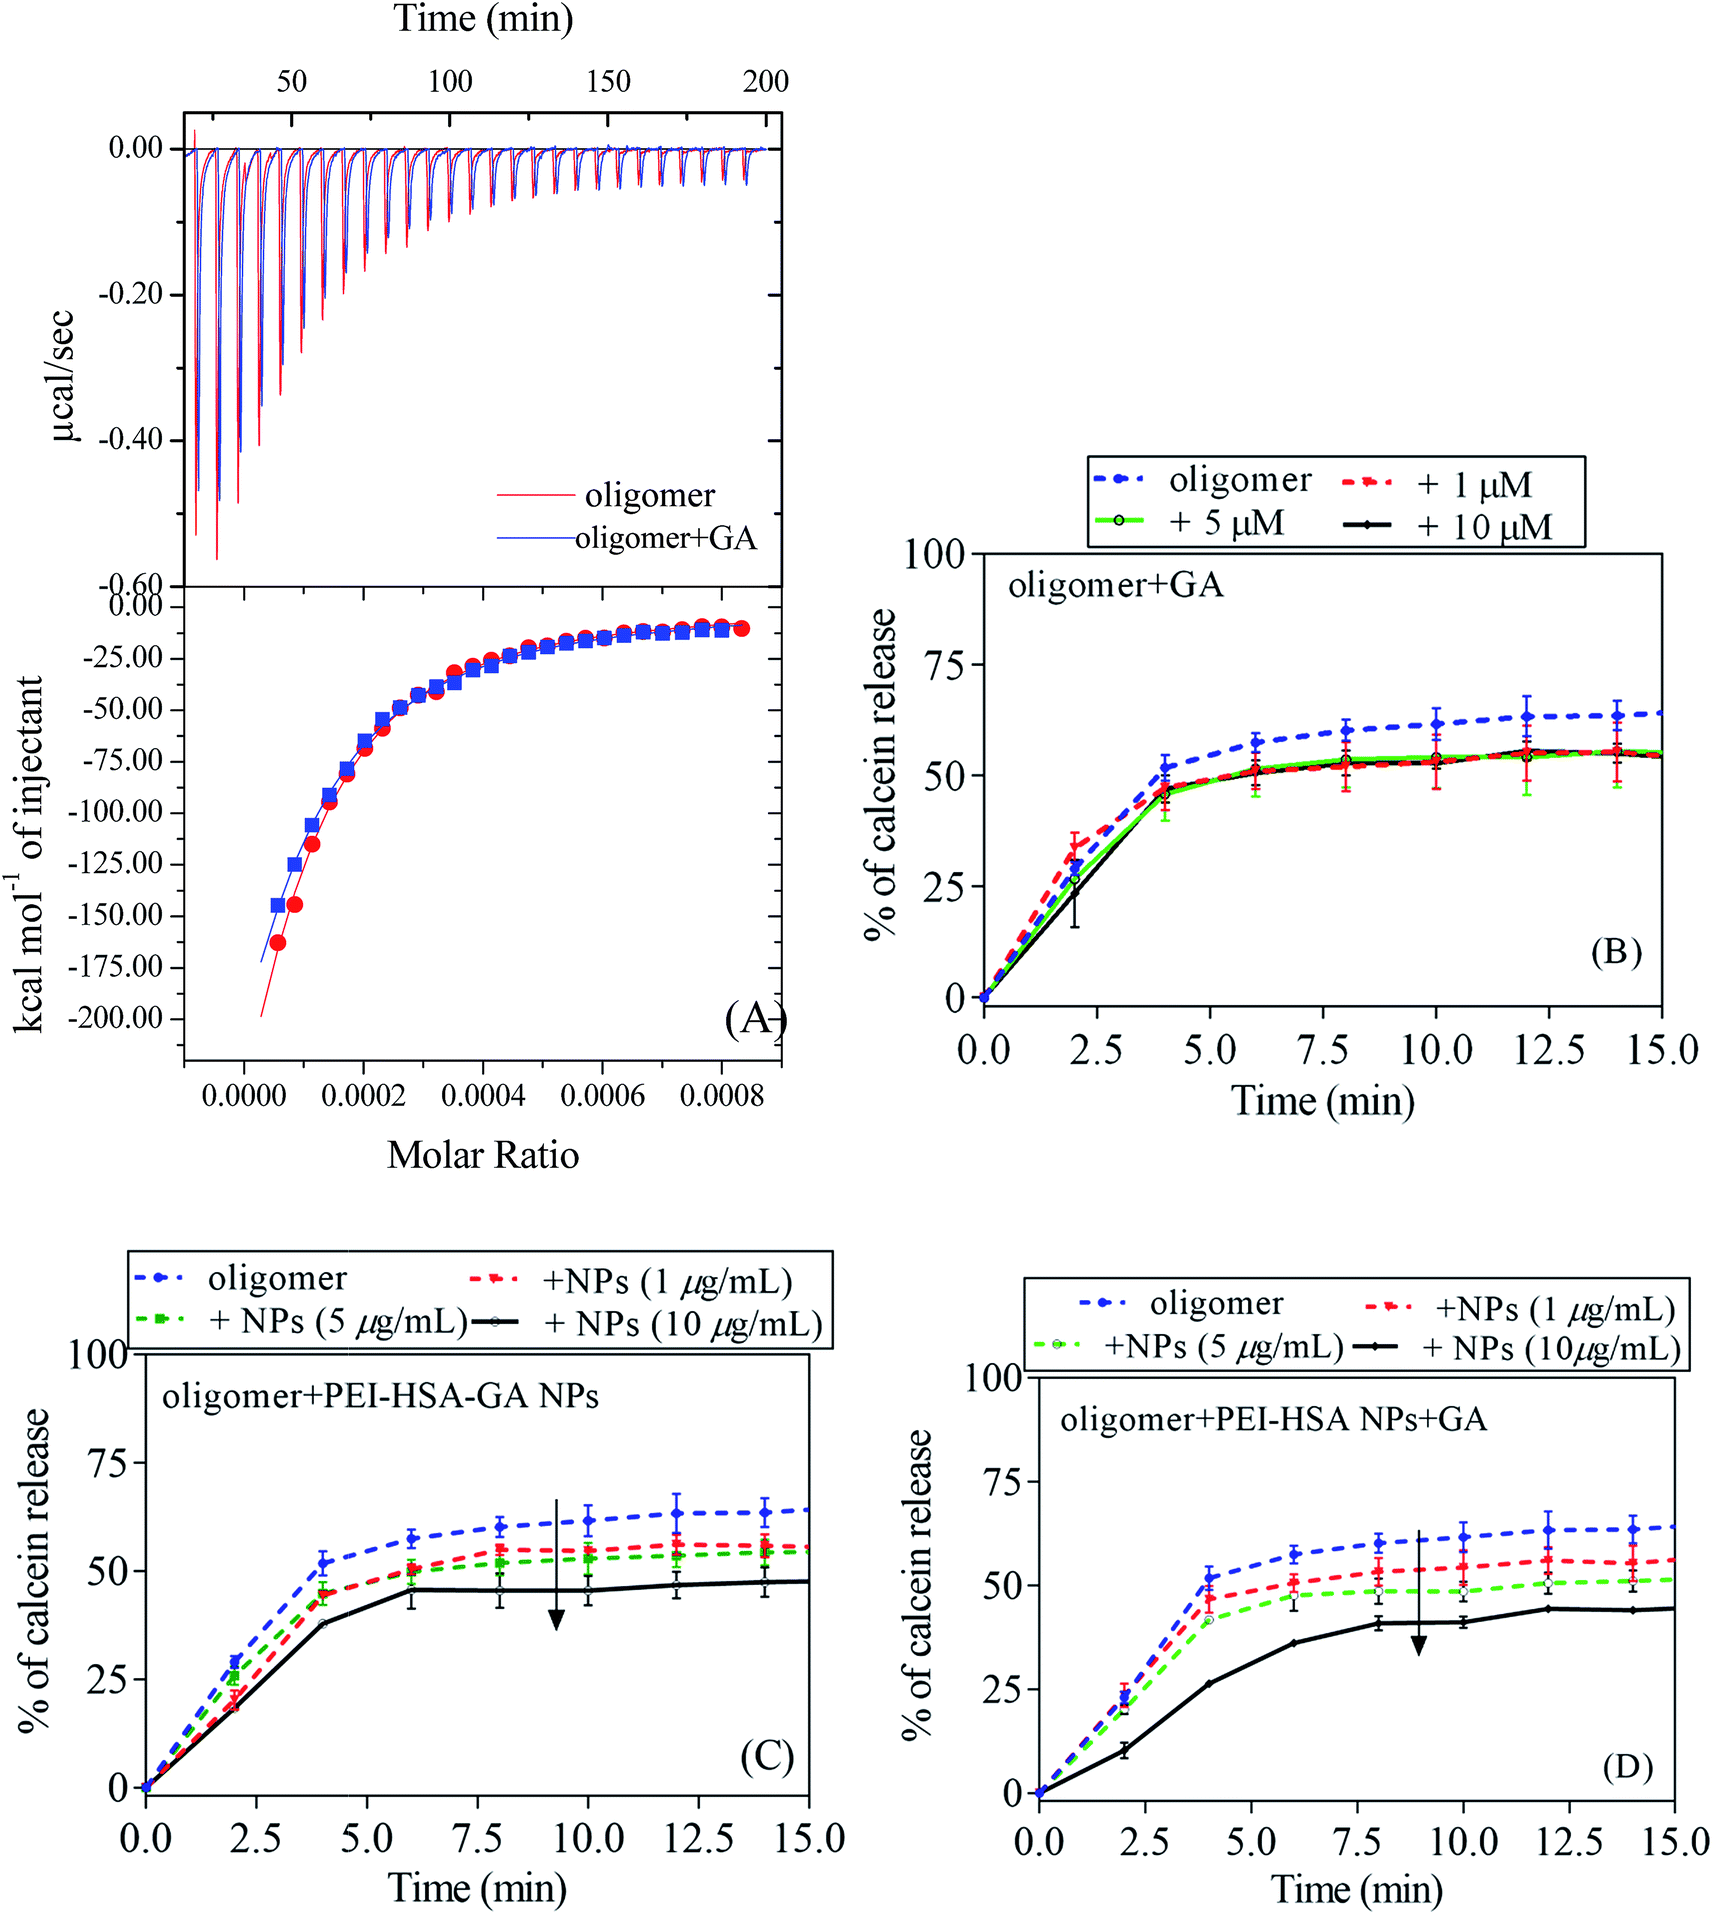 | ||
| Fig. 8 Analysis of the interaction between DOPG vesicles and oligomers, which have been incubated with or without GA or the NPs. (A) ITC analysis of the interaction energy between oligomers (20 μM) and DOPG vesicles without (red) and with (blue) 60 μM GA, showing raw injection profiles (top panel) and the integrated enthalpogram (bottom panel). Calcein release from DOPG vesicles induced by (B) oligomers + GA, (C) oligomers + PEI-HSA-GA NPs, and (D) oligomers + PEI-HSA NPs + GA. The arrows indicate the direction of increased NPs concentration. | ||
To further evaluate the effect of GA and the NPs on the membrane permeabilization by αSN oligomers, the calcein release assay was done in the presence of both oligomers and either GA, PEI-HSA-GA NPs and PEI-HSA NPs + GA. The calcein release data in the presence of GA is in agreement with ITC data in which that GA alone only had a small and dose-independent effect on the membrane permeabilization by αSN oligomers (decrease from 65 ± 1.4% to 54 ± 1.1% at all concentrations between 1 and 10 μM), while PEI-HSA-GA NPs and PEI-HSA NPs + GA decrease calcein release in a dose response fashion (from 65 ± 1.4% to 48 ± 1.2% and 65 ± 1.4% to 45 ± 1.6%, respectively).
3.5 Toxicity of formed aggregates in the presence of GA and PEI-HSA-GA NPs are less than the control ones
To determine the effect of GA and PEI-HSA-GA NPs on toxicity conferred by αSN aggregates formed during the fibrillation process, an MTT toxicity assay was conducted with neuroendocrine PC-12 cells. We have previously studied the in vitro acute cytotoxicity of HSA, PEI-HSA, and PEI-HSA-GA NPs in PC-12 cells.27,40 The results showed that the NPs and GA have no toxicity and the method of eliminating solvent, free PEI and unreacted glutaraldehyde is effective. However, the ROS production increased slightly at high PEI-HSA NPs (100 μg mL−1), loading GA on the PEI-HSA NPs neutralized the deleterious effect of high doses of PEI-HSA NPs in free radical formation in PC-12 cells.The MTT assay showed that αSN aged in the absence of GA and the NPs decreased cell viability up to 10 h and then increased it (Fig. 9). In contrast, the aggregates resulting from the incubation of αSN with GA and PEI-HSA-GA NPs were significantly less toxic. The toxic effect of the aggregates formed in the presence of GA and PEI-HSA-GA NPs progressed up to 10 h and 4 h, respectively, and then decreased. The decrease in the toxicity of aggregates could be due to the removal of toxic oligomers and their conversion to less toxic aggregates.
 | ||
| Fig. 9 Viability of PC-12 cells after 24 h incubation with αSN aggregates formed alone and in the presence of either GA (50 μM) or PEI-HSA-GA NPs (50 μg mL−1) over different times (0–24 h). | ||
It has been reported that the oligomeric species are the neurotoxic species in the amyloid fibrillation pathway.48 Our results indicate that PEI-HSA-GA NPs reduce neurotoxicity by reducing the level of off pathway oligomers as well as the oligomers' ability to permeabilize membranes.
4. Conclusion
Results obtained in this study showed that loading GA onto PEI-HSA NPs modulate the interaction of the NPs and αSN and the effect of the NPs on αSN fibrillation. Evidence from different analytical approaches showed that the interaction of PEI-HSA-GA NPs is slightly weaker than the interaction with PEI-HSA NPs and PEI-HSA NPs + GA. This evidence can be summarized as follows: firstly, less αSN remains on the surface of PEI-HSA-GA NPs. Secondly, the fluorescence anisotropy of αSN increases less when added to PEI-HSA-GA NPs than to PEI-HSA NPs and PEI-HSA-GA NPs. Thirdly, PEI-HSA-GA NPs increase less in size than PEI-HSA NPs upon addition of αSN. Also, the lack of shift in the far UV spectrum of αSN in the presence of GA and PEI-HSA-GA NPs confirms that the nature of this interaction with PEI-HSA-GA NPs is different from the one with PEI-HSA NPs and PEI-HSA NPs + GA. Consequently, this interaction was able to inhibit αSN fibrillation aged with PEI-HSA-GA NPs to the same extent as free GA.The results showed that loading GA onto PEI-HSA NPs reduces the interaction of PEI-HSA-GA NPs with calcein filled vesicles, the level of membrane-perturbing oligomers, and toxic aggregates. It is remarkable that GA by itself does not prevent oligomer permeabilization of membranes, but it can be activated to do so by its adsorption onto NPs. It is possible that this represents an avidity effect, i.e. the presentation to αSN oligomers of multiple GA molecules within a relatively small space, allowing efficient binding of oligomers to NPs and consequently sequestering them from membrane interactions. From a therapeutic point of view, this represents a major advantage, as PEI-HSA-GA NPs can be used as a safe inhibitor loaded drug carrier to transport GA as an antioxidant across the BBB.
References
- J. Hardy, M. R. Cookson and A. Singleton, Lancet Neurol., 2003, 2, 221–228 CrossRef CAS PubMed.
- R. Jakes, M. G. Spillantini and M. Goedert, FEBS Lett., 1994, 345, 27–32 CrossRef CAS PubMed.
- M. G. Spillantini, M. L. Schmidt, V. M.-Y. Lee, J. Q. Trojanowski, R. Jakes and M. Goedert, Nature, 1997, 388, 839–840 CrossRef CAS PubMed.
- H. A. Lashuel, D. Hartley, B. M. Petre, T. Walz and P. T. Lansbury, Nature, 2002, 418, 291 CrossRef CAS PubMed.
- M. Bucciantini, E. Giannoni, F. Chiti, F. Baroni, L. Formigli, J. Zurdo, N. Taddei, G. Ramponi, C. M. Dobson and M. Stefani, Nature, 2002, 416, 507–511 CrossRef CAS PubMed.
- M. J. Volles, S.-J. Lee, J.-C. Rochet, M. D. Shtilerman, T. T. Ding, J. C. Kessler and P. T. Lansbury, Biochemistry, 2001, 40, 7812–7819 CrossRef CAS PubMed.
- W. Paslawski, M. Andreasen, S. B. Nielsen, N. Lorenzen, K. Thomsen, J. D. Kaspersen, J. S. Pedersen and D. E. Otzen, Biochemistry, 2014, 53, 6252–6263 CrossRef CAS PubMed.
- L. Giehm, D. I. Svergun, D. E. Otzen and B. Vestergaard, Proc. Natl. Acad. Sci. U. S. A., 2011, 108, 3246–3251 CrossRef CAS PubMed.
- M. T. Ardah, K. E. Paleologou, G. Lv, S. B. A. Khair, A. S. Kazim, S. T. Minhas, T. H. Al-Tel, A. A. Al-Hayani, M. E. Haque, D. Eliezer and others, Front. Aging Neurosci., 2014, 6, 1–17 Search PubMed.
- M. T. Stöckl, N. Zijlstra and V. Subramaniam, Mol. Neurobiol., 2013, 47, 613–621 CrossRef PubMed.
- L. Chen, J. Jin, J. Davis, Y. Zhou, Y. Wang, J. Liu, P. J. Lockhart and J. Zhang, Biochem. Biophys. Res. Commun., 2007, 356, 548–553 CrossRef CAS PubMed.
- I. Prots, V. Veber, S. Brey, S. Campioni, K. Buder, R. Riek, K. J. Böhm and B. Winner, J. Biol. Chem., 2013, 288, 21742–21754 CrossRef CAS PubMed.
- K. Nakamura, V. M. Nemani, F. Azarbal, G. Skibinski, J. M. Levy, K. Egami, L. Munishkina, J. Zhang, B. Gardner, J. Wakabayashi and others, J. Biol. Chem., 2011, 286, 20710–20726 CrossRef CAS PubMed.
- K. Nakamura, Neurotherapeutics, 2013, 10, 391–399 CrossRef CAS PubMed.
- N. Pandey, J. Strider, W. C. Nolan, S. X. Yan and J. E. Galvin, Acta Neuropathol., 2008, 115, 479–489 CrossRef CAS PubMed.
- X. Meng, L. A. Munishkina, A. L. Fink and V. N. Uversky, Parkinson's Dis., 2010, 2010, 1–16 CrossRef PubMed.
- N. Lorenzen, S. B. Nielsen, Y. Yoshimura, B. S. Vad, C. B. Andersen, C. Betzer, J. D. Kaspersen, G. Christiansen, J. S. Pedersen, P. H. Jensen and others, J. Biol. Chem., 2014, 289, 21299–21310 CrossRef PubMed.
- Y. Liu, J. A. Carver, A. N. Calabrese and T. L. Pukala, Biochim. Biophys. Acta, Proteins Proteomics, 2014, 1844, 1481–1485 CrossRef CAS PubMed.
- G. R. Buettner, Arch. Biochem. Biophys., 1993, 300, 535–543 CrossRef CAS PubMed.
- M. S. Korani, Y. Farbood, A. Sarkaki, H. Fathi Moghaddam and M. Taghi Mansouri, Eur. J. Pharmacol., 2014, 733, 62–67 CrossRef CAS PubMed.
- W. M. Pardridge, Mol. Interventions, 2003, 3, 90 CrossRef CAS PubMed.
- S. Wagner, A. Zensi, S. L. Wien, S. E. Tschickardt, W. Maier, T. Vogel, F. Worek, C. U. Pietrzik, J. Kreuter and H. von Briesen, PLoS One, 2012, 7, e32568 CAS.
- K. Ulbrich, T. Knobloch and J. Kreuter, J. Drug Targeting, 2011, 19, 125–132 CrossRef CAS PubMed.
- V. Mishra, S. Mahor, A. Rawat, P. N. Gupta, P. Dubey, K. Khatri and S. P. Vyas, J. Drug Targeting, 2006, 14, 45–53 CrossRef CAS PubMed.
- H. Kouchakzadeh, S. A. Shojaosadati, F. Tahmasebi and F. Shokri, Int. J. Pharm., 2013, 447, 62–69 CrossRef CAS PubMed.
- H. Kouchakzadeh, S. A. Shojaosadati, A. Maghsoudi and E. V. Farahani, AAPS PharmSciTech, 2010, 11, 1206–1211 CrossRef CAS PubMed.
- H. Mohammad-Beigi, S. A. Shojaosadati, D. Morshedi, A. Arpanaei and A. T. Marvian, J. Nanopart. Res., 2015, 17, 1–16 CrossRef CAS.
- M. J. Roberti, M. Morgan, G. Menéndez, L. I. Pietrasanta, T. M. Jovin and E. A. Jares-Erijman, J. Am. Chem. Soc., 2009, 131, 8102–8107 CrossRef CAS PubMed.
- Y. D. Álvarez, J. A. Fauerbach, J. V. Pellegrotti, T. M. Jovin, E. A. Jares-Erijman and F. D. Stefani, Nano Lett., 2013, 13, 6156–6163 CrossRef PubMed.
- J. A. Yang, B. J. Johnson, S. Wu, W. S. Woods, J. M. George and C. J. Murphy, Langmuir, 2013, 29, 4603–4615 CrossRef CAS PubMed.
- J. A. Yang, W. Lin, W. S. Woods, J. M. George and C. J. Murphy, J. Phys. Chem. B, 2014, 118, 3559–3571 CrossRef CAS PubMed.
- H. Mohammad-Beigi, S. A. Shojaosadati, A. T. Marvian, J. N. Pedersen, L. H. Klausen, G. Christiansen, J. S. Pedersen, M. Dong, D. Morshedi and D. E. Otzen, Nanoscale, 2015, 7, 19627–19640 RSC.
- N. Taebnia, D. Morshedi, M. Doostkam, S. Yaghmaei, F. Aliakbari, G. Singh and A. Arpanaei, RSC Adv., 2015, 5, 60966–60974 RSC.
- C. Galvagnion, A. K. Buell, G. Meisl, T. C. Michaels, M. Vendruscolo, T. P. Knowles and C. M. Dobson, Nat. Chem. Biol., 2015, 11, 229–234 CrossRef CAS PubMed.
- N. Lorenzen, L. Lemminger, J. N. Pedersen, S. B. Nielsen and D. E. Otzen, FEBS Lett., 2014, 588, 497–502 CrossRef CAS PubMed.
- J. S. Pedersen, J. Appl. Crystallogr., 2004, 37, 369–380 CrossRef CAS.
- O. Glatter, J. Appl. Crystallogr., 1977, 10, 415–421 CrossRef.
- J. S. Pedersen, S. Hansen and R. Bauer, Eur. Biophys. J., 1994, 22, 379–389 CrossRef CAS PubMed.
- M. Stieger, W. Richtering, J. S. Pedersen and P. Lindner, J. Chem. Phys., 2004, 120, 6197–6206 CrossRef CAS PubMed.
- H. Mohammad-Beigi, S. A. Shojaosadati, D. Morshedi, N. Mirzazadeh and A. Arpanaei, Iran. J. Biotechnol., 2016, 14, 45–50 Search PubMed.
- L. Giehm and D. E. Otzen, Anal. Biochem., 2010, 400, 270–281 CrossRef CAS PubMed.
- N. Lorenzen, S. B. Nielsen, A. K. Buell, J. D. Kaspersen, P. Arosio, B. S. Vad, W. Paslawski, G. Christiansen, Z. Valnickova-Hansen, M. Andreasen and others, J. Am. Chem. Soc., 2014, 136, 3859–3868 CrossRef CAS PubMed.
- L. Nesgaard, B. Vad, G. Christiansen and D. Otzen, Biochim. Biophys. Acta, Proteins Proteomics, 2009, 1794, 84–93 CrossRef CAS PubMed.
- A. K. Brewer and A. M. Striegel, Anal. Bioanal. Chem., 2009, 393, 295–302 CrossRef CAS PubMed.
- J. Li and P. Yao, Langmuir, 2009, 25, 6385–6391 CrossRef CAS PubMed.
- R. Kayed, E. Head, J. L. Thompson, T. M. McIntire, S. C. Milton, C. W. Cotman and C. G. Glabe, Science, 2003, 300, 486–489 CrossRef CAS PubMed.
- A. Demuro, E. Mina, R. Kayed, S. C. Milton, I. Parker and C. G. Glabe, J. Biol. Chem., 2005, 280, 17294–17300 CrossRef CAS PubMed.
- N. Lorenzen and D. E. Otzen, Essays Biochem., 2014, 56, 137–148 CrossRef PubMed.
Footnote |
| † Electronic supplementary information (ESI) available. See DOI: 10.1039/c6ra08502d |
| This journal is © The Royal Society of Chemistry 2016 |