Magnetic molecularly imprinted polymers–silver nanoparticle based micro-solid phase extraction for the determination of polycyclic aromatic hydrocarbons in water samples

Mostafa Khajeh*a, Marzieh Sharifirada, Mousa Bohloolib and Mansour Ghaffari-Moghaddama
aDepartment of Chemistry, University of Zabol, Zabol, Iran. E-mail: m_khajeh@uoz.ac.ir; Fax: +98-543-2226765
bDepartment of Biology, University of Zabol, Zabol, Iran

Received 2nd April 2016 , Accepted 31st May 2016

First published on 2nd June 2016


Abstract

In this study, an efficient and sensitive magnetic molecularly imprinted polymer–silver nanoparticle (MMIPS) system was successfully synthesized. The MMIPS-based micro-solid phase extraction, followed by gas chromatography-flame ionization detection, was employed for the extraction and analysis of polycyclic aromatic hydrocarbons such as naphthalene, anthracene and pyrene. The adsorbent was analyzed with Fourier transform-infrared spectrometry (FT-IR) and scanning electron microscopy (SEM). The equilibrium data of the adsorbent were investigated by Scatchard analysis. In the optimized conditions, the limits of detection were achieved in the range of 0.01 to 0.09 μg L−1. Precisions were obtained from 1.1 to 6.2% for intra-day and 5.9 to 10.2% for inter-day.

1. Introduction

Carcinogenic organic materials, such as polycyclic aromatic hydrocarbons (PAHs), are important environmental pollutants due to their widespread occurrence and high toxicity. They are used as raw compounds for the production of various commodities and industrial solvents and are also present in gasoline. Some PAHs like naphthalene, anthracene and pyrene have been selected as “priority contaminants” by the US EPA. Similarly, the risk and action levels of these compounds are designated in the Dutch Government Quality Standards for the assessment of water and soil contamination.1,2 The analysis of these compounds in environmental matrices is difficult due to their trace level existence.3,4 The maximum acceptable concentrations for anthracene, pyrene, and naphthalene in drinking water have been reported by the European Union (EU) as 100, 100 and 1200 ng L−1, respectively.5,6

Sample preparation methods play an important role in analytical chemistry. Large sample clean-up methods are generally required to eliminate the matrix components that could interfere with the analysis. Solid phase extraction (SPE) is a suitable sample preparation technique because of its important advantages including reproducibility, improvements in automation and high throughput ability.7,8 While SPE has been used extensively, it has number of disadvantages such as large secondary wastes and solvent losses. Micro-solid phase extraction (μ-SPE) is categorized as a SPE method. The advantages of this method include short time requirement, is appropriate for recovery efficiency and reduced solvent consumption.9 Furthermore, the procedure is simple and easy to perform and economic.10

Molecular imprinted polymers (MIPs) can be simply prepared using polymerization of functional monomer and cross-linker around target molecules. The target molecules can be then transferred and artificial recognition sites with size, shape and functional complementary to the target molecules are left. Therefore, the MIPs are capable to particularly rebind to template molecule in presence of other molecules.11,12 In addition, these sorbents have many critical advantages such as low cost, long life, high chemical stability, easy preparation, and predictable specific recognitions.13 Thus, MIPs could be broadly used in SPE. Compared to traditional MIPs, magnetic MIPs nanoparticles (MMIP) have been considered as ideal sorbent materials and received increasing attention. Due to their unique magnetic property, MMIP can be simply separated from the matrix under an external magnetic field after adsorption and recognition. However, MMIP can provide the selectivity for the template compounds.14 Recently, this adsorbent has been used for extraction of many compounds.15–17 The Ag NPs coated with Fe3O4 provides a structure that Ag NPs are just attached to Fe3O4 like glue. The Ag/Fe3O4 composites have excellent superparamagnetism, which show an effective self-aggregation.18

As mentioned, MIPs have many advantages such as stability at extreme of pH and temperature, ease of preparation, low cost and reusability. The MIPs decorated on magnetic nanoparticles (MMIPs) show the unique magnetic property which can be simply separated from the matrix under an external magnetic field after adsorption and recognition. This manner of separation reduces time and costs of the experiments, because there is no need to employ expensive methods such as centrifugation and filtration anymore. In this work, we prepared an Ag NPs coated with magnetic MIPs (MMIPs) nanocomposite. In the structure of such a nanocomposite, Ag NPs are just attached to Fe3O4 like glue. The compound of these magnetic nanoparticles and silver nanoparticle has the following advantages: (a) Ag and Fe3O4 nanoparticles possess unique properties including surface plasmon resonance and superparamagnetism; (b) furthermore, Ag and Fe3O4 have been considered as biocompatible materials. Therefore, in this work, we gained the advantages of both MMIPs and Ag/Fe3O4, simultaneously. To the best of our knowledge, the use of Ag/Fe3O4/MIP nanocomposite as an adsorbent is not reported in the literature.

In this study, magnetic molecularly imprinted polymer with silver nanoparticles (MMIPS) as a matrix was synthesized. This adsorbent has large specific surface area and has more imprinted cavities in the polymer network. In addition, this adsorbent could selectivity recognize the target in complex matrix. The synthesized adsorbent was subsequently used to separate PAHs from the environmental water samples.

2. Materials and methods

2.1. Chemical and reagents

Naphthalene, anthracene, pyrene, benzene, toluene, hexane, cyclohexane, methanol, chloroform, ammonia, FeCl3·6H2O and AgNO3 were obtained from Merck (Darmstadt, Germany). Tetraethyl orthosilicate (TEOS), 4-vinylpyridine (VP), ethyleneglycoldimethacrylate (EGDMA) and 2,2′-azobisisobutyronitrile (AIBN) were purchased from Aldrich (Milwaukee, WI, USA). A stock standard solution of PAHs (100 mg L−1) was prepared every week by dissolving proper amount of this material in acetonitrile and stored at refrigerator. Working solutions were daily prepared in acetonitrile.

2.2. Apparatus

Gas chromatographic (GC) analysis was performed by a GC (Hewlett-Packard 6890, Palo, Alto, CA, USA) equipped with a 30 m × 0.32 mm i.d. with 0.25 μm stationary film thickness HP-5 capillary column and flame ionization detection (FID). The temperature program was 120 °C for 2 min, then programmed at 5 °C min−1 to 260 °C for 12 min, then at 10 °C min−1 to 270 °C, and held constant for 5 min. Other working conditions were performed as follows: carrier gas, helium (99.999%); injector temperature, 250 °C; detector temperature, 270 °C, and splitless mode. A 1.0 μL Hamilton micro-syringe (Reno, NV, USA) was used for injection into GC.

2.3. Synthesis of MMIPS

The exact amount of 90 mg of AgNO3 was suspended in 500 mL deionized water at 45 °C and the mixture was heated quickly, while boiling on stirring plate. Immediately after reaching the boiling point, a solution of 10 mL of 1.0% sodium citrate was added, and the solution was maintained at moderate boiling for 100 min with continuous stirring.

FeCl3·6H2O (1.4 g) was dissolved in 80 mL ethylene glycol, then 0.4 g silver nanoparticles and 3.6 g sodium acetate were added to the mixture. After the stirring at 90 °C for 30 min, the solution was transferred into the autoclave and heated at 200 °C for 6 h. Then the mixture was cooled to the room temperature. The magnetic-silver nanoparticles (MS) were prepared and separated from the mixture by an external magnetic field. The nanoparticles were washed with deionized water for several times.

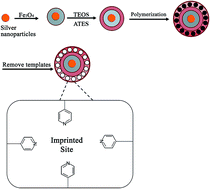
The 0.8 g of MS were dispersed in 120 mL water[thin space (1/6-em)]:[thin space (1/6-em)]ethanol (1[thin space (1/6-em)]:[thin space (1/6-em)]5 v/v) and stirred for 10 min in ultrasonic. Then 1 mL TEOS and 3 mL ammonium hydroxide (25 wt%) were added. The mixture reacted at ambient temperature for 24 h under sonication and MS were encapsulated by SiO2 (MSS-SiO2). The mixture was dispersed in 100 mL water, acetic acid (9[thin space (1/6-em)]:[thin space (1/6-em)]1 v/v) and 0.15 mL (3-aminopropyl) triethoxysilane (ATES) were added and the mixture was then stirred at 60 °C for 5 h. The PAHs (1 mmol) and VP (4 mmol) were dissolved in 10 mL methanol with sonication for 30 min to prepare the solution of pre-assembly. Then, 20 mmol of EGDMA was added to the mixture and kept for 10 min under ultrasound. This solution was stirred exposing the atmospheric nitrogen for 5 min to remove oxygen. 0.4 g MSS and 150 mg AIBN as initiator were then added. The tube was sealed in the vacuum conditions. The polymerization was done in a water bath for 6 h at 60 °C. The residuals were removed by suspend the polymer in pure methanol. The sorbent washed with acetonitrile: acetic acid (1[thin space (1/6-em)]:[thin space (1/6-em)]1 v/v) following Soxhlet extraction procedure, until the PAHs could not be detected by GC. Finally, the sorbent was washed with deionized water (three times), and then dried at 70 °C. Fig. 1 displays the scanning electron microscopy (SEM) of the synthesized sorbent. SEM and Energy Dispersive X-ray Spectrometer (EDX) are commonly used in combination to identify compositional gradients of the sample material at the grain boundaries (Fig. 1b). At the second phase, they are also able to detect inclusion, impurities and even existence of very small amounts of any other material. Moreover, this efficient combination of devices is capable of producing element location maps, distribution and concentration. There was a direct relation between the locations of the peaks detected by SEM/EDX combination and the X-ray “fingerprint” of the element. Total synthesis process of MMIPS is shown in Fig. 2.


image file: c6ra08499k-f1.tif
Fig. 1 The SEM image of MMIPS (a) and EDX spectrum of nanocomposite.

image file: c6ra08499k-f2.tif
Fig. 2 Polymerization process for MMIPS.

2.4. Procedure

Extraction method was done according to the following steps: a 10 mL solution of the PAHs (0.5 mg L−1) was prepared in a 10 mL conical tube by adding an appropriate amount of the standard stock solution of PAHs followed by adding 10 mg adsorbent. The mixture was sonicated for 5–20 min to facilitate mass transfer and extraction of the target compounds onto the adsorbent. After the extraction, MMIPS were removed quickly from the solution by an external permanent magnet. The supernatant were then decanted. For desorption of analytes, the adsorbent was eluted with 50 μL of acetonitrile, then sonicated for 5 min. Finally, the elute was separated from the adsorbent by the external magnet and 1 μL of it was injected into the GC for next analysis.

3. Results and discussion

3.1. Characterization

The FT-IR spectrum was recorded by KBr pellet. The FT-IR spectrum of MMIPS adsorbent is shown in Fig. 3. The observed peak at 618 cm−1 was assigned to the Fe–O bond. The characteristic peak around 1130 cm−1 was assigned to Si–O–Si bond. The peak at 2967 cm−1 showed the stretching vibration of C–H group in CH3. The observed peak at 1731 cm−1 indicated the C[double bond, length as m-dash]O stretching vibration.11 Also, the peak around in the region of 1648–1638 cm−1 was absence, which is characteristic absence of vinyl groups in polymer. This fact confirms the polymerization of vinyl pyridine in the functional monomer.
image file: c6ra08499k-f3.tif
Fig. 3 The FT-IR spectrum of MMIPS.

3.2. Optimization of the conditions

Extraction of target compounds from aqueous solution will be effective and quantitative when enough amount of adsorbent comparing the amount of target compounds has been consumed. To study the influence of adsorbent quantity on the extraction recovery, various amount of adsorbent in the range of 5 to 50 mg were added to the aqueous solution. The results are shown in Fig. 4. The best extraction recovery of PAHs could be obtained by 10 mg of adsorbent. When the amount of adsorbent was higher than 10 mg, the extraction recovery did not get much improvement. Compared to ordinary adsorbents, the nanoparticles adsorbents have higher surface area, thus the results can be improved by lower amounts of these adsorbents. Furthermore, because of the shorter diffusion distance for nanoparticles and magnetically separation of the adsorbent from aqueous solutions, extraction recovery of analytes can be done in a shorter time. To study the influence of extraction time on extraction recovery of PAHs, it was ranged within 5 to 20 min (Fig. 5). The results showed that extraction time exceeding 10 min had no effect on the extraction recovery. Thereby, 10 min was chosen as extraction time for the next experiments.
image file: c6ra08499k-f4.tif
Fig. 4 Effect of amount of adsorbent on the extraction recovery.

image file: c6ra08499k-f5.tif
Fig. 5 Effect of extraction time on the extraction recovery.

It is essential to decrease the matrix effect after the extraction of target compounds and improve the selective binding of the analytes. In this work, desorption of the PAHs was studied using various solvents including hexane, cyclohexane, acetonitrile, benzene and toluene. Among the various eluents, desorption ability of cyclohexane was found to be higher than the other eluents (Fig. 6). Effect of the eluent volume on desorption of PAHs was studied in the range of 30 to 100 μL. The results indicated that all the target compounds could be desorbed from the adsorbent by elution with 50 μL cyclohexane. The effect of desorption times of target compounds was studied by changing the time from ranging from 2 to 10 min. As shown in Fig. 7, 5 min of desorption appeared to be the optimum value for the elution of target compounds.


image file: c6ra08499k-f6.tif
Fig. 6 Effect of type of solvent on the extraction recovery.

image file: c6ra08499k-f7.tif
Fig. 7 Effect of desorption time on the extraction recovery.

The effect of pH of sample solution on the extraction of PAHs was also investigated. The extraction recovery did not change significantly ranging from 4.0 to 7.0. This range was examined for all sample solutions. Therefore, there was no need for changing the pH prior to the extraction. In addition, the extraction and desorption cycles were repeated at least seven times, using the same adsorbent to evaluate the reusability of multifunctional adsorbent. The results showed that over five times, the capacity of the MMIPS adsorption began to decrease. This was generally resulted from the partial destruction of the polymer cavity, and showed the adsorbent stable recyclable activity.

3.3. Isothermal adsorption experiment

The binding isotherm results of MMIPS re-binding performance were plotted (Fig. 8a). The adsorbtion of PAHs onto the adsorbent, enhanced by increasing the initial PAHs concentration. To more evaluate and specify the adsorption parameters of adsorbent, Scatchard analysis were applied to describe the binding characteristics.19 Scatchard equation is considered as follows:
 
image file: c6ra08499k-t1.tif(1)
where Q (mg g−1) is the amount of PAHs bound to the adsorbents at equilibrium; C (mg L−1) is the free PAHs concentration at equilibrium; Qmax (mg g−1) and K (mg L−1) are the apparent maximum binding amount and dissociation constant, respectively. The data can be obtained from the intercept and slope of the linear line plotted in Q/C versus Q. As shown in Fig. 8b, the Scatchard plot of adsorbent have two linear parts by different slopes. The equation and amount of K and Qmax for high and low affinity sites are shown in Table 1. The ratio among Q/C versus Q could not be described using linear equation, which explained that there were various interactions when molecular imprinted polymers adsorbed PAHs (Fig. 8b). Therefore, MIPs had non-equal valence binding locations. This was expected for this kind of non intervalence type of MIPs due to various compounds which were formed by the bonding among imprinted template molecule and functional monomer.19

image file: c6ra08499k-f8.tif
Fig. 8 The adsorption isotherms (a) and the Scatchard plot of adsorbent.
Table 1 Recognition properties of adsorbent
Affinity Naphthalene Anthracene Pyrene
Equation Ka Qmaxb Equation K Qmax Equation K Qmax
a Dissociation constant (K: mg L−1).b Apparent maximum binding amount (Qmax: mg g−1).
Low affinity y = −0.0288x + 6.5763 34.722 228.344 y = −0.0108x + 2.372 92.593 219.629 y = −0.0271x + 4.7997 36.900 177.111
High affinity y = −0.0946x + 10.086 10.571 106.617 y = −0.2709x + 10.841 3.691 40.018 y = −0.2355x + 12.073 4.246 51.265


3.4. Method validation

Calibration curve of PAHs was achieved by plotting the peak area versus the concentration of the target compounds. The dynamic range for all compounds was obtained from 5–1000 μg L−1. Data were subjected to least squares regression analysis to obtain information on the linearity of the procedure. The results are presented in Table 2. The sensitivity of the procedure was investigated by the limit of detection (LOD). The LOD was calculated as three times signal to noise ratio. The LOD of target compounds were in the range 0.01–0.09 μg L−1. In order to describe the precision, relative standard deviations (RSD%) of inter-day and intra-day precisions in the concentration of 100 μg L−1 of target compounds were calculated. The intra-day was calculated with five replicates of sample analyzed in the same day, and the inter-day was obtained by analyzing aqueous sample once a day during ten consecutive days. Precisions of intra-day and inter-day were in the range 1.1–6.2% and 5.9–10.2%, respectively. The results are shown in Table 2.
Table 2 The characteristic of calibration curve
Analyte Slope r2 LOD (μg L−1) RSD% (inter-day) RSD% (intra-day)
Naphthalene 0.0105 0.9995 0.09 10.2 3.7
Anthracene 0.0109 0.9995 0.07 5.9 1.1
Pyrene 0.0523 0.9991 0.01 7.8 6.2


Various analytical procedures for extraction and determination of PAHs were summarized in Table 3.3,20,21 Our results showed that the LODs, RSD% and extraction time of this procedure were comparable or superior to other methods. Also, the amount of adsorbent in this work (10 mg) indicated large adsorption capacity of the adsorbent. In addition, traditional column passing methods was avoided because of magnetism property of MMIPS, and the separation time was saved. This adsorbent had selectivity for these compounds due to the MIP technique that were used. Among other procedures, dispersion solid phase extraction (DSPE) procedure seems to be faster and easier, nevertheless the process required manual grind, making the procedure strenuous.11 The comparison showed that the procedure in this work was fast enough and efficient for extraction and determination of PAHs in environmental water samples.

Table 3 Comparison of the proposed procedure with other extraction procedures for the determination of the PAHs in water samples
Procedures Dynamic linear range (μg L−1) LOD (μg L−1) RSD% Extraction time (min) Ref.
HLLME-FA-GC-FID 50–1000 14–41 3.7–10.3 5 3
HLLE-GC-FID 0.1–400 0.02–0.1 3.4–10.3 A few seconds 20
Hollow-fiber-LPME-GC-MS 0.5–100 0.002–0.047 ≤13.6 35 21
MMIPS-GC-FID 5–1000 0.01–0.09 1.1–6.2 10 This work


To study the reliability and applicability of the proposed procedure, it was used to determine PAHs in various water samples. The recoveries of PAHs were studied for the environmental water samples by analyzing the spiked samples under the optimization conditions. The concentrations of target compounds added into the real samples were 50 and 100 μg L−1. The results in Table 4 indicated that adsorbent had good extraction recovery (92.8–96.7%) for the determination of PAHs in real water samples.

Table 4 Determination of PAHs in real samples (n = 3)
Sample Added (μg L−1) Naphthalene Anthracene Pyrene
R% (RSDa%)
a Relative standard deviation.
Tap water 50 96.5 ± 2.5 95.1 ± 2.1 94.8 ± 1.9
100 95.2 ± 1.1 95.9 ± 1.8 94.5 ± 2.2
Well water 50 96.1 ± 1.9 96.7 ± 2.8 95.6 ± 3.6
100 93.9 ± 2.5 94.8 ± 4.1 94.3 ± 3.7
Waste water 50 93.9 ± 6.2 96.2 ± 5.8 95.1 ± 6.1
100 96.3 ± 5.4 92.8 ± 6.0 94.6 ± 4.9


4. Conclusion

In this study, a new procedure was used to synthesize magnetic molecularly imprinted polymer based on silver nanoparticles. The polymer was used as a selective extraction adsorbent for the determination of PAHs in water samples. The equilibrium data of adsorbent was investigated by Scatchard analysis. Presence of magnetic nanoparticles adsorbent enhanced the rate of the described procedure.22 Also, MMIPs offer high efficiency, high extraction capacity and rapid extraction. Furthermore, dispersive solid phase extraction has its own advantages including high extraction efficiency and low solvent consumption. Moreover, the results indicated the inter-day and intra-day precisions, low LOD and wide dynamic linear range of the procedure. Finally, this procedure was used for extraction and analysis of PAHs in water samples and acceptable results were achieved.

Acknowledgements

The authors wish to thank Dr Ehsan Rakhshani who assisted in the proof-reading of the manuscript.

References

  1. M. A. Hossain, F. Yeasmin, S. M. M. Rahman and M. S. Rana, Arabian J. Chem., 2011 DOI:10.1016/j.arabjc.2011.02.012.
  2. Environmental Quality Standards for Soil and Water, Netherlands Ministry of Housing, Physical Planning and Environment, Leidschendam, 1991 Search PubMed.
  3. M. Haji Hosseini, M. Rezaee, S. Akbarian, F. Mizani, M. R. Pourjavid and M. Arabieh, Anal. Chim. Acta, 2013, 762, 54–60 CrossRef PubMed.
  4. F. Lu, S. Zhang and L. Zheng, J. Mol. Liq., 2012, 173, 42–46 CrossRef CAS.
  5. A. A. Nuhu, C. Basheer, A. A. Shaikh and A. R. Al-Arfaj, J. Nanomater., 2012, 2012, 1–7 CrossRef.
  6. E.U. Directive 2008/105/EC, 2008, Official Journal of the European Communities L-348/84 (24th December, 2008), Council Directive (16th December, 2008) on environmental quality standards for water policy.
  7. A. A. Asgharinezhad, N. Mollazadeh, H. Ebrahimzadeh, F. Mirbabaei and N. Shekari, J. Chromatogr. A, 2014, 1338, 1–8 CrossRef CAS PubMed.
  8. M. Khajeh and M. Gharan, J. Chemom., 2014, 28, 539–547 CrossRef CAS.
  9. M. Khajeh, S. Laurent and K. Dastafkan, Chem. Rev., 2013, 113, 7728–7768 CrossRef CAS PubMed.
  10. Y. G. Zhao, X. H. Chen, S. D. Pan, H. Zhu, H. Y. Shen and M. C. Jin, Talanta, 2013, 115, 787–797 CrossRef CAS PubMed.
  11. G. Ma and L. Chen, J. Chromatogr. A, 2014, 1329, 1–9 CrossRef CAS PubMed.
  12. J. Otero-Romani, A. Moreda-Pineiro, P. Bermejo-Barrera and A. Martin-Esteban, Microchem. J., 2009, 93, 225–231 CrossRef CAS.
  13. F. G. Tamayo, E. Turiel and A. Martin-Esteban, J. Chromatogr. A, 2007, 1152, 32–40 CrossRef CAS PubMed.
  14. J. Xie, L. Chen, C. Li and X. Xu, J. Chromatogr. B: Anal. Technol. Biomed. Life Sci., 2003, 788, 233–242 CrossRef CAS.
  15. L. M. Chang, S. N. Chen and X. Li, Appl. Surf. Sci., 2012, 258, 6660–6664 CrossRef CAS.
  16. F. G. Lu, H. J. Li, M. Sun, L. L. Fan, H. M. Qiu, X. J. Li and C. N. Luo, Anal. Chim. Acta, 2012, 718, 84–91 CrossRef CAS PubMed.
  17. D. Xiao, P. Dramou, N. Q. Xiong, H. He, D. H. Yuan, H. Dai, H. Li, X. M. He, J. Peng and N. Li, Analyst, 2013, 138, 3287–3296 RSC.
  18. Y. Shan, Y. Yang, Y. Cao and Z. Huang, RSC Adv., 2015, 5, 102610–102618 RSC.
  19. X. H. Gu, R. Xu, G. L. Yuan, H. Lu, B. R. Gu and H. P. Xie, Anal. Chim. Acta, 2010, 675, 64–70 CrossRef CAS PubMed.
  20. L. Tavakoli, Y. Yamini, H. Ebrahimzadeh and S. Shariati, J. Chromatogr. A, 2008, 1196, 133–138 CrossRef PubMed.
  21. C. Basheer, R. Balasubramanian and H. K. Lee, J. Chromatogr. A, 2003, 1016, 1–20 CrossRef.
  22. X. You and L. Chen, Anal. Methods, 2016, 8, 1003–1012 RSC.

This journal is © The Royal Society of Chemistry 2016
Click here to see how this site uses Cookies. View our privacy policy here.