 Open Access Article
Creative Commons Attribution 3.0 Unported Licence
From starch to polylactide and nano-graphene oxide: fully starch derived high performance composites†
Duo
Wu
,
Huan
Xu
 and
Minna
Hakkarainen
 *
*
Department of Fibre and Polymer Technology, School of Chemical Science and Engineering, Royal Institute of Technology (KTH), SE-100 44 Stockholm, Sweden. E-mail: minna@kth.se
First published on 31st May 2016
Abstract
A delicate closed-loop strategy for valorization of starch to value-added products was developed. Carbon sheets, formed of carbon spheres, were obtained by microwave-assisted hydrothermal degradation of starch and then further transformed into nano-sized graphene oxide (nGO, 20 × 30 nm2) under oxygen-rich acidic conditions. The synthesized nGO exhibited self-assembly in solution. Furthermore, nGO strongly attached to the surface of starch granules by hydrogen bonding (nGO@starch, 0.1 wt%) and allowed easy and highly efficient interfacial engineering in PLA/starch composites. After combining with polylactide (PLA), the composites could incorporate up to 30 wt% nGO@starch, while retaining excellent properties. nGO was capable of facilitating PLA crystallization in the composites by providing a number of nucleation sites. Moreover, the interfacial adhesion between PLA and starch was significantly improved by nGO. Though its content was extremely low, nGO improved the mechanical and barrier properties and thermal stability of the PLA/starch composites. The results demonstrate a facile route to value-added starch-derived nGO and further to fully starch derived high performance PLA/starch biocomposites.
Introduction
The valorization and recycling of biomass waste provides an opportunity to transform abundant, widely available and renewable resources into functional chemicals and materials. It is a delicate strategy for establishing a sustainable or closed-loop economy. Starch and polylactide (PLA) represent environmentally friendly and commercially available biobased polymers. They are among the most promising biobased plastics for packaging and other short-term applications. After their service-life, it would be beneficial to retain the material value of starch and PLA by recycling the waste products to new chemicals or materials.1,2 This process could be combined with the simultaneous hydrothermal treatment of agricultural bioproducts that are not suitable for food production.Recently, several studies have focused on PLA/starch biocomposites in the bioplastic market because adding starch to PLA can reduce the cost while preserving the biodegradability and biobased nature of the composites.3,4 However, these materials generally have poor interfacial adhesion between hydrophobic PLA and the hydrophilic starch granules.5 Compatibilizers are therefore required to improve the compatibility between PLA and starch, subsequently the performance of the final PLA/starch composite. The development of green, safe and cheap compatibilizers is highly desirable to maintain the environmentally friendly nature of PLA/starch blends.
Graphene has attracted tremendous attention due to its excellent thermal,6–8 mechanical9–11 and bio-related properties. Graphene oxide (GO) is perhaps the most important derivative of graphene. GO normally contains an abundance of oxygen functional groups, such as carboxyl, epoxy and hydroxyl groups. In polymeric GO nanocomposites, GO can greatly enhance the properties of the host polymers12 and even introduce new properties.13 The oxygen functional groups in GO can improve interfacial adhesion with a polymer matrix through strong hydrogen bonding.14,15 According to pioneering work devoted to the surface activity of GO, GO represents a unique type of building block with hydrophobic π-domains in the basal plane and hydrophilic carboxyl groups on the edge.16 Therefore, GO exhibits an amphiphilic character and has good potential as a compatibilizer for immiscible blends or composites between hydrophilic fillers and hydrophobic polymers.17 Nano-sized graphene oxide (nGO), as its name suggests, is graphene oxide with nanometer-scale lateral dimensions.18 A few research groups have explored nGO for biomedical applications, such as cellular imaging and drug delivery via noncovalent physisorption.19–21 nGO is expected to be more stable as a colloid than normal GO because of its small size.18 In addition, because it is a nano-sized amphiphile, nGO has a higher specific surface area than GO, which makes it a more effective surfactant.
It has been proven that GO can enhance several properties of PLA, including crystallization,22–25 mechanical,10,11,26,27 thermal stabilities,6,26 and gas barrier properties.25,28,29 In contrast, in composites with starch, GO can increase the mechanical properties30–32 and the thermal stability of starch.30,32,33 Based on its chemical structure and the promising property enhancements in the cases of pure PLA and starch composites, we anticipated that GO could be a potential property enhancing compatibilizer for PLA/starch composites and could improve the poor interfacial interactions between PLA and starch.
We have earlier developed closed-loop strategies for feedstock recycling of starch and PLA.1,2 Moreover, carbon spheres (C-spheres) were obtained from microwave-assisted hydrothermal degradation of cellulose, starch or waste paper.1,34,35 We further demonstrated a simple preparation route for nGO via C-spheres derived from cellulose.36,37 We also demonstrated that commercial graphene oxide sheets function as effective compatibilizers in PLA/starch composites.38 Here, we aimed to prepare nGO from the starch based C-spheres and to evaluate the obtained nGO as compatibilizer for PLA/starch composites to reach fully starch derived high performance composites. Our hypothesis was that the obtained starch-derived nGO could tightly attach to the starch granule surface through strong hydrogen bonding. Then, the nGO and starch assembly (nGO@starch) could be well integrated within the PLA matrix due to the high compatibilization effect of nGO towards starch and PLA. This would offer an excellent closed-loop route for fully starch derived composites that begins with the preparation of starch-based nGO and its further utilization as the compatibilizer for PLA/starch composites.
Experimental
Materials
Tapioca starch was obtained from Ibu Tani, cap anak no. 1 (Bogor, Indonesia). H2SO4 (95–98%) and nitric acid (HNO3) (70%) were obtained from Sigma-Aldrich Chemie GmbH (Steinheim, Germany and St. Louis, USA). PLLA under the trade name of 4032D, comprising approximately 2% D-LA, was supplied by NatureWorks (USA).25,39 Ethanol and dichloromethane were obtained from VWR (Germany). All chemicals were used as received.Microwave-assisted synthesis of C-spheres
Starch powder weighing 2 g was put into a glass vial where 20 mL of sulfuric acid solution (0.01 g mL−1 in water) was added. Four parallel vials were placed together in the reaction chamber of a microwave oven (SynthWAVE, Milestone Inc.). The pressure in the chamber was 40 bar of nitrogen. The temperature was increased to 160 °C within a 20 min RAMP time and maintained at a constant temperature for 2 h. Subsequently, the reaction system was automatically cooled to room temperature. The obtained residues were in the form of black carbon sheets (C-sheets). The obtained sheets were very fragile and were easily ruptured into black carbon spheres (C-spheres). All of the C-sheets and C-spheres were dried in a vacuum oven at 25 °C.Synthesis of nGO
A simplified Hummers' method, earlier developed for production of nano graphene oxide from cellulose based C-spheres, was applied in this work.36 Briefly, a 5 mL solution of C-spheres from starch in HNO3 (1![[thin space (1/6-em)]](https://www.rsc.org/images/entities/char_2009.gif) :
:![[thin space (1/6-em)]](https://www.rsc.org/images/entities/char_2009.gif) 100, w/w) was kept in a 100 mL one-neck round-bottom flask. This solution was first sonicated at 45 °C for 30 min. It was then heated in an oil bath at 90 °C for another 30 min. The solution was poured into 50 mL of cold deionized H2O (15 °C) to stop the reaction. The solvent was removed by rotary evaporation and then freezes dried to acquire an orange powder.
100, w/w) was kept in a 100 mL one-neck round-bottom flask. This solution was first sonicated at 45 °C for 30 min. It was then heated in an oil bath at 90 °C for another 30 min. The solution was poured into 50 mL of cold deionized H2O (15 °C) to stop the reaction. The solvent was removed by rotary evaporation and then freezes dried to acquire an orange powder.
Preparation of PLA/starch composites
GO sheets and the obtained nGO were ultrasonically dispersed in ethanol (0.5 mg mL−1). They were gradually dropped into a starch ethanol suspension (0.05 g mL−1) at a volume ratio of 1/10. The suspensions were labeled GO@starch and nGO@starch. Each suspension was stirred for 4 h to ensure complete mixing.Neat starch in ethanol, and GO@starch and nGO@starch suspensions were added to a PLA dichloromethane solution to obtain PLA/starch, PLA/GO@starch and PLA/nGO@starch composites. For each type of composite, there were three starch contents: 10%, 20% and 30% (wt%). The coagulated composites were precipitated from solution. After completely drying, the coagulations were compression molded into films at 180 °C under a fixed pressure of 5 MPa (Fontijne Press). A pure PLA film was subjected to the same processing and served as a control material.
Characterization
Results and discussion
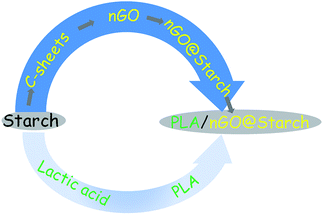
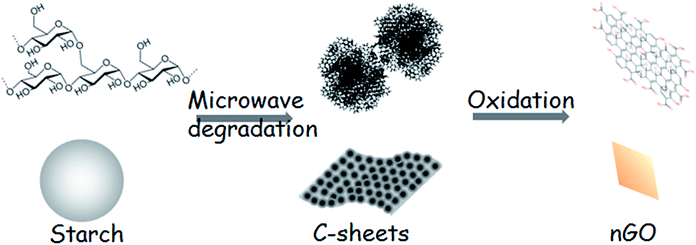
Scheme 1 illustrates the production of nGO and fully starch based composites from starch as starting material. Firstly, 2D C-sheets were formed after the microwave-assisted reaction. C-sheets were constructed of C-spheres and could be further oxidized to a novel nGO product. The nGO could attach to the surface of starch granules, presumably by hydrogen bonding, and this assembly compatibilized the starch–PLA interface in composites. The prepared nGO was first characterized by SEM, FTIR and XRD. Second, the size and self-assembly behavior of nGO were examined by DLS, TEM and AFM. Furthermore, the adsorption of nGO on the surface of starch granules was imaged. Finally, multiple techniques were employed to evaluate nGO as a property enhancer in the PLA/starch composites. The influence of nGO on the composite properties such as crystallization, mechanical property, thermal stability and oxygen permeability were discussed and compared with the properties of composites containing traditional larger GO sheets.38Transformation of starch to nGO
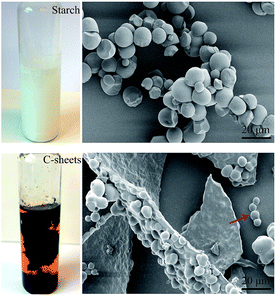
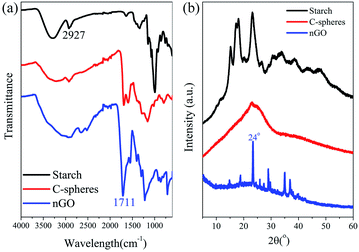
Black C-sheet clusters were suspended in vials after microwave hydrothermal treatment of starch (the photo shown in Fig. 1). We have earlier reported that the microwave-assisted acid-catalyzed hydrothermal degradation of starch resulted in spherical humin particles or C-spheres.1 A closer look of the now formed C-sheets by SEM showed that the C-sheets also consisted of carbon spheres. The microwave oven used in this work allows higher pressures than the one used in previous work. This together with higher amount of the starting material (2 g of starch instead of 0.5 g as in previous work) led to a higher yield of C-sphere residue. These C-spheres tended to coalescence in two dimensions to form sheets, which had a thickness of approximately one sphere. Probably the high temperature and high pressure could compact the individual C-spheres into larger sheets. The growth of the sheet seems to only extend along a single lateral direction (red arrow in Fig. 1). This behavior might be due to the condensation,40 polymerization41 or physisorption of HMF locates at surface of C-spheres during the microwave thermal heating.C-sheets were easily broken into C-spheres during the collecting procedure. Then, they were oxidized and degraded to nGO under O-rich acidic conditions. Fig. 2a shows the FTIR spectra of starch, C-spheres and nGO, which clarify the transformation from starch to nGO. The peak at 2927 cm−1 is indicative of the –CH2– stretching vibration in starch. The C–O bond stretching of starch is between 1080 and 930 cm−1. A 5-(hydroxymethyl)furfural (5-HMF) intermediate is first formed by the depolymerization of starch to glucose and then to 5-HMF. 5-HMF further converts to levulinic acid and formic acid, which remain in solution phase. Meanwhile, the carbonaceous structure in C-sphere residues can form by alternative route through polymerization and dehydration of 5-HMF.1,34,35 The IR spectrum of C-spheres in Fig. 2a shows aromatic groups (sp2-hybridized carbon C![[double bond, length as m-dash]](https://www.rsc.org/images/entities/char_e001.gif) C stretching at approximately 1500–1600 cm−1). The C
C stretching at approximately 1500–1600 cm−1). The C![[double bond, length as m-dash]](https://www.rsc.org/images/entities/char_e001.gif) O stretching at 1705 cm−1 and the C–O stretching between 1000 and 1260 cm−1 were also observed for C-spheres. For nGO, higher amount of oxygen groups were present. In addition to alcohols (stretching of C–OH at 3560 cm−1), carboxylic acids (stretching of C
O stretching at 1705 cm−1 and the C–O stretching between 1000 and 1260 cm−1 were also observed for C-spheres. For nGO, higher amount of oxygen groups were present. In addition to alcohols (stretching of C–OH at 3560 cm−1), carboxylic acids (stretching of C![[double bond, length as m-dash]](https://www.rsc.org/images/entities/char_e001.gif) O at 1711 cm−1) and epoxides (stretching of C–O–C at 1230 cm−1), aromatic sp2 carbons (C
O at 1711 cm−1) and epoxides (stretching of C–O–C at 1230 cm−1), aromatic sp2 carbons (C![[double bond, length as m-dash]](https://www.rsc.org/images/entities/char_e001.gif) C at 1570 cm−1) remained in the structure, which indicated that a graphene oxide structure was formed during the oxidation reaction.
C at 1570 cm−1) remained in the structure, which indicated that a graphene oxide structure was formed during the oxidation reaction.
In addition, XRD spectra of these materials provide additional evidence for this transformation route (Fig. 2b). The original starch had a semi-crystalline structure with peaks typical of A-type crystals (2θ = 15.3°, 17.0–18.0°, 19.9° and 23.2°).42 After microwave heating, the XRD spectrum of C-spheres shows a broad peak at approximately 24°, which should correspond to the (002) of the graphitic plane. This is in accordance with reports stating that graphitic flakes are located on the surface of C-spheres.36,43 The graphitic structure was even more obvious after the oxidation reaction. The sharp high-intensity peak (002, 2θ = 24°) that indicates a strong graphitic structure with a 0.37 nm interlayer spacing existed in nGO. Moreover, there are some lower intensity peaks at 2θ = 18.8°, 14.8°, and 9.8°, which may be due to the functional oxygen groups that lead nGO sheets to stack more loosely than GO. The assembly of nGO results in a multilayer graphene oxide structure,44 which indicates that polydispersed crystals existed in nGO.
Fig. 3 shows the XPS analysis performed on C-sphere and nGO. XPS spectrum is taken from the surface layers instead of the core of C-sphere. nGO got an apparent decrease for C/O ratio, from 4.1 to 2.2 (Fig. 3a). C1s for C-sphere and nGO exhibited components of C–C, C![[double bond, length as m-dash]](https://www.rsc.org/images/entities/char_e001.gif) C, C–O, C–O–C and O
C, C–O, C–O–C and O![[double bond, length as m-dash]](https://www.rsc.org/images/entities/char_e001.gif) C–O in different intensities and percentages (C1s in Fig. 3b). Trend in C1s showed that C–C structure transferred forward to C–O containing structure at higher binding energy. There is π–π* bond peak at 291.2 eV displayed in the surface of C-sphere, indicating π conjugation structure. XRD proved that more oxygen-containing groups were introduced through synthesis of nGO.
C–O in different intensities and percentages (C1s in Fig. 3b). Trend in C1s showed that C–C structure transferred forward to C–O containing structure at higher binding energy. There is π–π* bond peak at 291.2 eV displayed in the surface of C-sphere, indicating π conjugation structure. XRD proved that more oxygen-containing groups were introduced through synthesis of nGO.
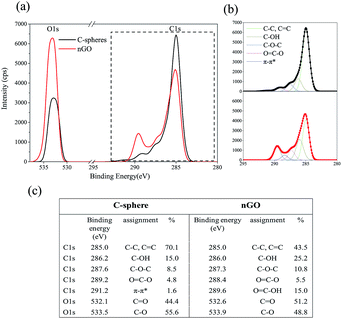 | ||
| Fig. 3 C1s and O1s XPS of C-sphere (black line) and nGO (red line) (a). High resolution of C1s and O1s (b). Table of C1s and O1s positions and intensities for C-sphere and nGO (c). | ||
Size and assembly of nGO
As shown in Fig. 4, the size of nGO was monitored by TEM and DLS. The solution was sonicated before taking DLS and TEM measurements to avoid the formation of large agglomerates. From DLS, an average particle size of approximately 30 nm was obtained for nGO (H2O, 0.0125 mg mL−1). TEM was performed after the water was removed via natural drying; a gradual evaporation of the solvent promoted the aggregation of nGO. As shown in the TEM images (Fig. 4), the flat and transparent nGO sheets had a strong tendency to agglomerate into clusters (100 nm diameter on average, as calculated using the ImageJ software), where nGO organized in a star shape. The unique amphiphilic property and the dimensional feature enable nGO to form various secondary interactions, such as electrostatic, π–π, hydrogen bonding and/or hydrophobic interactions. Our previous study reported the interesting supramolecular self-association of cellulose derived nGO.37 Among all of the possible secondary interactions, the electrostatic interaction is the main operative force.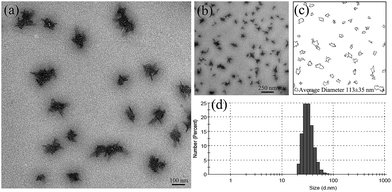 | ||
| Fig. 4 TEM images of nGO (a and b), the average size was determined using the ImageJ software (c), and the average size and the size distribution of nGO was determined by DLS at 25 °C (d). | ||
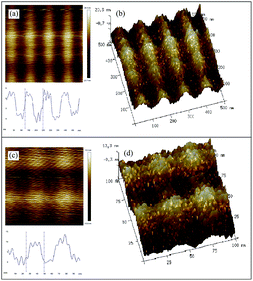
The self-assembly behavior of starch based nGO was also investigated by AFM. nGO (acetone, 1 mg mL−1) displayed an interesting ordered assembly in the form of parallel ribbons (Fig. 5). The width of each band was approximately 30 nm, and the height was less than 20 nm, which agrees quite well with the lateral size of a single nGO. We therefore infer that nGO undergoes layer by layer self-assembly in acetone. The electrostatic interactions are weakened in acetone; the π–π core stacking of nGO can therefore result in the ordered layer-by-layer assembly.
Based on the above discussion, the transformation from starch to nGO is proposed to proceed according to Scheme 2. 2D C-sheets were formed after the microwave-assisted hydrothermal degradation of starch. C-sheets are composed of C-spheres, and they can be further oxidized to nGO under O-rich acidic conditions.
Attachment of nGO to starch granules
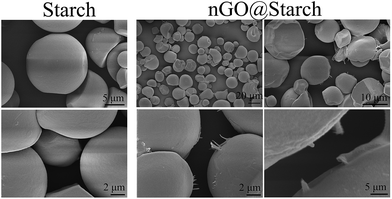
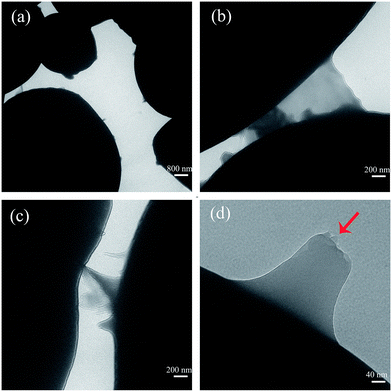
nGO was individually mixed with starch and then incorporated into PLA. It has been reported that GO can form strong hydrogen bonding interactions with the multiple hydroxyl groups on the surface of starch granules due to the various oxygen groups in GO.30,31 nGO was ultrasonically dispersed in ethanol and then gradually dropped into starch ethanol suspensions. The adherence of nGO to the starch granules could be detected by SEM and TEM (Fig. 6 and 7).The original starch had a very smooth surface (Fig. 6). After stir-mixing with nGO, some starch granules were decorated with nGO sheets (Fig. 6 and 7). SEM and TEM clearly illustrated the nGO adhered to or covered the spherical starch granule surface. Traces of nGO with different sizes suggest a wide polydispersity in the crystal structure. It can be seen from TEM that nGO is transparent with a flat 2D structure (Fig. 7). The bonding occurs at the periphery of nGO sheets, which suggests that the driving force are based on the interactions between nGO edges and starch, i.e., hydrogen bonding interactions between the hydroxyl groups in starch and the various oxygen groups in GO. Furthermore, smaller particles of nGO were linked to starch on one side and exposed on the other side (Fig. 7a). However, some larger nGO sheets could also connect two starch granules (Fig. 7b and c). This phenomenon indicates that larger sized nGO could promote the agglomeration of starch granules, which is not good for homogeneous dispersion. Multilayer nGO was also observed by TEM (Fig. 7d, red arrow) and indicated that the π–π stacking of individual nGO also occurred while the nGO interacted with the surface of the starch.
FTIR imaging was employed to see how starch and nGO dispersed after the nGO attached to the starch. 2927 cm−1 and 1711 cm−1 (Fig. S1†) are characteristic peaks of starch and nGO, respectively. Fig. S1† suggests that nGO@starch was evenly dispersed, and no agglomerations were shown. With SEM, TEM, and FTIR imaging, we proved that nGO could attach to the starch surface. nGO with smaller sizes are beneficial for stabilizing homogeneous starch dispersions.
Characterization of PLA/starch composites
Pure PLA, PLA/starch and PLA/nGO@starch with 10%, 20% and 30% (wt%) starch were prepared. Their properties, including crystallization behavior, mechanical properties, thermal stability and oxygen permeability, were compared to study the function of nGO in PLA/starch composites.Crystallization properties
2D-WAXD diffraction was utilized to identify the structural features of the crystalline entities that developed in pure PLA, and different compositions of PLA/starch and PLA/nGO@starch. In addition, 1D-WAXD intensity profiles were extracted. As shown in Fig. 8a, a weak halo was shown in pure PLA and PLA/starch composites, indicating an almost amorphous PLA phase. This agrees with the 1D-WAXD curves, where only wide amorphous peaks were seen (Fig. 8b). It is interesting to note that PLA/starch30 exhibits several individual circles and shows weak signals in the 1D-WAXD curve. This should be due to the higher concentration of starch, which provides the crystalline structure and attributes to the sharp peak. For the composites containing nGO, circles appeared and became clearer with increasing concentrations. Two distinct diffraction peaks were observed and were typically located at 2θ = 16.7° and 19.0°. These peaks are assigned to the lattice planes (200)/(110) and (203) of the α-crystal form of PLA. Therefore, a higher crystallinity was obtained with a higher concentration of nGO in the composite. Our previous work established that GO provides more in situ nucleation sites at its edge for PLA crystallization.25 Based on the same principle, it was believed that nGO in the PLA/starch composites could improve the PLA crystallinity by supplying an abundance of nucleation sites.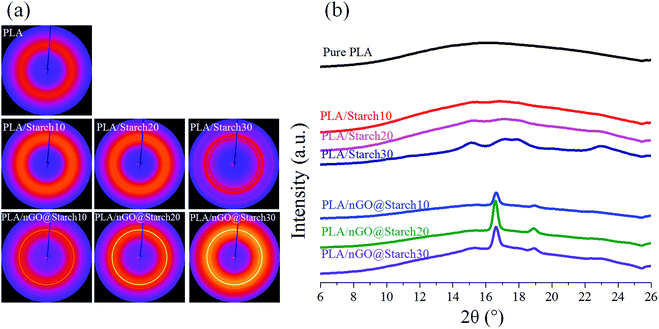 | ||
| Fig. 8 2D-WAXD images (a) and 1D-WAXD intensity curves (b) of pure PLA, PLA/starch composites and PLA/nGO@starch composites; each composite type has a starch concentration of 10%, 20% and 30%. | ||
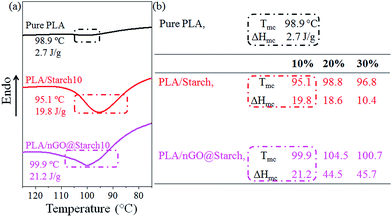
The recrystallization behaviors of all the composites were monitored by DSC; the composites were first melted at 200 °C and then cooled to room temperature. During the cooling, the crystallization temperature (Tmc) and the enthalpy of crystallization (ΔHmc) were recorded (Fig. 9). It should be noted that Tmc indicates the tendency to start crystallizing, while ΔHmc is an index of the formed crystallinity. As shown in the table (Fig. 9b, PLA/starch), the incorporation of starch granules in PLA could reduce the Tmc of PLA (98.9 °C). It should be due to starch granules restricts the rearrangement of molecular chain segments. However, introducing nGO could improve Tmc of PLA/starch composite (Fig. 9b, PLA/nGO@starch), indicating higher tendency to crystallize. It could be because the compatibilization effect of nGO allows PLA being more active to rearrange at interface, thus promote higher tendency to crystallize. It is noticed that in both PLA/starch and PLA/nGO@starch composite group, the Tmc of the 20% composite was higher than the one with 10% starch and 30% composites. The reason is starch granule can, to a small extend, serve as nucleation sites which initialize PLA crystallization. Therefore, Tmc is influenced by the competition between the above two effects.
In the ΔHmc point of view, all composites had higher crystallinity than pure PLA. According to previous work,38 PLA/GO@starch exhibited higher ΔHmc than neat PLA/starch within the same starch composition. This trend was further strengthened in this work by nGO. Therefore, both GO and nGO can promote PLA crystallization, but nGO does it to higher degree than GO. The quantity of nGO particles is much higher than the quantity of GO for the same mass, thus, more nucleation sites for PLA crystallization are offered. Fig. 9b also suggests that PLA/nGO@starch20 and PLA/nGO@starch30 have higher crystallinities upon cooling. The results corroborate the 2D-WAXD data and interpretation. All in all, nGO promotes the crystallization of PLA, resulting in higher crystallinity in PLA/starch composite.
Mechanical property
Starch is a strong candidate for the preparation of PLA composites capable of reducing product cost while maintaining biodegradability. However, the mechanical properties of the composites are generally significantly reduced with an increasing starch content (red bar in Fig. 10b and c, tensile strength decreased from 58 MPa to 30 MPa, 20 MPa and 15 MPa, elongation at break reduced from 11% to 6%, 2% and 1.5%, accordingly). We have earlier shown that amphiphilic PLA oligomers, as compatibilizers, could strengthen interfacial adhesion and improve both the stress and strain of PLA/starch composites.2 The synthesized nGO can be considered an amphiphile, and it could improve both the stress and strain of PLA/starch composites.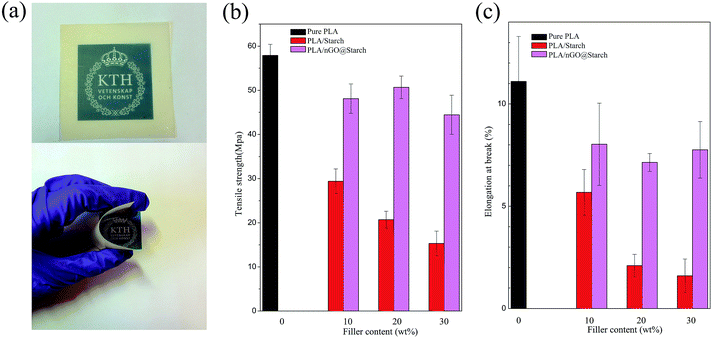 | ||
| Fig. 10 Photos of the PLA/nGO@starch20 film (a), tensile strength (b) and elongation at break (c) of pure PLA, PLA/starch and PLA/nGO@starch, each composite with 10%, 20% and 30% starch. | ||
The effects on PLA/starch composites are depicted in Fig. 10. Because starch was subjected to high temperature during compression moulding, all of the PLA/starch and PLA/nGO@starch composite films were yellowish, to a certain degree (Fig. S2†). It can, however, be seen that nGO highly improved the even dispersion of starch in PLA matrix. PLA/nGO@starch showed high flexibility when bending (Fig. S2b†). The incorporation of nGO, even at an extremely low amount corresponding to 1/1000 the mass of starch, could strengthen both the stress and strain at break (as starch content increasing, tensile strength got improved by 60%, 150% and 200%, elongation at break got increased by 38%, 250% and 430%, respectively). Previous work showed that PLA/GO@starch composites exhibited notably enhanced tensile strengths and elongations at break when compared with the PLA/starch composites;38 the improvements in tensile strength obtained by the addition of nGO were slightly lower to those obtained by adding commercial significantly larger GO sheets (45–50 MPa comparing to 52–58 MPa). However, PLA/nGO@starch exhibited higher elongations at break than PLA/GO@starch ((7–8.3)% comparing to (6.1–6.9)%). It indicated that nGO has higher compatibilization efficiency than GO. This can be explained by the greater number of oxygen functional groups in nGO compared with GO, at comparable mass. Therefore, more hydrogen bonding can be formed in PLA/nGO@starch composites. Interestingly, after the addition of nGO, the tensile stress no longer showed a downward trend as the starch content increased. Therefore, the influence of crystallinity was considered. For the PLA/nGO@starch composite group, PLA/nGO@starch20 has the highest stress and lowest elongation. This might be a consequence of higher crystallinity in the PLA phase. The earlier work, which devoted to study the compatibilization effect of PLA oligomers with polyol end-groups in PLA/starch composite, showed that 10 wt% PLA oligomers with multiple hydroxyl end-groups, as compatibilizer, could improve strength by maximum 140%, could improve elongation at break 8 times more than the one of original PLA/starch composite2 (60/40, wt%). In Fig. 10b and c, the significant improvement of strength (200%) and elongation at break (430%) were achieved by addition of only 0.03 wt% of nGO in PLA/starch composite (70/30 wt%), indicating an extremely high compatibilization effect of nGO in PLA/starch composites. SEM was employed to examine the morphology of the fractured surfaces of the composite films after tensile testing. PLA/starch10 left hollow cavities after fracture (Fig. S3a†). This is explained by the detachment of starch granules from PLA matrix, and it indicates a poor interfacial adhesion between PLA and starch. After introducing GO to the PLA/starch composite, the edges become blurrier. Starch granules were firmly trapped in the PLA matrix. There were fewer gaps around the starch, and only a small amount of starch was missing (Fig. S3b†). GO on the starch surface was detected (Fig. S3b,† inset), along with PLA filaments, which suggested that GO closely attached to the starch on one side and connected to the PLA phase on the other side. GO thus acted as a compatibilizer that strengthened the interfacial adhesion between starch and PLA. Fig. 11 displays the morphology of PLA/nGO@starch for different composition ratios after tensile breakage. There were no large starch aggregates in any of the three composites. Within the same field of view, starch became more visible as the starch content increased. The enlarged images reveal the interfaces between the phases (Fig. 11). No gaps were observed, and PLA was firmly attached to the starch surface. The pullout of PLA further evidenced the improved adhesion strength. The results of the morphology study agree with the tensile test results: adding nGO greatly strengthened both the stress and strain at break.
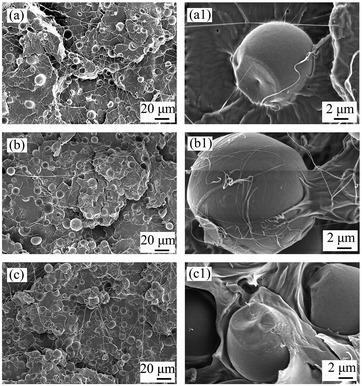 | ||
| Fig. 11 SEM images of the cross sections of PLA/nGO@starch10 (a and a1), PLA/nGO@starch20 (b and b1), and PLA/nGO@starch30 (c and c1) after tensile breakage. | ||
Thermal stability
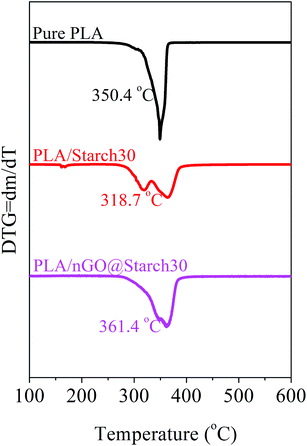
The thermal stability of the PLA/starch composites, as determined by the onset temperature of degradation, decreased with respect to pure PLA (350.4 °C). For all of the composites possessing 30% starch, as shown in Fig. 12, PLA/starch clearly shows two peaks, which likely corresponded to starch and PLA, separately. Thus, the onset temperature decreased sharply to 318.7 °C. With the additions of nGO, these two peaks tended to combine and moved towards higher temperatures (361.4 °C). In comparison the onset temperature for GO@starch was 342 °C showing that nGO is more efficient. This further proved that both PLA/GO@starch and PLA/nGO@starch had improved interfacial interactions between PLA and starch compared with the control. Fig. 12 shows that PLA/nGO@starch exhibited improved thermal stability, which was even higher than that of pure PLA and could be explained by higher crystallinity. This is in accordance with the 2D-WAXD and DSC results. Therefore, we can infer that nGO increased the compatibility between PLA and starch. Meanwhile, nGO could also induce PLA crystallization in the composites.Oxygen permeability
PLA suffers from relatively poor resistance to oxygen permeation. GO has been reported to serve as “nano-barrier walls” in polymer composites.45–47 This could confer PLA with an enhanced barrier property. Additionally, adding starch to PLA can, to a certain extent, improve the barrier property. A PLA/starch bioplastic is nearly the ideal feedstock for manufacturing packaging materials. However, for ideal packaging material lower oxygen permeability is required. As shown in Fig. 13, in each group, the higher the starch content is, the better the barrier property of the composite becomes. Moreover, nGO can further enhance the gas barrier properties of the composites as compared to plain PLA/starch composites. This is explained by improved adhesion between the phases, which leads to less interspace within the films. Additionally, nGO was shown to induce PLA crystallization in situ, and the larger PLA crystals would be a second way to prevent gas penetration. Traditional GO nanosheets, however have a larger lateral size, which furthermore shields gas penetration. Therefore, in barrier studies, earlier reported PLA/GO@starch composites performed somewhat better than PLA/nGO@starch composites. These results still illustrate that GO and nGO can improve the compatibility between PLA and starch and reduce the oxygen permeability of PLA/starch composites.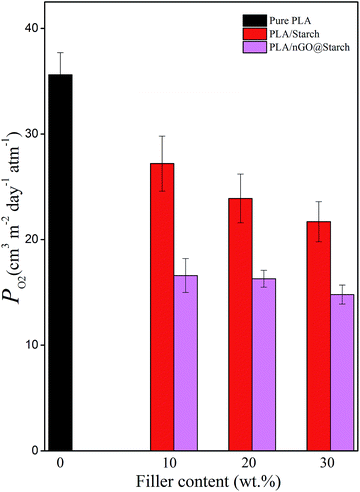 | ||
| Fig. 13 Oxygen permeability of pure PLA, PLA/starch and PLA/nGO@starch composites, each composite with 10%, 20% and 30% starch. | ||
Conclusions
A novel value-added nano-sized graphene oxide (nGO) was synthesized as a byproduct of microwave assisted hydrothermal degradation of starch. 2D carbon sheets, which consisted of carbon spheres, were formed under high pressure via microwave hydrothermal heating. These sheets could be further oxidized to nGO, under O-rich acidic conditions. Starch-based nGO self-assembled in solution due to its unique amphiphilic structure. In addition, nGO could tightly attach to the surface of starch granules and promote compositing with PLA. nGO induced PLA crystallization and reinforced interfacial adhesion between PLA and starch. Even at extremely low levels, nGO induced crystallization and strengthened the mechanical and barrier properties and thermal stability of PLA/starch composites. nGO is, thus, an outstanding compatibilizer for PLA/starch composites. It is derived from abundant biomass resource, starch, providing a route to fully starch derived high performance composites. The closed loop cycle starts from starch and finally returns the material value back to new starch-derived materials, taking a step towards circular economy.Acknowledgements
The authors gratefully appreciate the China Scholarship Council (CSC) for financial support.References
- D. Wu and M. Hakkarainen, ACS Sustainable Chem. Eng., 2014, 2, 2172–2181 CrossRef CAS.
- D. Wu and M. Hakkarainen, Eur. Polym. J., 2015, 64, 126–137 CrossRef CAS.
- F. Rodriguez-Gonzalez, B. Ramsay and B. Favis, Polymer, 2003, 44, 1517–1526 CrossRef CAS.
- J.-F. Zhang and X. Sun, Biomacromolecules, 2004, 5, 1446–1451 CrossRef CAS PubMed.
- L. Yu, K. Dean and L. Li, Prog. Polym. Sci., 2006, 31, 576–602 CrossRef CAS.
- Y. Cao, J. Feng and P. Wu, Carbon, 2010, 48, 3834–3839 CrossRef CAS.
- M. S. Fuhrer, C. N. Lau and A. H. MacDonald, MRS Bull., 2010, 35, 289–295 CrossRef CAS.
- A. A. Balandin, S. Ghosh, W. Bao, I. Calizo, D. Teweldebrhan, F. Miao and C. N. Lau, Nano Lett., 2008, 8, 902–907 CrossRef CAS PubMed.
- D. A. Dikin, S. Stankovich, E. J. Zimney, R. D. Piner, G. H. B. Dommett, G. Evmenenko, S. T. Nguyen and R. S. Ruoff, Nature, 2007, 448, 457–460 CrossRef CAS PubMed.
- O. J. Yoon, C. Y. Jung, I. Y. Sohn, H. J. Kim, B. Hong, M. S. Jhon and N.-E. Lee, Composites, Part A, 2011, 42, 1978–1984 CrossRef.
- P. A. A. P. Marques, G. Gonçalves, M. K. Singh and J. Grácio, J. Nanosci. Nanotechnol., 2012, 12, 6686–6692 CrossRef CAS PubMed.
- H. Xu, Z.-X. Feng, L. Xie and M. Hakkarainen, ACS Sustainable Chem. Eng., 2016, 4, 334–349 CrossRef CAS.
- S. Hassanzadeh, K. H. Adolfsson, D. Wu and M. Hakkarainen, Biomacromolecules, 2016, 17, 256–261 CrossRef CAS PubMed.
- D. Cai and M. Song, J. Mater. Chem., 2010, 20, 7906–7915 RSC.
- R. Rafiq, D. Cai, J. Jin and M. Song, Carbon, 2010, 48, 4309–4314 CrossRef CAS.
- J. Kim, L. J. Cote, F. Kim, W. Yuan, K. R. Shull and J. Huang, J. Am. Chem. Soc., 2010, 132, 8180–8186 CrossRef CAS PubMed.
- Y. Cao, J. Zhang, J. Feng and P. Wu, ACS Nano, 2011, 5, 5920–5927 CrossRef CAS PubMed.
- J. Luo, L. J. Cote, V. C. Tung, A. T. Tan, P. E. Goins, J. Wu and J. Huang, J. Am. Chem. Soc., 2010, 132, 17667–17669 CrossRef CAS PubMed.
- X. Sun, Z. Liu, K. Welsher, J. T. Robinson, A. Goodwin, S. Zaric and H. Dai, Nano Res., 2008, 1, 203–212 CrossRef CAS PubMed.
- Z. Liu, J. T. Robinson, X. Sun and H. Dai, J. Am. Chem. Soc., 2008, 130, 10876–10877 CrossRef CAS PubMed.
- X. Yang, X. Zhang, Z. Liu, Y. Ma, Y. Huang and Y. Chen, J. Phys. Chem. C, 2008, 112, 17554–17558 CAS.
- J.-Z. Xu, T. Chen, C.-L. Yang, Z.-M. Li, Y.-M. Mao, B.-Q. Zeng and B. S. Hsiao, Macromolecules, 2010, 43, 5000–5008 CrossRef CAS.
- C. Bao, L. Song, W. Xing, B. Yuan, C. A. Wilkie, J. Huang, Y. Guo and Y. Hu, J. Mater. Chem., 2012, 22, 6088–6096 RSC.
- J.-H. Yang, S.-H. Lin and Y.-D. Lee, J. Mater. Chem., 2012, 22, 10805–10815 RSC.
- H. Xu, D. Wu, X. Yang, L. Xie and M. Hakkarainen, Macromolecules, 2015, 48, 2127–2137 CrossRef CAS.
- P. Chen, Y. Wang, T. Wei, Z. Meng, X. Jia and K. Xi, J. Mater. Chem. A, 2013, 1, 9028–9032 CAS.
- B. W. Chieng, N. A. Ibrahim, W. M. Z. Wan Yunus, M. Z. Hussein and V. Silverajah, Int. J. Mol. Sci., 2012, 13, 10920–10934 CrossRef CAS PubMed.
- A. M. Pinto, J. Cabral, D. A. P. Tanaka, A. M. Mendes and F. D. Magalhães, Polym. Int., 2013, 62, 33–40 CrossRef CAS.
- H.-D. Huang, P.-G. Ren, J.-Z. Xu, L. Xu, G.-J. Zhong, B. S. Hsiao and Z.-M. Li, J. Membr. Sci., 2014, 464, 110–118 CrossRef CAS.
- R. Li, C. Liu and J. Ma, Carbohydr. Polym., 2011, 84, 631–637 CrossRef CAS.
- T. Ma, P. R. Chang, P. Zheng and X. Ma, Carbohydr. Polym., 2013, 94, 63–70 CrossRef CAS PubMed.
- J. Ma, C. Liu, R. Li and J. Wang, J. Appl. Polym. Sci., 2012, 123, 2933–2944 CrossRef CAS.
- P. P. Peregrino, M. J. Sales, M. F. da Silva, M. A. Soler, L. F. da Silva, S. G. Moreira and L. G. Paterno, Carbohydr. Polym., 2014, 106, 305–311 CrossRef CAS PubMed.
- S. Hassanzadeh, N. Aminlashgari and M. Hakkarainen, Carbohydr. Polym., 2014, 112, 448–457 CrossRef CAS PubMed.
- S. Hassanzadeh, N. Aminlashgari and M. Hakkarainen, ACS Sustainable Chem. Eng., 2014, 3, 177–185 CrossRef.
- K. H. Adolfsson, S. Hassanzadeh and M. Hakkarainen, RSC Adv., 2015, 5, 26550–26558 RSC.
- S. Hassanzadeh, K. H. Adolfsson and M. Hakkarainen, RSC Adv., 2015, 5, 57425–57432 RSC.
- H. Xu, L. Xie, D. Wu and M. Hakkarainen, ACS Sustainable Chem. Eng., 2016, 4, 2211–2222 CrossRef CAS.
- R. Offeman and W. Hummers, J. Am. Chem. Soc., 1958, 80, 1339 CrossRef.
- S. K. R. Patil and C. R. F. Lund, Energy Fuels, 2011, 25, 4745–4755 CrossRef CAS.
- X. Qi, M. Watanabe, T. M. Aida and J. R. L. Smith, Green Chem., 2009, 11, 1327–1331 RSC.
- A. Lopez-Rubio, B. M. Flanagan, E. P. Gilbert and M. J. Gidley, Biopolymers, 2008, 89, 761–768 CrossRef CAS PubMed.
- A. Nieto-Marquez, R. Romero, A. Romero and J. L. Valverde, J. Mater. Chem., 2011, 21, 1664–1672 RSC.
- W. Zhang, J. Wei, H. Zhu, K. Zhang, F. Ma, Q. Mei, Z. Zhang and S. Wang, J. Mater. Chem., 2012, 22, 22631–22636 RSC.
- Y.-H. Yang, L. Bolling, M. A. Priolo and J. C. Grunlan, Adv. Mater., 2013, 25, 503–508 CrossRef CAS PubMed.
- H. Kim, Y. Miura and C. W. Macosko, Chem. Mater., 2010, 22, 3441–3450 CrossRef CAS.
- O. C. Compton, S. Kim, C. Pierre, J. M. Torkelson and S. T. Nguyen, Adv. Mater., 2010, 22, 4759–4763 CrossRef CAS PubMed.
Footnote |
| † Electronic supplementary information (ESI) available: FTIR imaging, photos and SEM images of composites. See DOI: 10.1039/c6ra08194k |
| This journal is © The Royal Society of Chemistry 2016 |

