DOI:
10.1039/C6RA07976H
(Paper)
RSC Adv., 2016,
6, 51575-51582
Small organic molecules based on oxazole/thiazole with excellent performances in green and red phosphorescent organic light-emitting diodes†
Received
28th March 2016
, Accepted 30th April 2016
First published on 3rd May 2016
Abstract
Four pure organic molecules based on oxazole/thiazole were designed and characterized, and their relevant thermal, photophysical and electrochemical properties were fully investigated. These compounds (2a–2d) exhibited good thermal stabilities, with endothermic glass transitions over 120 °C, the largest of which was 2d with the endothermic glass transition of 145 °C. Four green devices, in which 2a–2d served as host materials, were fabricated and the device based on compound 2d exhibited the best performance with a maximum current efficiency of 50.7 cd A−1 and maximum power efficiency of 50.1 lm W−1. A red device based on 2d was also fabricated, which displayed a maximum current efficiency of 18.7 cd A−1 and maximum power efficiency of 17.3 lm W−1. The excellent performances of 2a–2d make them promising alternatives for efficient green and red devices.
Introduction
Phosphorescent organic light-emitting diodes (PHOLEDs) are currently developing rapidly due to the dedication of scientists and researchers.1–5 Host materials play an important role in the quantum efficiency and lifetime of electrophosphorescent devices.6,7 The crucial properties of host materials include good thermal stability, suitable HOMO–LUMO level, high triplet energy (ET).
Various host materials have been investigated recently8–12 and researchers have mainly focused on arylamine derivatives,13–16 anthracene derivatives,17,18 and pure hydrocarbon derivatives.19–22 However, there is hardly any literature on pure organic oxazole or thiazole derivatives, especially the use of pure organic oxazole or thiazole derivatives as host materials. Most reported oxazole or thiazole derivatives are coordinated with metal ligands, such as Ir, Pt, Al and Zn, which are proven to be excellent host materials.23–26 In view of the cost of metal ligands and purity of coordination molecules, pure organic molecules are good alternatives due to their ability to undergo various structural modifications and ease of synthesis. It is a well known fact that carbazole derivatives are widely used in electrophosphorescent devices. The advantages of carbazole derivatives are that they have good carrier mobility, rigid structure, high triplet energy and high fluorescent quantum yield.27–29
In this study, in which we combine the excellent properties of two units, oxazole and thiazole derivatives and carbazole derivatives, we design and synthesize four pure organic molecules (2a–2d). Furthermore, these four compounds could be obtained in just two steps in high yield. Owing to the favorable electron-withdrawing ability of oxazole and thiazole derivatives, by introducing these two units into the carbazole backbone, we anticipate that these four molecules could exhibit bipolar charge transport properties and excellent device performances can be obtained.
Results and discussion
Synthesis
The synthetic routes for the four compounds are shown in Scheme 1. The routes are simple and the final compound can be obtained in just two steps. The two key intermediates, 2-(3,5-dibromophenyl)benzo[d]oxazole and 2-(3,5-dibromophenyl)benzo[d]thiazole, were synthesized according to literature methods.30 Compound 2a was synthesized by the Buchwald–Hartwig cross coupling reaction with 2-(3,5-dibromophenyl)benzo[d]oxazole and 9H-carbazole, whereas compounds 2b, 2c and 2d were obtained by the Suzuki coupling reaction of the abovementioned two key intermediates and (9-phenyl-9H-carbazol-3-yl)boronic acid and dibenzo[b,d]furan-4-ylboronic acid. Flash column chromatography and subsequently HPLC were performed to purify the intermediates. All obtained compounds were characterized using 1H NMR, 13C NMR and HRMS.
 |
| | Scheme 1 Synthesis of compounds 2a–2d. | |
Thermal property
The thermal properties of the four compounds were investigated via thermogravimetric analysis (TGA) and differential scanning calorimetry (DSC) under a nitrogen atmosphere. The obtained data are listed in Table 1 and the corresponding spectra are shown in Fig. 1 The thermal decomposition temperatures (Td, corresponding to 5% weight loss) were 371 °C, 440 °C, 388 °C and 442 °C for 2a–2d, respectively. Furthermore, the endothermic glass transition (Tg) of 2a–2d was determined to be 120 °C, 124 °C, 123 °C and 145 °C, respectively, in the heating DSC scan. The abovementioned thermal values are higher than that of small molecules, such as mCP and CBP,31,32 thus the performances of OLED devices based on 2a–2d would be excellent due to their good thermal stability.
Table 1 The physical properties of the compounds 2a–2d
| Compound |
λmaxabsa (nm) |
λmaxema (nm) |
Egb (eV) |
HOMOc (eV) |
LUMOd (eV) |
ETe |
Tgf |
Tdf |
ΦFg |
| Measured in tetrahydrofuran. Estimated from onset of the absorption spectra (Eg = 1240/λonset). Calculated from cyclic voltammetry. Calculated using the equation EHOMO = ELUMO − Eg. Calculated using the first peak of the phosphorescence spectra measured at 77 K. Measured using TGA and DSC. Measured using Quanta-φ F-3029 integrating sphere. |
| 2a |
304 |
419 |
3.30 |
−5.46 |
−2.16 |
2.66 |
120 |
370 |
0.48 |
| 2b |
300 |
401 |
3.40 |
−5.64 |
−2.06 |
2.65 |
124 |
440 |
0.78 |
| 2c |
302 |
408 |
3.35 |
−5.51 |
−2.16 |
2.63 |
123 |
388 |
0.48 |
| 2d |
301 |
416 |
3.26 |
−5.48 |
−2.22 |
2.54 |
145 |
442 |
0.38 |
 |
| | Fig. 1 Thermal properties of compounds 2a–2d. | |
Photophysical properties
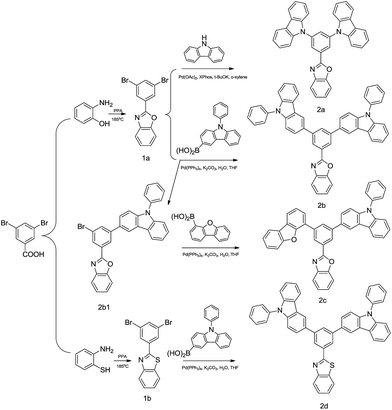
The absorption spectra, photoluminescence spectra (PL) (at room temperature in THF) and phosphorescence spectra (at 77 K in 2-methyl THF) of the four compounds are shown in Fig. 2. The pertinent data for these compounds are summarized in Table 1. As shown in Fig. 2a, the absorption spectra of 2a–2c are similar, whereas the absorption spectrum of 2d is different from that of 2a–2c. The stronger absorption peaks of 2a–2c are located at 282 nm, which are ascribed to carbazole π → π* transitions. The weaker absorption peaks for 2a–2c are located at around 302 nm, which should be derived from the n → π* transitions for the extended conjugation of carbazole and benzo[d]oxazole. For compound 2d, the absorption peaks at 301 nm could be attributed to the n → π* transitions for the conjugation of carbazole and benzo[d]thiazole.33 From the threshold of the absorption spectra of 2a–2d in THF, their optical energy bandgaps (Eg) were calculated to be 3.30 eV, 3.40 eV, 3.35 eV and 3.26 eV, respectively.
 |
| | Fig. 2 Absorption (a), photoluminescence spectra (at room temperature in THF) (b) and phosphorescence spectra (at 77 K in 2-methyl THF) (c) of 2a–2d. | |
The photoluminescence spectra (PL) (at room temperature) are shown in Fig. 2b, with their maxima located at 419 nm, 401 nm, 408 nm and 416 nm for 2a–2d, respectively. In view of the nature of its molecular structure, the maximum of the PL spectrum of 2a was red-shifted compared with the other three compounds due to the large conjugation of this molecule. The maximum of PL the spectrum of 2c was red-shifted 7 nm compared to that of 2b as a result of the weak electron-withdrawing ability of dibenzofuran and enhanced integral conjugation of the molecule.
The red-shifted photoluminescence spectrum of 2d compared to that of 2b could be ascribed to the stronger electron-withdrawing ability of benzo[d]thiazole than that of benzo[d]oxazole.34 As also shown in Fig. 2c, the phosphorescence spectra of these four compounds were obtained at 77 K in 2-methyl THF, their triplet energy (ET) we determined to be 2.66 eV, 2.65 eV, 2.63 eV and 2.54 eV, respectively, which are sufficient for the fabrication of green and red PHOLED devices.35,36
Electrochemical properties
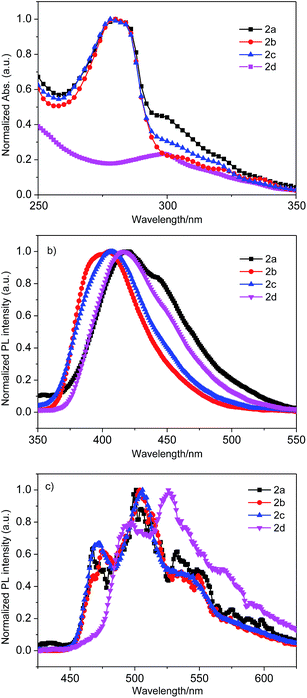
To gain further insight into the electrochemical properties of these four compounds, cyclic voltammetry (CV) was used to determine their highest occupied molecular orbital (HOMO) and lowest unoccupied molecular orbital (LUMO). The cyclic voltammograms of the four compounds are shown in Fig. 3, which were measured in CH2Cl2 (0.1 M TBAPF6 as the supporting electrolyte at a scan rate of 100 mV s−1), with an SCE reference electrode (ferrocene/ferrocenium (Fc/Fc+) redox couple as the external standard), a glassy-carbon working electrode, and a platinum-wire counter electrode. By obtaining the onset oxidation potentials of the four compounds from Fig. 3, the corresponding HOMO values for 2a–2d were determined to be −5.46 eV, −5.46 eV, −5.51 eV and −5.48 eV, respectively. The LUMO values were obtained by the summation of the optical Eg and the HOMO value, which were calculated to be −2.16 eV, −2.06 eV, −2.16 eV and −2.22 eV. These pertinent data are listed in Table 1. It is obvious that the charge carrier injection of the four compounds are guaranteed to be efficient.37
 |
| | Fig. 3 Cyclic voltammograms of 2a–2d in dichloromethane with tetra(n-butyl)ammonium hexafluorophosphate (0.1 M) as the supporting electrolyte for the oxidation scan. | |
Electrophosphorescent PHOLEDs
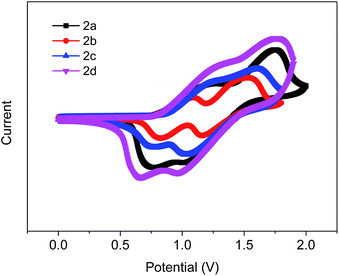
To investigate the charge transport properties of 2a–2d, hole only and electron only devices were fabricated. The corresponding device structures are as follows: hole-only, ITO/MoO3(5 nm)/host(100 nm)/MoO3(5 nm)/Al(80 nm); electron-only, ITO/LiF(10 nm)/host(100 nm)/LiF(1 nm)/Al(80 nm), wherein 2a–2d served as the host in the structures. Fig. 4 shows the relevant current density–voltage curves of these devices. Comparing the current densities of hole only and electron only devices for 2a–2d, the hole current density of 2d was the most similar to its electron current density, wherein the sequence of proximity between the hole current density and the electron current density was: 2d > 2a > 2c > 2b, which indicated bipolar charge transport properties for 2a–2d. Furthermore, from the view of molecule engineering for the design of bipolar hosts, incorporating an electron-withdrawing unit into a molecule with electron-donating property could enhance the bipolar charge transport property of the molecule.38 Therefore, due to the introduction of the 2-phenylbenzo[d]oxazole/2-phenylbenzo[d]thiazole unit, all four hosts exhibited bipolar charge transport properties, thus excellent performances for these four hosts could be anticipated.
 |
| | Fig. 4 Current density versus voltage characteristics of the hole-only and electron-only devices based on 2a–2d. | |
Taking the abovementioned favorable properties of 2a–2d into consideration, green phosphorescent devices based on 2a–2d were fabricated. Their device structures were: ITO/MoO3(5 nm)/NPB(25 nm)/TCTA(8 nm)/host: Ir(ppy)2(acac)(20 nm, 9 wt%)/TPBi(40 nm)/LiF(1 nm)/Al(80 nm). The emitting layer (EML) was composed of 9 wt% Ir(ppy)2(acac) doped into the host materials (2a–2d). MoO3, NPB and TCTA acted as the hole injection layers (HIL), the hole transport layers (HTL), and electron block layer (EBL), respectively. LiF was employed as the electron injection layer (EIL) and TPBi served as the electron transport layer (ETL). The related HOMO and LUMO energy levels of these materials are shown in Fig. 5. According to a previous procedure for green phosphorescent devices, four green devices based on these materials were fabricated successfully.
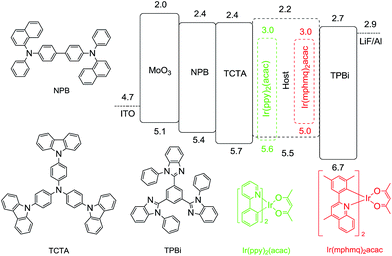 |
| | Fig. 5 Energy-level diagram of the green and red PHOLEDs. | |
Fig. 6a shows the current density–voltage–luminance curves of the green devices based on 2a–2d, and the related data are summarized in Table 2. It was apparent that the turn-on voltages of these four devices were small, which were determined to be 2.7–2.9 V. Furthermore, the maximum current efficiency for the 2a–2d based devices were 50.8, 47.7, 49.2 and 50.7 cd A−1, respectively, and the corresponding maximum power efficiency was 46.3, 42.8, 43.3 and 50.1 lm W−1, respectively. These values were considerably big for small pure organic molecules.6,14,39 The efficiency roll-off for these four host material based devices is also shown in Table 2, for example, even at the practical brightness of 10![[thin space (1/6-em)]](https://www.rsc.org/images/entities/char_2009.gif) 000 cd m−2, the current efficiency and power efficiency of the 2d-based device remained at 47 cd A−1 and 30 lm W−1, respectively. These excellent performances could be ascribed to the good electron-transport characteristics and balanced charge-combination properties of the four molecules, which could significantly increase the recombination from zero to minimize the number of possible quenching pathways and avoiding charge-carrier loss. Most of the reported host molecules are composed of oxazole/thiazole units and metal ligands, thus they are inferior to these four organic molecules due to the fact that they are cheap and easily synthesized. Therefore, the use of phosphorescent devices based on these four host materials is promising.
000 cd m−2, the current efficiency and power efficiency of the 2d-based device remained at 47 cd A−1 and 30 lm W−1, respectively. These excellent performances could be ascribed to the good electron-transport characteristics and balanced charge-combination properties of the four molecules, which could significantly increase the recombination from zero to minimize the number of possible quenching pathways and avoiding charge-carrier loss. Most of the reported host molecules are composed of oxazole/thiazole units and metal ligands, thus they are inferior to these four organic molecules due to the fact that they are cheap and easily synthesized. Therefore, the use of phosphorescent devices based on these four host materials is promising.
 |
| | Fig. 6 (a) Current density–voltage–luminance curves of green PHOLEDs; (b) current efficiency–current density curves and power efficiency–luminance curves of green PHOLEDs; and (c) electroluminescence spectra of green PHOLEDs. | |
Table 2 EL properties of green and red devices using 2a–2d as the host materials
| Device |
At 100 cd m−2 [cd A−1] [lm W−1]−1 |
At 10000 cd m−2 [cd A−1] [lm W−1]−1 |
ηc,max (cd A−1) |
ηp,max (lm W−1) |
CIE(x,y)a |
| Measured from the EL spectra at 5 V by inverting chromaticity coordinates on the CIE 1931 diagram. |
| Green-2a |
50/43 |
43/23 |
50.8 |
46.3 |
(0.34, 0.62) |
| Green-2b |
46/41 |
45/26 |
47.7 |
42.8 |
(0.33, 0.62) |
| Green-2c |
49/41 |
45/25 |
49.2 |
43.3 |
(0.34, 0.62) |
| Green-2d |
50/48 |
47/30 |
50.7 |
50.1 |
(0.34, 0.62) |
| Red-2d |
16.5/9.7 |
11.9/3.8 |
18.7 |
17.3 |
(0.65, 0.35) |
Fig. 6c exhibits the normalized EL spectra of the four devices, in which the EL spectrum of each device was similar, their emission peaks were located at 524 nm and consisted of the triplet emission of Ir(ppy)2(acac) (520 nm) and therefore the green emission peak is indicated to solely originate from the triplet metal ligand charge transfer (3MLCT) transition of Ir(ppy)2(acac).40 The color coordinates of these four green phosphorescent devices were determined to be (0.34, 0.62), (0.33, 0.62), (0.34, 0.62) and (0.34, 0.62).
Considering the best performance of 2d among the four compounds, a red phosphorescent device based on 2d was also fabricated to investigate its electrophosphorescent property. The device structure was: ITO/MoO3(5 nm)/NPB(30 nm)/TCTA(10 nm)/host3: Ir(mphmq)2acac(20 nm, 7.24%)/TPBi(40 nm)/LiF(1 nm)/Al(80 nm). The relevant layers were same as the abovementioned green devices except for the dopants. The current density–voltage–luminance curves, current and power efficiencies curves and normalized EL spectra are shown in Fig. 7. This device had a maximum current efficiency of 18.7 cd A−1 and maximum power efficiency of 17.3 lm W−1. These data are also bigger than that of small organic molecules.15 Furthermore, the normalized EL spectra were obtained at different voltages of 4–10 V, there was hardly an change in the normalized EL spectra, and the color coordinates of the red phosphorescent device were similar and determined to be (0.65, 0.35). Therefore, from the aforementioned performances of the devices based on these hosts, they are proven to be excellent for use in green and red phosphorescent devices.
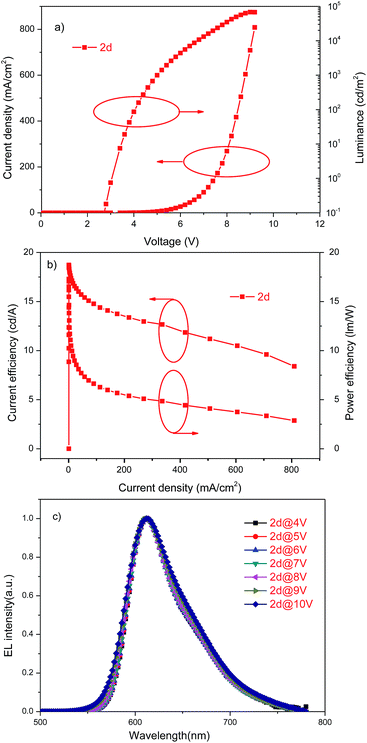 |
| | Fig. 7 (a) Current density–voltage–luminance curves of red PHOLEDs; (b) current efficiency–current density curves and power efficiency–luminance curves of red PHOLEDs; and (c) electroluminescence spectra of red PHOLEDs. | |
Experimental
General information
All solvents and chemicals were purchased from Shanghai Taoe chemical technology Co., Ltd. and used as received without further purification. 1H and 13C NMR spectra were obtained using a Bruker AM 400 spectrometer and mass spectra were obtained on a Waters LCT Premier XE spectrometer. UV/Vis spectra and PL spectra were obtained on a Nicolet CARY 100 spectrophotometer and a Varian Cary fluorescence spectrophotometer, respectively. Cyclic voltammograms were obtained using a Versastat II electrochemical workstation with the conventional three electrode system containing an SCE reference electrode (ferrocene/ferrocenium (Fc/Fc+) redox couple as the external standard), a glassy-carbon working electrode and a platinum-wire counter electrode. Differential scanning calorimetry (DSC) and thermogravimetric analysis (TGA) were performed under a nitrogen atmosphere on a NETZSCH STA 409 PC/PG instrument and TGA instrument, respectively.
2-(3,5-Dibromophenyl)benzo[d]oxazole (1a)
In a one-neck flask, 3,5-dibromobenzoic acid (5.0 g, 18.0 mmol) and 2-aminophenol (2.0 g, 18.0 mmol) were dissolved in 20 mL polyphosphoric acid and then the mixture was heated to 185 °C for 6 h. After the reaction was complete, 20 mL water was poured into the mixture and the crude product was obtained by filtration. Recrystallization from methanol afforded an off-white solid (3.8 g, 61%). 1H NMR (400 MHz, CDCl3) δ: 8.30 (d, J = 2.0 Hz, 2H), 7.79 (d, J = 2.4 Hz, 1H), 7.77–7.75 (m, 1H), 7.59–7.57 (m, 1H), 7.40–7.35 (m, 2H).
2-(3,5-Dibromophenyl)benzo[d]thiazole (1b)
Compound 1b was synthesized using the same procedure described above for compound 1a using 3,5-dibromobenzoic acid and 2-aminobenzenethiol. Yield: 58%. 1H NMR (400 MHz, CDCl3) δ: 8.17 (d, J = 1.6 Hz, 2H), 8.09 (d, J = 8.4 Hz, 1H), 7.93 (d, J = 7.6 Hz, 1H), 7.78 (t, J = 1.6 Hz, 1H), 7.57–7.51 (m, 1H), 7.47–7.41 (m, 1H).
2-(3,5-Di(9H-carbazol-9-yl)phenyl)benzo[d]oxazole (2a)
In a 50 mL one-neck flask, 1a (0.5 g, 1.4 mmol), 9H-carbazole (0.5 g, 3.0 mmol), t-BuOK (0.3 g, 2.8 mmol), Pd(OAc)2 (30 mg) and XPhos (90 mg) were added to 30 mL o-xylene and the mixture was refluxed under nitrogen for 8 h. When the reaction was finished, the mixture was cooled to the room temperature and 30 mL H2O was poured into the mixture. CH2Cl2 (20 mL × 3) was used to extract the mixture, which was dried over anhydrous MgSO4 and concentrated using a rotary evaporator. The pure material was obtained via silica gel column chromatography (petroleum ether/CH2Cl2 = 5:1 v/v) as a white solid (0.4 g, 66%). 1H NMR (400 MHz, CDCl3) δ: 8.54 (d, J = 2.0 Hz, 4H), 8.11 (d, J = 7.6 Hz, 1H), 7.93 (t, J = 2.0 Hz, 1H), 7.76–7.72 (m, 1H), 7.57–7.52 (m, 5H), 7.45–7.38 (m, 4H), 7.36–7.31 (m, 2H), 7.31–7.25 (m, 4H). 13C NMR (126 MHz, CDCl3) δ: 150.88, 141.99, 140.44, 140.27, 130.83, 127.72, 126.39, 125.90, 125.02, 124.52, 123.83, 120.70, 120.58, 120.49, 110.87, 109.68. HRMS (m/z): [M + H]− calcd for C37H24N3O, 526.1919; found, 526.1918. Anal. calcd for C37H23N3O: C, 84.55; H, 4.41; N, 7.99. Found: C, 84.47; H, 4.51; N, 7.83%.
2-(3,5-Bis(9-phenyl-9H-carbazol-3-yl)phenyl)benzo[d]oxazole (2b)
In a one-neck flask, 1a (0.5 g, 1.4 mmol), (9-phenyl-9H-carbazol-3-yl)boronic acid (0.9 g, 3.1 mmol), K2CO3 (0.4 g, 2.8 mmol), H2O (2 mL) and Pd(PPh3)4 (20 mg) were dissolved in 25 mL THF. Then, the mixture was refluxed under nitrogen for 6 h. After the reaction was completed, 20 mL H2O was poured into the mixture and extracted with CH2Cl2 (15 mL × 3). The combined organic layer was dried over anhydrous MgSO4 and concentrated using a rotary evaporator. The crude material was purified via silica gel column chromatography (petroleum ether/CH2Cl2 = 5:1 v/v) to obtain a white solid (0.7 g, 71%). 1H NMR (400 MHz, CDCl3) δ: 8.61 (d, J = 1.6 Hz, 2H), 8.57 (d, J = 1.6 Hz, 2H), 8.27 (d, J = 8.0 Hz, 2H), 8.23 (s, 1H), 7.89–7.84 (m, 3H), 7.70–7.61 (m, 9H), 7.57–7.49 (m, 4H), 7.46 (d, J = 4.0 Hz, 4H), 7.42–7.39 (m, 2H), 7.38–7.32 (m, 2H). 13C NMR (126 MHz, CDCl3) δ: 150.88, 143.43, 141.60, 140.73, 137.60, 136.79, 134.52, 132.49, 131.69, 129.99, 129.15, 127.64, 127.13, 126.29, 125.62, 124.77, 124.60, 124.02, 123.61, 123.45, 121.70, 120.58, 120.27, 119.20, 110.20, 110.01. HRMS (m/z): [M + H]− calcd for C49H32N3O, 678.2545; found, 678.2556. Anal. calcd for C49H31N3O: C, 86.83; H, 4.61; N, 6.20. Found: C, 86.64; H, 4.65; N, 5.97%.
2-(3-Bromo-5-(9-phenyl-9H-carbazol-3-yl)phenyl)benzo[d]oxazole (2b1)
Compound 2b1 was synthesized using the same procedure as described above for compound 2a using 1a and (9-phenyl-9H-carbazol-3-yl)boronic acid. Yield: 81%. 1H (400 MHz, CDCl3) 8.56 (t, J = 1.6 Hz, 1H), 8.44 (d, J = 1.6 Hz, 1H), 8.38 (t, J = 1.6 Hz, 1H), 8.25 (d, J = 7.6 Hz, 1H), 8.02 (t, J = 1.6 Hz, 1H), 7.86–7.80 (m, 1H), 7.72 (m, 1H), 7.68–7.59 (m, 5H), 7.54–7.47 (m, 2H), 7.47–7.44 (m, 2H), 7.42–7.39 (m, 2H), 7.35 (m, 1H).
2-(3-(Dibenzo[b,d]furan-4-yl)-5-(9-phenyl-9H-carbazol-3-yl)phenyl)benzo[d]oxazole (2c)
Compound 2c was synthesized using the same procedure as described above for compound 2a using 2b1 and dibenzo[b,d]furan-4-ylboronic acid. Yield: 81%. 1H (400 MHz, CDCl3) δ: 8.64 (m, 2H), 8.51 (d, J = 1.6 Hz, 1H), 8.39 (t, J = 1.6 Hz, 1H), 8.18 (d, J = 7.6 Hz, 1H), 7.98–7.93 (m, 2H), 7.82–7.76 (m, 2H), 7.74 (m, 1H), 7.61–7.53 (m, 6H), 7.49–7.41 (m, 4H), 7.38 (d, J = 3.6 Hz, 2H), 7.33 (m, 3H), 7.27 (m, 1H). 13C NMR (126 MHz, CDCl3) δ: 156.26, 143.26, 142.20, 137.93, 131.03, 130.00, 128.12, 127.65, 127.38, 127.13, 126.89, 126.30, 125.98, 125.65, 125.27, 125.13, 124.70, 124.17, 123.43, 123.37, 122.93, 120.77, 120.26, 120.13, 119.25, 112.08, 110.75, 110.23, 101.52. HRMS (m/z): [M + H]− calcd for C43H27N2O2, 603.2073; found, 603.2061. Anal. calcd for C43H26N2O2: C, 85.69; H, 4.35; N, 4.65. Found: C, 85.40; H, 4.40; N, 4.58%.
2-(3,5-Bis(9-phenyl-9H-carbazol-3-yl)phenyl)benzo[d]thiazole (2d)
Compound 2d was synthesized using the same procedure as described above for compound 2a using 1b and (9-phenyl-9H-carbazol-3-yl)boronic acid. Yield: 80%. 1H NMR (400 MHz, CDCl3) δ: 8.55 (d, J = 1.6 Hz, 2H), 8.42 (d, J = 1.6 Hz, 2H), 8.27 (d, J = 8.0 Hz, 2H), 8.18 (s, 1H), 7.97 (d, J = 8.0 Hz, 1H), 7.85 (m, 2H), 7.75–7.62 (m, 9H), 7.57–7.49 (m, 6H), 7.46 (d, J = 4.0 Hz, 4H), 7.37–7.32 (m, 2H). 13C NMR (126 MHz, CDCl3) δ: 154.26, 143.53, 141.46, 140.71, 137.62, 135.21, 134.64, 132.65, 129.99, 129.13, 127.63, 127.13, 126.39, 126.28, 125.67, 125.27, 124.70, 124.02, 123.46, 123.32, 121.70, 120.58, 120.23, 119.20, 110.19, 110.00. HRMS (m/z): [M + H]− calcd for C49H32N3S, 694.2317; found, 694.2311. Anal. calcd for C49H31N3S: C, 84.82; H, 4.50; N, 6.06. Found: C, 84.59; H, 4.38; N, 5.92%.
Conclusions
Four pure organic molecules based on oxazole and thiazole derivatives and carbazole derivatives have been successfully synthesized and characterized. The thermal, photophysical and electrochemical properties of these four compounds were fully investigated. They exhibited good thermal stability with endothermic glass transitions over 120 °C. Furthermore, the performances of compound 2d, which was based on thiazole derivatives, were better than that of the compounds (2a, 2b, and 2c) based on oxazole derivatives. Both green and red phosphorescent devices were fabricated for 2d, and for the green phosphorescent device, its maximum current efficiency was 50.7 cd A−1 and maximum power efficiency was 50.1 lm W−1; for the red phosphorescent device, its maximum current efficiency was 18.7 cd A−1 and maximum power efficiency was 17.3 lm W−1. These values are considerably higher than that for other small pure organic molecule-based green and red electrophosphorescent devices. Given the obtained excellent performances of the oxazole and thiazole derivatives, other series of thiazole derivatives for application in PHOLED are currently under further investigation.
Notes and references
- M. A. Baldo, D. F. O'Brien, Y. You, A. Shoustikov, S. Sibley, M. E. Thompson and S. R. Forrest, Nature, 1998, 395, 151–154 CrossRef CAS.
- Y. Tao, C. Yang and J. Qin, Chem. Soc. Rev., 2011, 40, 2943–2970 RSC.
- H. H. Chou and C. H. Cheng, Adv. Mater., 2010, 22, 2468–2471 CrossRef CAS PubMed.
- A. Chaskar, H. F. Chen and K. T. Wong, Adv. Mater., 2011, 23, 3876–3895 CrossRef CAS PubMed.
- J. H. Lee, S. H. Cheng, S. J. Yoo, H. Shin, J. H. Chang and C. I. Wu, et al., Adv. Funct. Mater., 2015, 25, 361–366 CrossRef CAS.
- X. X. Ban, W. Jiang, K. Y. Sun, X. Y. Xie, L. Peng, H. S. Dong, Y. M. Sun, B. Huang, L. Duan and Y. Qiu, ACS Appl. Mater. Interfaces, 2015, 7, 7303–7314 CAS.
- Y. J. Cho, K. S. Yook and J. Y. Lee, Adv. Mater., 2014, 26, 4050–4055 CrossRef CAS PubMed.
- S. J. Su, Y. Takahashi, T. Chiba, T. Takeda and J. Kido, Adv. Funct. Mater., 2009, 19, 1260–1267 CrossRef CAS.
- K. Udagawa, H. Sasabe, C. Cai and J. Kido, Adv. Mater., 2014, 26, 5062–5066 CrossRef CAS PubMed.
- H. Fukagawa, T. Shimizu, H. Hanashima, Y. Osada, M. Suzuki and H. Fujikake, Adv. Mater., 2012, 24, 5099–5103 CrossRef CAS PubMed.
- G. Li, T. Fleetham, E. Turner, X. C. Hang and J. Li, Adv. Opt. Mater., 2015, 3, 390–397 CrossRef CAS.
- K. Wang, S. P. Wang, J. B. Wei, S. Y. Chen, D. Liu, Y. Liu and Y. Wang, J. Mater. Chem. C, 2014, 2, 6817–6826 RSC.
- S. C. Dong, Y. Liu, Q. Li, L. S. Cui, H. Chen, Z. Q. Jiang and L. S. Liao, J. Mater. Chem. C, 2013, 1, 6575–6584 RSC.
- G. J. Tian, W. Q. Liang, Y. Chen, N. Xiang, Q. C. Dong, J. H. Huang and J. H. Su, Dyes Pigm., 2016, 126, 296–302 CrossRef CAS.
- Y. Chen, J. W. Xie, Z. X. Wang, J. Cao, H. W. Chen, J. H. Huang, J. H. Zhang and J. H. Su, Dyes Pigm., 2016, 124, 188–195 CrossRef CAS.
- X. L. Yang, X. B. Xu and G. J. Zhou, J. Mater. Chem. C, 2015, 3, 913–944 RSC.
- J. H. Huang, J. H. Su, X. Li, M.-K. Lam, K.-M. Fung, H. H. Fan, K.-W. Cheah, C. H. Chen and H. Tian, J. Mater. Chem., 2011, 21, 2957–2964 RSC.
- J. H. Huang, J. H. Su and H. Tian, J. Mater. Chem., 2012, 22, 10977–10989 RSC.
- S. H. Ye, Y. Q. Liu, C. A. Di, H. X. Xi, W. P. Wu, Y. G. Wen, K. Lu, C. Y. Du, Y. Liu and G. Yu, Chem. Mater., 2009, 21, 1333–1342 CrossRef CAS.
- Z. Zhang, Z. S. Zhang, D. X. Ding, Y. Wei, H. Xu, J. L. Jia, Y. Zhao, K. Pan and W. Huang, J. Phys. Chem. C, 2014, 118, 20559–20570 CAS.
- M. J. Zhuo, W. Sun, G. W. Liu, J. Wang, L. Y. Guo, C. Liu, B. X. Mi, J. Song and Z. Q. Gao, J. Mater. Chem. C, 2015, 3, 9137–9144 RSC.
- L. S. Cui, Y. M. Xie, Y. K. Wang, C. Zhong, Y. L. Deng, X. Y. Liu, Z. Q. Jiang and L. S. Liao, Adv. Mater., 2015, 27, 4213–4217 CrossRef CAS PubMed.
- D. Liu, H. C. Ren, L. J. Deng and T. Zhang, ACS Appl. Mater. Interfaces, 2013, 5, 4937–4944 CAS.
- A. K.-W. Chan, E. S.-H. Lam, A. Y.-Y. Tam, D. P.-K. Tsang, W. H. Lam, M.-Y. Chan, W.-T. Wong and V. W.-W. Yam, Chem.–Eur. J., 2013, 19, 13910–13924 CrossRef CAS PubMed.
- S. L. Tao, S. L. Lai, J. S. Yu, Y. D. Jiang, Y. C. Zhou, C.-S. Lee, X. H. Zhang and S.-T. Lee, J. Phys. Chem. C, 2009, 113, 16792–16795 CAS.
- W. Jiang, J. N. Tang, X. X. Ban, Y. M. Sun, L. Duan and Y. Qiu, Org. Lett., 2014, 16, 5346–5349 CrossRef CAS PubMed.
- X. X. Ban, W. Jiang, K. Y. Sun, H. Y. Yang, Y. N. Miao, F. H. Yang, Y. M. Sun, B. Huang and L. Duan, J. Mater. Chem. C, 2015, 3, 5004–5016 RSC.
- E. Mondal, W. Y. Hung, Y. H. Chen, M. H. Cheng and K. T. Wong, Chemistry, 2013, 19, 10563–10572 CrossRef CAS PubMed.
- S. L. Lin, L. H. Chan, R. H. Lee, M. Y. Yen, W. J. Kuo, C. T. Chen and R. J. Jeng, Adv. Mater., 2008, 20, 3947–3952 CrossRef CAS.
- R. S. Shetty, Y. Lee and B. Liu, et al., J. Med. Chem., 2011, 54, 179–200 CrossRef CAS PubMed.
- P. I. Shih, C. L. Chiang, A. K. Dixit, C. K. Chen, M. C. Yuan, R. Y. Lee, C.-T. Chen, E. W.-G. Diau and C.-F. Shu, Org. Lett., 2006, 13, 2799–2802 CrossRef PubMed.
- T. Zhang, Y. Liang, J. Cheng and J. Li, J. Mater. Chem. C, 2013, 1, 757–764 RSC.
- J. Y. Li, R. J. Wang, R. X. Yang, W. Zhou and X. Wang, J. Mater. Chem. C, 2013, 1, 4171–4179 RSC.
- C.-H. Chang, J.-L. Huang and S.-W. Wu, J. Mater. Chem. C, 2015, 3, 12048–12055 RSC.
- T. Fleetham, G. J. Li and J. Li, ACS Appl. Mater. Interfaces, 2015, 7, 16240–16246 CAS.
- C.-H. Shih, P. Rajamalli, C.-A. Wu, W.-T. Hsieh and C.-H. Cheng, ACS Appl. Mater. Interfaces, 2015, 7, 10466–10474 CAS.
- S. O. Jeon and J. Y. Lee, J. Mater. Chem., 2012, 22, 10537–10541 RSC.
- D. H. Kim, N. S. Cho, H. Y. Oh, J. H. Yang, W. S. Jeon and J. S. Park, et al., Adv. Mater., 2011, 23, 2721–2726 CrossRef CAS PubMed.
- H. P. Shi, Z. H. Gong, J. Roose, H. R. Peng, S. M. Chen, J. W. Y. Lam and B. Z. Tang, J. Mater. Chem. C, 2015, 3, 9095–9102 RSC.
- C. W. Lee and J. Y. Lee, Chem. Commun., 2013, 49, 1446–1448 RSC.
Footnotes |
| † Electronic supplementary information (ESI) available: The normalized emission spectra of 2a–2d in different solvents at the concentration of 1.0 × 10⁻⁵; the spectra (1H NMR, 13C NMR, HRMS) for compounds 2a–2d. See DOI: 10.1039/c6ra07976h |
| ‡ These two authors contribute equally to this work. |
|
| This journal is © The Royal Society of Chemistry 2016 |
Click here to see how this site uses Cookies. View our privacy policy here. 


