DOI:
10.1039/C6RA06370E
(Paper)
RSC Adv., 2016,
6, 51569-51574
Facile synthesis of gold–platinum dendritic nanostructures with enhanced electrocatalytic performance for the methanol oxidation reaction†
Received
10th March 2016
, Accepted 8th May 2016
First published on 10th May 2016
1. Introduction
Platinum (Pt) and its alloyed nanoparticles have received increasing interest because of their exceptional performance in catalysis,1 sensors,2 optics3 and biomedicine,4 especially as a highly efficient catalyst for fuel cells.5–10 However, because of the low reserves and high costs of Pt, and how easily it is poisoned by CO, it is difficult to realize its practical applications in direct methanol fuel cells (DMFCs). To overcome these drawbacks, a great many efforts have been devoted to the reduction of Pt usage and the promotion of catalyst efficiency. Among these methods, the introduction of other metals (e.g., Pd, Ag, Au, Fe, Co, Ni and Cu) into Pt to form Pt-based alloys or composites is very popular. For example, Wang and Yamauchi synthesized bimetallic Pt–Pd hollow nanoparticles with dendritic shells by selective chemical etching.11 Tian et al. reported star-like PtCu nanoparticles supported on graphene with superior activity for methanol electro-oxidation.12 Adzic and co-workers synthesized Ru- and NbO2-supported Pt electrocatalysts with high Pt mass activity and improved durability for the methanol oxidation reaction (MOR).13 Papadimitriou et al. prepared Pt–Cu, Pt–Ni and Pt–Co binary catalysts with enhanced electrocatalytic activity for the MOR.14 The improved catalytic activities of these Pt-based alloy nanoparticles for the MOR can be due to a combination of electronic effects.15,16
Recently, dendritic Pt and Pt-based catalysts have attracted considerable attention due to their high catalytic performance. The dendritic structure can provide large specific surface areas and a large number of catalytic hot spots, favorable for their catalytic performance.17 For example, Geng et al. prepared dendritic Pt nanostructures with a higher catalytic performance than the commercial Pt catalyst and Pt nanoparticles.18 Han et al. synthesized bimetallic Cu–Pt alloy nanoparticles with dendritic, polyhedral and stellated morphologies, among which the dendritic nanoparticles display superior electrocatalytic activity for the MOR.19 These results proved that the dendritic nanostructures can increase catalytic performance. However, in order to control the morphologies and prevent particle agglomeration, surfactants such as oleylamine, poly(vinylpyrrolidone) (PVP) and cetyltrimethylammonium bromide (CTAB) are usually needed during the preparation of the dendritic nanoparticles.20–23 The surfactants will strongly adsorb on the surface of the products, and are very difficult to be thoroughly removed by washing. The electrocatalytic performance of the catalysts may decrease due to the adsorption of surfactants. Therefore, it is desirable to develop surfactant-free methods for the preparation of catalysts with clean-surfaces.
In this work, bimetallic Au–Pt dendritic nanoparticles with different Au/Pt ratios are successfully synthesized via a facile surfactant-free wet-chemical route. The formation mechanism of the dendritic nanoparticles is studied. Among the Au–Pt dendritic nanoparticles, the AuPt-2 sample displays the highest catalytic activity towards the MOR. As a comparison, a AuPt-2 sample capped with PVP is also prepared, and shows decreased catalytic activity. This result indicates that the surfactant-free method can provide products with clean surfaces which are more favorable for catalytic reactions. Furthermore, the AuPt-2 sample shows a notable electrocatalytic performance compared with pure Pt and commercial Pt black catalysts for the MOR, indicating its potential application as an efficient catalyst for use in direct methanol fuel cells.
2. Experimental
2.1. Synthesis methods
In a typical procedure, 2 mL of 0.1 mol L−1 C6H5Na3O7·2H2O (aq.) and 100 μL of 0.01 mol L−1 HAuCl4 (aq.) were sequentially added to 20 mL of distilled water under continuous stirring, then the solution was heated in a water bath at 65 °C. After being heated for 20 minutes, 140 μL of 0.019 mol L−1 H2PtCl6 and 600 μL of hydrazine hydrate (85%, w/w%) were added. After another 20 minutes, the product, namely AuPt-2, was separated by centrifugation, and then washed with distilled water and absolute ethanol three times each.
For comparison, AuPt-1, AuPt-3 and pure Pt samples were prepared in the same manner by simply adjusting the ratio between HAuCl4 and H2PtCl6 while keeping the total amount of HAuCl4 and H2PtCl4 constant. The ratios between HAuCl4 and H2PtCl6 for the preparation of AuPt-1 and AuPt-3 samples are 1
:
1.33 and 1
:
3.99, respectively.
PVP capped AuPt-2 dendritic nanoparticles were prepared by dispersing the as-prepared AuPt-2 dendritic nanoparticles in a PVP solution (0.01 g mL−1) for 12 h, and then washed with distilled water and absolute ethanol three times each.
2.2. Characterization
The morphologies and microstructures of the samples were characterized using transmission electron microscopy (TEM) and high-resolution TEM (HRTEM) on a FEI Tecnai G2 20 high-resolution transmission electron microscope. The crystallographic structure of the samples was determined by X-ray powder diffraction (XRD) on a Bruker D8 Advance X-ray diffractometer with Cu Kα radiation. The chemical compositions of the samples were analyzed with X-ray photoelectron spectroscopy (XPS) which was performed on an ESCALab MKII X-ray photoelectron spectrometer with Al Kα radiation. Elemental mappings were obtained on a JEOL JEM-2100F transmission electron microscope equipped with an EDX spectrometer. The Au/Pt ratio of the samples was analyzed with an inductive coupled plasma atomic emission spectrometer (ICP-AES; OPTIMA 5300DV). UV-visible absorption spectra were measured with a Shimadzu UV-3010 spectrometer. Electrochemical characterization was carried out on a CHI-660D electrochemical working station (ChenHua Corp., Shanghai, China).
2.3. Electrochemical measurements
All electrochemical measurements were performed at room temperature (20–25 °C). The working electrode was prepared according to the following procedure. Firstly, the electrode material was homogeneously dispersed into 500 μL of distilled water by ultrasonication. Then, 8 μL of the suspension was dropped onto a glassy carbon electrode (GCE, 3 mm in diameter) and dried in air. The calculated mass loading of Pt on the GCE is about 8 μg for both the prepared catalysts and commercial Pt/C catalyst. Finally, 5 μL of 0.05% Nafion (aq.) was pipetted onto the catalyst film, and dried in air. A saturated calomel electrode (SCE) was used as the reference electrode and a platinum plate was used as the counter electrode. The acidic blank scans were carried out in 0.5 mol L−1 H2SO4 solution that had been purged with nitrogen.
Methanol oxidation reactions (MORs) in acid were carried out in a N2-saturated aqueous solution containing 0.5 mol L−1 methanol and 0.5 mol L−1 H2SO4. All the measurements were performed with a scan rate of 50 mV s−1. Chronoamperometric curves for the MOR were recorded at a potential of 0.70 V for 3600 s.
3. Results and discussion
3.1. Material characterization
The composition of the AuPt-2 sample was determined by XRD, as shown in Fig. 1a. There are three well-defined diffraction peaks located at 39.3°, 45.9° and 66.6° corresponding to the (111), (200) and (220) planes for a face-centered-cubic (fcc) structure. Compared with the standard diffraction patterns for fcc Au (JCPDS card no. 4-784) and fcc Pt (JCPDS card no. 4-802), all of the diffraction peaks are located between those of pure Au and Pt, indicating the formation of alloys.24,25 The diffraction peaks are more close to the standard peaks of Pt, which can be attributed to a higher Pt content in the Au–Pt sample.
 |
| Fig. 1 (a) XRD pattern of the AuPt-2 sample; (b–d) XPS spectra of (b) survey, (c) Pt 4f and (d) Au 4f for the AuPt-2 sample. | |
The chemical bonding states of each element on the surface of the AuPt-2 sample are evaluated by the XPS technique. Fig. 1b shows the survey XPS spectrum, indicating the presence of Pt, Au, O and C in the sample. The C (as a reference) and O elements are due to exposure to air. The Pt 4f core level spectrum for the AuPt-2 sample is presented in Fig. 1c, which is fitted by a Gaussian fitting method. The peaks at 71.2 and 72.0 eV for Pt 4f7/2, and the peaks at 74.6 and 75.4 eV for Pt 4f5/2 indicate the coexistence of Pt0 and Pt2+ species in the AuPt-2 sample.26 The high intensity ratio of Pt0/Pt2+ indicates that the Pt0 species is dominant. Fig. 1d shows the core level spectrum of Au 4f for the AuPt-2 sample, the two peaks at 84.1 and 87.8 eV correspond to Au 4f7/2 and Au 4f5/2 of the Au0 species, respectively. Compared to the standard data of the Pt0 (70.9 and 74.2 eV) and Au0 (84.0 and 87.7 eV) species,27 the binding energies of both Pt 4f and Au 4f are slightly shifted to higher values. The increase in the binding energies suggests that electron transfer can occur between Au and Pt in the bimetallic Au–Pt sample.
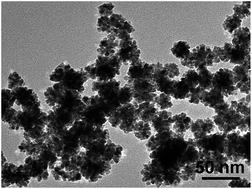
Fig. 2a shows a TEM image of the AuPt-2 sample, which indicates that the sample is composed of many dendritic nanoparticles with diameters of about 25 nm. An enlarged image shown as an inset in Fig. 2a indicates that the dendritic nanoparticles are composed of many small particles with diameters of only about 5 nm. A HRTEM image of a AuPt-2 dendritic nanoparticle is shown in Fig. 2b. The inter-fringe distance is 0.230 nm, which is between the d values of the Au (111) lattice planes (0.235 nm) and Pt (111) lattice planes (0.226 nm). This result indicates the formation of a Au–Pt alloy, consistent with the XRD results. Fig. 2c–e reveal elemental mappings of the Au–Pt dendritic nanoparticles. Both Au and Pt elements are uniformly and continuously distributed in the dendritic nanoparticles. The morphologies of the Au–Pt dendritic nanoparticles with different Au/Pt ratios were also characterized by TEM, as shown in Fig. S1.† It can be seen that the AuPt-1 and AuPt-3 samples have a similar morphology and size to the AuPt-2 sample.
 |
| Fig. 2 (a) TEM image of AuPt2.66 dendritic nanoparticles; (b) HRTEM image of a AuPt-2 dendritic nanoparticle; (c) STEM image of AuPt-2 dendritic nanoparticles; (d and e) STEM-EDX element mappings of Pt and Au. | |
The exact Au/Pt ratios of the Au–Pt dendritic nanoparticles are evaluated by ICP-AES, and the results show that the Au/Pt ratios of the AuPt-1, AuPt-2 and AuPt-3 samples are 1
:
1.29, 1
:
2.86 and 1
:
4.36, respectively. Compared to the Au/Pt ratios in the starting materials of 1
:
1.33, 1
:
2.66 and 1
:
3.99, the Au/Pt ratios in the final samples are slightly changed. The reason may be ascribed to the different mass loss of Au and Pt during the preparation of the samples.
3.2. Formation mechanism
In order to explore the formation mechanism of the Au–Pt dendritic nanoparticles, a series of control experiments were carried out. In this work, both sodium citrate and hydrazine hydrate serve as the reducing agent for the synthesis of the Au–Pt dendritic nanoparticles. Sodium citrate is a mild reductant while hydrazine hydrate is a strong reductant. It had been reported that gold nanoparticles can be obtained by using sodium citrate as a reductant in boiling aqueous solution.28 However, in this work, the reacting temperature was only 65 °C. When only sodium citrate was added, the solution just turned light pink, and no product could be obtained through centrifugation. The pink solution was characterized by UV-visible spectroscopy, and the results are shown in Fig. S2.† The wide absorption peak at about 519 nm can be attributed to the local surface plasmon resonance of gold.29 We believe that sodium citrate cannot efficiently reduce AuCl4− under the present experimental conditions, and only some gold atom clusters can be obtained. These gold atom clusters may serve as seeds for further nanocrystal growth. When only hydrazine hydrate was added, some feather-like nanocrystals with larger sizes were obtained (Fig. S3†). Furthermore, when AuCl4− was absent in the starting materials while the other conditions were kept constant, some Pt nanoparticle aggregates were obtained (Fig. S4†). On the basis of the above results, we proposed a possible formation mechanism of the Au–Pt dendritic nanoparticles, as shown in Fig. 3. In the first step, gold atom clusters were formed due to the reducing effect of sodium citrate; and then, in the second step, with the introduction of hydrazine hydrate, the AuCl4− and PtCl62− ions can be simultaneously reduced. It had been reported that Pt tends to form small nanoparticles due to its high surface area and cohesive forces.30,31 Herein, with the aid of gold atom cluster seeds, bimetallic Au–Pt dendritic nanoparticles were finally obtained.
 |
| Fig. 3 The formation mechanism of the Au–Pt dendritic nanoparticles. | |
3.3. Electrooxidation of methanol
The electrochemical properties of the samples are estimated using cyclic voltammetry (CV). Fig. 4a shows representative CV curves of the Au–Pt dendritic nanoparticles recorded in 0.5 mol L−1 N2-saturated H2SO4 solution. The electrochemical active surface area (ECSA) was calculated from hydrogen adsorption/desorption cyclic voltammograms between −0.2 and 0.1 V versus SCE. The specific ECSAs of the AuPt-1, AuPt-2 and AuPt-3 samples are 17.57, 47.14 and 29.07 m2 g−1, respectively (Table 1). The AuPt-2 sample has the largest ECSA.
 |
| Fig. 4 (a) CV curves of different Au/Pt ratio catalysts in 0.5 mol L−1 N2-saturated H2SO4; (b) CV curves of the catalysts in 0.5 mol L−1 H2SO4 and 0.5 mol L−1 methanol solution. | |
Table 1 Summary of results for the methanol oxidation reaction catalyzed by different catalysts
Catalyst |
Pt loading [μg] |
ECSA [m2 g−1] |
Mass activity [mA mg−1_Pt] |
Specific activity [mA cm−2_Pt] |
Pure Pt |
8 |
15.93 |
85.8 |
0.53 |
AuPt-1 |
8 |
17.57 |
130.0 |
0.74 |
AuPt-2 |
8 |
47.14 |
298.1 |
0.64 |
AuPt-3 |
8 |
29.07 |
183.4 |
0.63 |
PVP–AuPt-2 |
8 |
15.55 |
65.3 |
0.42 |
Commercial Pt/C |
8 |
36.49 |
175.9 |
0.48 |
The electrocatalytic activity of the Au–Pt catalysts towards the MOR was investigated by CV in 0.5 mol L−1 H2SO4 solution which contained 0.5 mol L−1 methanol. Fig. 4b shows typical CV curves of methanol oxidation with the different Au–Pt catalysts. The anodic peaks at about 0.70 V in the forward sweep can be attributed to the characteristic methanol oxidation on the electrode surface, carbonaceous intermediates such as CO and HCO− are formed at this stage, and these intermediates will be further oxidized at higher potentials due to the formation of Pt–OH and Pt–O species.32–34 The specific activities of the catalysts are listed in Table 1, it can be seen that with the increase of Pt content in the bimetallic Au–Pt catalysts, the specific activity initially increases and then decreases. The AuPt-2 sample shows the best activity.
The Au–Pt dendritic nanoparticles which are synthesized via a surfactant-free method have clean surfaces that are favorable for catalytic reactions. For comparison, PVP capped AuPt-2 dendritic nanoparticles were also prepared. Electrochemical properties of the AuPt-2 dendritic nanoparticles before and after PVP capping are compared, as shown in Fig. 5a and b and Table 1. The ECSA after PVP capping is 15.55 m2 g−1, which is significantly decreased. Furthermore, both the mass and specific activities of the AuPt-2 dendritic nanoparticles are significantly decreased after PVP capping. The catalytic performance of commercial Pt/C (20%) and Pt nanoparticles is also compared, as shown in Fig. 5a and b and Table 1. The AuPt-2 dendritic nanoparticles show much better specific activity.
 |
| Fig. 5 (a) CV curves of AuPt-2, PVP capped AuPt-2, pure Pt and commercial Pt/C in 0.5 mol L−1 N2-saturated H2SO4; (b) CV curves of the catalysts in 0.5 mol L−1 H2SO4 and 0.5 mol L−1 methanol solution. | |
The long-term catalytic performance of the catalysts is also compared. Chronoamperometric experiments were carried out at a potential of 0.7 V for a period of 3600 s at room temperature, and the resultant i–t curves are shown in Fig. 6. After a continuous catalysis process for 3600 s, the oxidation current densities of the AuPt-1, AuPt-2, AuPt-3, pure Pt and Pt/C catalysts are 20.0, 112.5, 16.7, 5.0 and 5.0 mA mg−1, respectively. The methanol oxidation current density of the AuPt-2 catalyst is the highest among the different catalysts over the entire time span that was examined.
 |
| Fig. 6 Chronoamperograms of different catalysts for the MOR at 0.70 V. | |
The improved electrocatalytic activity of Au–Pt dendritic nanoparticles can be ascribed to the following factors. Firstly, in the bimetallic Au–Pt nanoparticles, the electron transfer between Au and Pt can alter the surface electronic structure of Pt and modify its d-band center position, which can promote the adsorption of methanol on the active sites of Pt, and lead to higher catalytic activity than a Pt-only catalyst.30,35 Secondly, the unique structures of the dendritic nanoparticles provide more active sites accessible for the MOR.36 Finally, the Au–Pt dendritic nanoparticles that are prepared through a surfactant-free method have clean-surfaces which are more efficient for catalytic reactions.
4. Conclusions
In summary, a facile one-pot surfactant-free strategy was developed for the synthesis of Au–Pt dendritic nanoparticles. The as-prepared Au–Pt sample with an Au/Pt ratio of 2.86 shows the best electrochemical catalytic performance for the MOR among the Au–Pt samples. Furthermore, the electrochemical catalytic performance of the AuPt-2 dendritic nanoparticles is also much better than that of the PVP capped AuPt-2 sample, commercial Pt/C catalyst and Pt-only nanoparticles. The excellent electrocatalytic activity of the Au–Pt dendritic nanoparticles can be attributed to their clean surfaces, the change of surface electronic structure caused by interactions between Au and Pt, as well as the unique dendritic structure which provides more active sites for the MOR. This method provides an efficient surfactant-free way for the preparation of bimetallic dendritic nanocrystals which can be applied as efficient catalysts for direct methanol fuel cells.
Acknowledgements
Financial support from the National Natural Science Foundation of China (No. 21171006) is gratefully acknowledged.
Notes and references
- F. Wang, C. H. Li, L. D. Sun, H. S. Wu, T. Ming, J. F. Wang, J. C. Yu and C. H. Yan, J. Am. Chem. Soc., 2011, 133, 1106 CrossRef CAS PubMed.
- J. N. Anker, W. P. Hall, O. Lyandres, N. C. Shah, J. Zhao and R. P. Van Duyne, Nat. Mater., 2008, 7, 442 CrossRef CAS PubMed.
- H. B. Zeng, G. T. Duan, Y. Li, S. K. Yang, X. X. Xu and W. P. Cai, Adv. Funct. Mater., 2010, 20, 561 CrossRef CAS.
- C. H. Fang, L. Shao, Y. H. Zhao, J. F. Wang and H. K. Wu, Adv. Mater., 2012, 24, 94 CrossRef CAS PubMed.
- C. C. Lu, W. Kong, H. Y. Zhang, B. Song and Z. H. Wang, J. Power Sources, 2015, 296, 102 CrossRef CAS.
- L. Wang and Y. Yamauchi, J. Am. Chem. Soc., 2010, 132, 13636 CrossRef CAS PubMed.
- H. J. Qiu and F. X. Zou, ACS Appl. Mater. Interfaces, 2012, 4, 1404 CAS.
- C. Xu, Y. Liu, F. Su, A. Liu and H. Qiu, Biosens. Bioelectron., 2011, 27, 160 CrossRef CAS PubMed.
- J. Zhang, H. Yang, B. Martens, Z. Luo, D. Xu, Y. Wang, S. Zou and J. Fang, Chem. Sci., 2012, 3, 3302 RSC.
- S. Guo and S. Dong, Chem. Soc. Rev., 2011, 40, 2644 RSC.
- L. Wang and Y. Yamauchi, J. Am. Chem. Soc., 2013, 135, 16762 CrossRef CAS PubMed.
- D. H. Chen, Y. C. Zhao, X. L. Peng, X. Wang, W. J. Hu, C. Jing, S. S. Tian and J. N. Tian, Electrochim. Acta, 2015, 177, 86 CrossRef CAS.
- K. Sasaki and R. R. Adzic, J. Electrochem. Soc., 2008, 155, B180 CrossRef CAS.
- S. Papadimitriou, S. Armyanov, E. Valova, A. Hubin, O. Steenhaut, E. Pavlidou, G. Kokkinidis and S. Sotiropoulos, J. Phys. Chem. C, 2010, 114, 5217 CAS.
- J. Rossmeisl, P. Ferrin, G. Tritsaris, A. Nilekar, S. Koh, S. Bae, S. Brankovic, P. Strasser and M. Mavrikakis, Energy Environ. Sci., 2012, 5, 8335 CAS.
- Z. W. Chen, M. Waje, W. Z. Li and Y. S. Yan, Angew. Chem., Int. Ed., 2007, 46, 4060 CrossRef CAS PubMed.
- F. Wang, C. H. Li, L. D. Sun, C. H. Xu, J. F. Wang, J. C. Yu and C. H. Yan, Angew. Chem., Int. Ed., 2012, 51, 4872 CrossRef CAS PubMed.
- S. Z. Wang, L. Kuai, Y. C. Huang, X. Yu, Y. D. Liu, W. Z. Li, L. Chen and B. Y. Geng, Chem. Eur. J., 2013, 19, 240 CrossRef CAS PubMed.
- L. Han, P. L. Cui, H. Y. He, H. Liu, Z. J. Peng and J. Yang, J. Power Sources, 2015, 286, 488 CrossRef CAS.
- Y. X. Wang, H. J. Zhou, P. C. Sun and T. H. Chen, J. Power Sources, 2014, 245, 663 CrossRef CAS.
- M. X. Gong, G. T. Fu, Y. Chen, Y. Tang and T. H. Lu, ACS Appl. Mater. Interfaces, 2014, 6, 7301 CAS.
- H. M. Song, D. H. Anjum, R. Sougrat, M. N. Hedhilib and N. M. Khashab, J. Mater. Chem., 2012, 22, 25003 RSC.
- H. Ataee-Esfahani, L. Wang, Y. Nemoto and Y. Yamauchi, Chem. Mater., 2010, 22, 6310 CrossRef CAS.
- B. Y. Xia, H. B. Wu, X. Wang and X. W. Lou, J. Am. Chem. Soc., 2012, 134, 13934 CrossRef CAS PubMed.
- M. Wang, W. Zhang, J. Wang, A. Minett, V. Lo, H. Liu and J. Chen, J. Mater. Chem. A, 2013, 1, 2391 CAS.
- C. X. Xu, Q. Li, Y. Q. Liu, J. P. Wang and H. R. Geng, Langmuir, 2012, 28, 1886 CrossRef CAS PubMed.
- H. J. You, F. L. Zhang, Z. Liu and J. X. Fang, ACS Catal., 2014, 4, 2829 CrossRef CAS.
- X. H. Ji, X. N. Song, J. Li, Y. B. Bai, W. H. Yang and X. G. Peng, J. Am. Chem. Soc., 2007, 129, 13939 CrossRef CAS PubMed.
- C. J. Murphy, A. M. Gole, S. E. Hunyadi, J. W. Stone, P. N. Sisco, A. Alkilany, B. E. Kinard and P. Hankins, Chem. Commun., 2008, 544 RSC.
- J. Fennell, D. S. He, A. M. Tanyi, A. J. Logsdail, R. L. Johnston, Z. Y. Li and S. L. Horswell, J. Am. Chem. Soc., 2013, 135, 6554 CrossRef CAS PubMed.
- S. Dutta, C. Ray, A. K. Sasmal, Y. Negishi and T. Pal, J. Mater. Chem. A, 2016, 4, 3765 CAS.
- Y. Tong, J. Pu, H. Y. Wang, S. B. Wang, C. Liu and Z. H. Wang, J. Electroanal. Chem., 2014, 728, 66 CrossRef CAS.
- S. E. Habas, H. Lee, V. Radmilovic, G. A. Somorjai and P. Yang, Nat. Mater., 2007, 6, 692 CrossRef CAS PubMed.
- S. Dutta, C. Ray, S. Sarkar, A. Roy, R. Sahoo and T. Pal, Electrochim. Acta, 2015, 180, 1075 CrossRef CAS.
- J. N. Zheng, S. S. Li, X. Ma, F. Y. Chen, A. J. Wang, J. R. Chen and J. J. Feng, J. Mater. Chem. A, 2014, 2, 8386 CAS.
- Z. Y. Zhou, Z. Z. Huang, D. J. Chen, Q. Wang, N. Tian and S. G. Sun, Angew. Chem., Int. Ed., 2010, 49, 411 CrossRef CAS PubMed.
Footnote |
† Electronic supplementary information (ESI) available: TEM images of the Au–Pt sample obtained without sodium citrate, pure Pt nanoparticles, and the AuPt-1 and AuPt-3 samples; UV-visible absorption spectra of Au seeds contained in a light pink solution. See DOI: 10.1039/c6ra06370e |
|
This journal is © The Royal Society of Chemistry 2016 |
Click here to see how this site uses Cookies. View our privacy policy here.