Nitrogen-doped heterostructure carbon functionalized by electroactive organic molecules for asymmetric supercapacitors with high energy density

Bingshu Guo, Zhongai Hu*, Yufeng An, Ning An, Pengfei Jia, Yadi Zhang, Yuying Yang and Zhimin Li
Key Laboratory of Eco-Environment-Related Polymer Materials of Ministry of Education, Key Laboratory of Polymer Materials of Gansu Province, College of Chemistry and Chemical Engineering, Northwest Normal University, Lanzhou, Gansu 730070, PR China. E-mail: zhongai@nwnu.edu.cn; Fax: +86 931 8859764; Tel: +86 931 7973255

Received 28th March 2016 , Accepted 9th April 2016

First published on 18th April 2016


Abstract

Chemical oxidation is employed to lengthwise unzip and transverse cut multi-walled carbon nanotubes (MWCNTs) to form heterostructure carbon nanotubes (HCNTs) that are residual tubes with randomly distributed graphene layers on the tube wall. Then, we coat polyaniline nanoparticles on HCNTs through in situ polymerization, in which the HCNTs are served as core and polyaniline is regarded as shell. The resultant core–shell structure is converted to a nitrogen-doped heterostructure carbon (NHC) through pyrolysis by following alkali activation. Subsequently, the NHC is used as conductive substrate to adsorb tetrachlorobenzoquinone (TCBQ) and anthraquinone (AQ) molecules via π–π stacking interaction to get the functionalized nitrogen-doped heterostructure carbon (TCBQ–NHC and AQ–NHC), respectively. As a result, multielectron reactions in positive and negative potential ranges are implanted in two electrodes, respectively. Electrochemical measurements show that the TCBQ–NHC and AQ–NHC electrodes achieve specific capacitances of 365 and 331 F g−1 at 1 A g−1 in potential windows of 0–1.0 and −0.4 to 0.6 V, respectively. Furthermore, the as-constructed AQ–NHC//TCBQ–NHC asymmetric supercapacitor (ASC) can deliver high energy density (20.3 W h kg−1) at the power density of 0.7 kW kg−1 with long cycle life (the capacitance remains 98% of the initial value after 5000 cycles).

1. Introduction

Carbon materials such as activated carbon, carbon onions, carbon nanotubes (CNTs), graphene and a series of carbon-derived carbides have been certified to be promising electrode materials for supercapacitors.1–4 Among them, CNTs are one-dimensional carbon materials that have shown competitive advantages in supercapacitor fields as their extraordinary structure, dominant mesoporous character and low resistivity.5,6 Nevertheless, serious shortcomings lead to their desirable electrochemical properties unable to reveal, including: firstly, pristine CNTs with length in the range of micrometer easily interwoven to form “rope” which make the effective specific surface area reduced; secondly, few oxygen-containing functional groups on the surface of CNTs impede them to disperse uniformly in some common chemical solvent; finally, only the outermost layer of tubes could provide the reaction interface during the electrochemical process because of the closed end of the nanotubes.7–11 To address these problems, several chemical and/or physical methods are used to lengthwise unzip and transverse cut MWCNTs to form unique heterostructure with 1D nanotube and 2D graphene. It is expected that the unzipped CNTs have good dispersion, higher specific surface area and excellent hydrophilicity (see the measured results in the ESI).12,13 For example, Dmitry V. Kosynkin et al. cut and unraveled MWCNTs for preparing graphene nanoribbons which had highly soluble in water, ethanol and other polar organic solvents.14 Lu-Yin Lin et al. reported a core–shell heterostructure with multi-walled carbon nanotubes as the core and graphene oxide nanoribbons as the shell (MWCNTs@GONR) for supercapacitor electrode material. The electrode achieved a high specific capacitance of 232.9 F g−1 at a current density of 1 A g−1, which is nearly six times of pristine MMCNTs (38.4 F g−1).13 Thus, it can be seen that longitudinal unzip or transverse cut MWCNTs is a practicable approach to reconstruct the carbon nanotubes.

Although the hydrophilicity of unzipped carbon nanotubes can be improved, their specific surface areas and specific capacitances are still relatively lower than porous carbon (Table S1). As has been reported many times in the literatures, the nitrogen-doped not only used to improve the wettability of carbon materials but also enhance the chemically reactive.15–17 Of the reported methods, pyrolysis of conductive polymers seems to be a simple and practicable route to obtain nitrogen-doped carbon materials.18–20 For example, Ning An et al. prepared porous nitrogen-doped carbon nanotubes (PNCNTs) by using polyaniline nanotubes (PNTs) and further functionalized by anthraquinone (AQ). After that, the electrode exhibited a specific capacitance of 448 F g−1 in 1 M H2SO4 electrolyte.21 Haiyan Liu et al. also prepared nitrogen-containing activated carbon nanotubes (ACNTs) through pyrolysis and activation of polyaniline nanotubes. The products displayed high capacitance (468 F g−1 at the current density of 0.1 A g−1) when used as the electrode material for supercapacitor.22

However, for all carbonaceous materials, the electrical double-layer energy storage mechanism results in limited specific capacitance when they are directly used as the electrode materials.23 As a new strategy, some studies introduced electroactive organic compounds into carbonaceous materials in the form of molecule to enhance the capacitive performance of the electrode.24,25 Compared with the traditional metal oxides or hydroxides, these organic compounds are renewable resources. Most of them exist in natural state or can be synthesized in the laboratory, implying lower cost and environmentally friendly feature.26 Especially, such organic molecules are usually involved in multielectron reactions which are the bases of high energy storage ability.27 The redox functional groups in these organic molecules can reversibly transform into each other without the damage of molecule skeletons under electrochemical cycling process. Moreover, some special organic molecules can provide desired electrochemical properties by adjusting molecular structures or organic functional groups.26,28 It should be emphasized that the organic molecules as electrode materials for supercapacitors must satisfy the electrochemical kinetic conditions as follow: firstly, the cyclic voltammetry (CV) curves of the organic molecules used as electroactive species have small peak separation between oxidation and reduction peaks; secondly, the peak currents are varies linearly with the applied sweep rate (ν) rather than ν1/2. In other words, the corresponding electrochemical reactions are only accompanied by the proton insertion/extraction without controlled by the diffusion; besides, the organic molecules must be attached on conductive carbon substrates to form a stationary phase due to their poor electrical conductivity and high solubility in common electrolyte.25,28,29 Some works concerned with electroactive organic compounds have been reported. For instance, Takako Tomai et al. successfully assembled metal-free aqueous redox capacitors through absorbing different quinones organic compounds on nanoporous activated carbon, which exhibited a large energy density (>20 W h kg−1), even though the applied potential range between 0 and 1.0 V.26 The group of Volker Presser et al. decorated carbon onions by using 1,4-naphthoquinone, 9,10-phenanthrenequinone and 4,5-pyrenedione to improve the energy density of supercapacitor. Among them, the 4,5-pyrenedione modified carbon onions displayed a maximum capacitance (264 F g−1) and the longest cycle life in 1 M H2SO4 electrolyte.30 In addition, our research group has also done some related work.31 As mentioned above, incorporating redox-active molecules into the carbonaceous materials is an alternative route to improve the capacitive performances.

In the present work, we design and fabricate NHC in which HCNTs with randomly distributed graphene layers on the tubes wall are regarded as core and the porous nitrogen-doped carbon is used as shell. This unique structure makes the NHC possess high conductivity and large specific surface area, which is suitable for adsorbing the organic molecules to form high-performance electrode material for supercapacitor. More interestingly, TCBQ–NHC exhibits a specific capacitance of 365 F g−1 in the more positive potential ranging from 0 to 1.0 V, and accordingly AQ–NHC reveals a specific capacitance of 331 F g−1 in the more negative potential ranging from −0.4 to 0.6 V. The TCBQ–NHC and AQ–NHC are able to well match with each other when they are used as positive and negative electrodes for supercapacitor respectively. The test results show that the ASC device constructed by TCBQ–NHC and AQ–NHC delivers a high energy density (20.3 W h kg−1 along with 0.7 kW kg−1) in aqueous electrolyte solution with the operating voltage of 1.4 V. Furthermore, the device shows long cycle life (the capacitance remains 98% of the initial value after 5000 cycles).

2. Experimental

2.1. Materials

Multi-walled carbon nanotubes (MWCNTs, Chengdu, P.R., China). Concentrated sulfuric acid, concentrated nitric acid, potassium permanganate and hydrogen peroxide (H2SO4, HNO3, KMnO4 and H2O2, Sinopharm Chemical Reagent Corp, China). Aniline monomer (An, Shanghai Zhongqin Chemical Reagent Corp, China) was distilled under reduced pressure. Ammonium persulfate (APS, Sinopharm Chemical Reagent Corp, China), anthraquinone (AQ, Alfa-Aesar), tetrachlorobenzoquinone (TCBQ, Energy Chemical, China). Deionized (DI) water was used throughout all the experiments. All the chemicals are analytical grade in the experiments.

2.2. Sample preparation

2.2.1. Unzipping and cutting MWCNTs. The MWCNTs were unzipped and cut through chemical oxidation. In brief, 0.5 g of purified MWCNTs32 was dispersed into the mixture of 80 mL concentrated H2SO4 and concentrated HNO3 (volume ratio of 3[thin space (1/6-em)]:[thin space (1/6-em)]1) in a 250 mL beaker with vigorously stirring. Next, 1.5 g of KMnO4 was slowly added to the beaker with sonicating for 5 h. The mixture was diluted with 200 mL DI water, and then 10 mL of 30% H2O2 was added. The suspension was centrifuged at 12[thin space (1/6-em)]000 rpm and washed with DI water, followed by drying at 80 °C under vacuum for 12 h to achieve HCNTs. For comparison, the reduced heterostructure carbon nanotubes (rHCNT) were obtained by annealing HCNTs at 200 °C in air for 4 h.
2.2.2. Prepared of precursor. 0.1 g of as-prepared HCNTs was dispersed in 100 mL of HCl (1 M) by sonication for 2 h. Then, 0.5 g of aniline monomer was added into the dispersion by stirring for 30 min. Subsequently, 20 mL of 0.27 M ammonium persulfate (APS) solution was slowly added to the mixture and remained temperature at 0–4 °C with continuous stirring for 10 h. Finally, the products were collected by filter, washed with DI water and ethanol several times, respectively. The emerald solid was dried at 60 °C under vacuum for 12 h to get polyaniline/heterostructure carbon nanotubes composite (PANI/HCNTs).
2.2.3. Synthesis and functionalization of NHC. The NHC was synthesized through pyrolyzing PANI/HCNTs followed by activating. Firstly, as-prepared PANI/HCNTs was carried out to pyrolyze at 800 °C for 1.5 h under N2 atmosphere. Secondly, after cooling down to room temperature, the black powders were physically mixed with KOH (mass ratio of 1[thin space (1/6-em)]:[thin space (1/6-em)]3) and activated at 800 °C for 1.5 h under N2 atmosphere. The final product was washed with 1 M HCl and DI water several times and then dried at 60 °C overnight donating as NHC. In the end, in order to functionalize NHC with organic molecules, the 0.1 g of NHC was soaked in 30 mL acetone solution of TCBQ (tetrachlorobenzoquinone) and acetone solution of AQ (anthraquinone) for 12 h, respectively. The final product was washed several times by DI water and dried at 70 °C to obtain TCBQ–NHC and AQ–NHC. In addition, the different composites can be prepared by controlling mass ratio of the AQ (TCBQ) to NHC. For convenience, the products were denoted as molecule-NHC x[thin space (1/6-em)]:[thin space (1/6-em)]y to indicate the mass ratio of molecule (x) to NHC (y). The mass loading in the optimal sample was determined by electrochemical technique (see details in the ESI).

2.3. Characterization of materials

Fourier-transform infrared (FT-IR) analysis was carried out on a Nicolet Nexus 670 spectrometer. Ultraviolet-visible (UV-vis) detection was performed on a UV-1102 spectrophotometer. Powder X-ray diffraction (XRD) of materials was implemented on a diffractometer (D/Max-2400) with Cu Kσ radiation (λ = 1.5418 Å) operating at 40 kV, 100 mA. The Raman spectroscopy were measured by (Bruker RFS 100/S, Germany). The morphologies of products was characterized by field emission scanning electron microscopy (FESEM; ULTRA plus, Germany) and transmission electron microscope (TEM; JEOL, JEM-2010, Japan). The Brunauer–Emmett–Teller (BET) measurement was performed by Micromeritics ASAP 2020 nitrogen adsorption apparatus (USA). X-ray photoelectron spectroscopy (XPS) analysis was recorded using monochromatic Al Kα radiation source (ThermoVG Scientific). Contact angle measurement for surface wettability was performed by HARKE-SPCAx3 equipment with a CMOS camera.

2.4. Electrochemical measurements

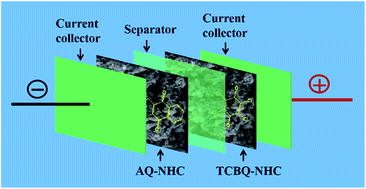
To test the electrochemical performances of the materials, the working electrode was prepared by dispersing 85% as-prepared samples, 15% acetylene black in 0.4 mL of Nafion (0.25 wt%). Then 6 μL of the above homogeneous slurry was dropped onto the glassy carbon electrode using a pipet gun and dried at room temperature. The cyclic voltammetry (CV), galvanostatic charge–discharge (GCD), electrochemical impedance spectroscopy (EIS) and cycle stability were tested, in which platinum foil and saturated calomel electrode (SCE) were used as counter electrode and reference electrode, respectively. In order to evaluate the energy density, an ASC was assembled and its electrochemical performances were investigated, in which TCBQ–NHC, AQ–NHC, and glass fiber were served as positive electrode, negative electrode and separator, respectively. All electrochemical measurements were carried out in 1 M H2SO4 aqueous solution on a CHI760E electrochemical working station.

3. Results and discussion

The preparing process for TCBQ–NHC and AQ–NHC is presented in Fig. 1.
image file: c6ra07923g-f1.tif
Fig. 1 Schematic illustration for preparing organic molecules functionalized nitrogen-doped heterostructure carbon.

3.1. Physical characterization

Fig. 2a presents the FT-IR spectra of the four samples. The strong absorption peaks at around 1684 and 1677 cm−1, corresponding to TCBQ and AQ, respectively, are derived from the C[double bond, length as m-dash]O stretching vibrations. The relatively weak absorption peaks at near 1564 and 1578 cm−1 are correspond to aromatic C[double bond, length as m-dash]C vibrations of TCBQ and AQ, respectively. The other characteristic peaks of TCBQ and AQ can be also observed at about 1106 and 1280 cm−1, respectively. In addition, the C–Cl stretching vibrations bonds of TCBQ–NHC reveal at 746 cm−1, while the C–H out-of-plane bending vibrations bonds of AQ–NHC appear at 692 cm−1.33,34 Compared with the corresponding pure organic molecules, the characteristic absorption peaks are well maintained in the two composites. Further observation indicates that the aromatic C[double bond, length as m-dash]C vibrations of TCBQ in the TCBQ–NHC composite shows a slight red shift in comparison with that of pure TCBQ molecule, which could be attributed to π–π conjugating effect between TCBQ and NHC.35 However, this phenomenon is not observed in the spectrum of AQ–NHC composite. The main reason may be ascribed to that the AQ molecule itself has large conjugate system composed of three benzene rings, which could offer a buffer effect. The analysis results confirm that the NHC has been successfully functionalized by the AQ and TCBQ. The FT-IR spectrum of the substrate is shown in Fig. S2.
image file: c6ra07923g-f2.tif
Fig. 2 FT-IR spectra of TCBQ–NHC and TCBQ, AQ–NHC and AQ (a). UV-vis absorption spectra of TCBQ–NHC and TCBQ, AQ–NHC and AQ (b). Raman spectra of MWCNTs, HCNTs, NHC, AQ–NHC and TCBQ–NHC (c), size of the ordered domains of the samples determined from the data in the Table 1 (d) and XRD patterns of MWCNTs, HCNTs, NHC, AQ–NHC and TCBQ–NHC (e).

The UV-vis absorption spectra were employed to further determine the organic molecules on the surface of NHC. All samples were dispersed with a low concentration (0.015 g mL−1) in ethanol by sonicating. As shown in Fig. 2b, absorption spectrum of AQ–NHC appears a clearly absorption band at short-wavelength of 251 nm with a shoulder peak at the longer wavelength of 273 nm which can be assigned to π–π* transitions.31 However, a relatively weak absorption band at 325 nm originates from the n–π* transitions.36 For TCBQ–NHC, the absorption band at 287 nm is an indication of quinonoid π–π* transitions.37 The composites display all absorption bands of organic molecules, indicating that the organic molecules are anchored on the NHC substrate. It is found from further observations that these absorption bands show a slight red shift at different degree, which could be attributed to the π–π interaction between the guest molecules (TCBQ or AQ) and NHC.

Further information can be concluded from the Raman spectra of samples, as shown in Fig. 2c. All samples display two main peaks: D-band and G-band. The former derives from the A1g mode of 3D graphitic-like lattice vibrations in connection with defects or structural disorder, while the latter is attributed to the E2g mode first-order scattering from the sp2 carbon domains, such as graphite layers.38 The intensity ratio between the D-band and G-band (ID/IG, see Table 1) indicates the degree of disorder within the samples. In other words, the ID/IG ratio is inversely proportional to the size of the ordered domains.38 Thus, the values of ID/IG are used to evaluate the size of ordered domains of the investigated samples as shown in Fig. 2d.39,40 Compared with pristine MWCNTs, the size of ordered domain of HCNTs is reduce from 10.00 nm to 3.21 nm owning to voluminously structural defects produced during the process of strong acid oxidation. As a result, the original ordered structure of MWCNTs is partly destroyed. Meanwhile, the positions of the D and G band show a slight broaden and subsequent shift, which perhaps due to the increase of oxygen-containing functional groups on the edge of nanotubes.9,41,42 The size of ordered domains of NHC, AQ–NHC and TCBQ–NHC are 3.79, 3.96 and 4.07, respectively. The conjugated organic molecules absorbed on the surface of NHC increase the ordered domain size slightly.

Table 1 The ID/IG ratios of samples
Samples MWCNTs HCNTs NHC AQ–NHC TCBQ–NHC
ID/IG ratio 0.44 1.37 1.16 1.11 1.08


X-ray diffraction (XRD) patterns of the samples are shown in Fig. 2e. The pristine MWCNTs exhibit a characteristic graphitic (002) peak at around 2θ = 26°.43 In comparison, the (002) peak of HCNTs near 21.7° has an obviously left shift and becomes widen due to the increase of basal spacing. This result indicates that after unzipping and cutting, there are large amount of oxygen-containing functional groups, graphite oxide layers and other structural defects in the HCNTs.41,42 The XRD pattern of NHC reveals an amorphous structure with a broad diffraction peaks at near 21.7°.44 For AQ–NHC and TCBQ–NHC, the spectra remain the essential feature of the XRD pattern of NHC, which suggests that the organic compounds are absorbed in the form of molecule. In other words, the free phase of the adsorbed AQ and TCBQ molecules does not exist in the two composites.

The morphologies of the as-obtained samples were characterized by FESEM and shown in Fig. 3. In the FESEM image of MWCNTs (Fig. 3a), the sample shows fibrous structure with a smooth surface and the outer diameter in the range of 30–40 nm. After strong acid ultrasonic tailoring, the as-obtained HCNTs (Fig. 3b) retain their tube-like structure with lengths of nanoscale.12 Seen from the FESEM image of PANI/HCNTs composite (Fig. 3c), the PANI nanoparticles are uniformly covered on the surface of HCNTs and the tubes diameters range from 150 nm to 200 nm. In fact, in the process of polymerization, the HCNTs are considered as core which can provide a large number of active sites for nucleation of aniline molecules when APS is added into the suspension. After pyrolyzing and activating, the NHC (Fig. 3d) still remains nanotubes structure. On the whole, the images of organic molecules functionalized composites (Fig. 3e and f) keep similar morphology with NHC composite. The free phase of organic molecules is not observed since the washing operation can remove the free organic molecules from the resultant composites. Taking the FT-IR and UV-vis analysis into consideration, it is inferred that the organic molecules are absorbed in the form of molecules.


image file: c6ra07923g-f3.tif
Fig. 3 FESEM of MWCNTs (a), HCNTs (b), PANI/HCNTs (c), NHC (d), AQ–NHC (e) and TCBQ–NHC (f).

To further characterize the structure of samples, TEM studies were carried out as shown in Fig. 4. Compared with MWCNTs (Fig. 4a), the TEM image of HCNTs (Fig. 4b) further prove that the short nanotubes are obtained by longitudinal unzipping and transverse cutting of MWCNTs. The graphene layers jump into our sight and the residual and incomplete tubes structure could still be distinguished (TEM bright-field region-I, II). This special structure is designated as heterostructure carbon nanotubes (HCNTs) with randomly distributed graphene layers on the tube wall. Obviously, HCNTs have larger active surface due to the graphene layers, comparing with the pristine MWCNTs. As shown in TEM image of PANI/HCNTs (Fig. 4c), the tube structure of the HCNTs (TEM bright-field region-III, IV) can be seen in spite of the increased diameters, implying the formation of a core–shell structure. After high temperature pyrolyzing and activating, the structure of the sample has not changed and shown in Fig. 4d. This actually benefits from slow heating rate (5 °C min−1) during the pyrolysis.21 Nevertheless, the organic molecule crystals cannot be observed in the TEM images of composites (Fig. 4e and f), indicating that non-covalent modification does not affect morphology feature of substrate.


image file: c6ra07923g-f4.tif
Fig. 4 TEM of MWCNTs (a), HCNTs (b), PANI/HCNTs (c), NHC (d), AQ–NHC (e) and TCBQ–NHC (f).

X-ray photoelectron spectroscopy (XPS) was used to analyze the elemental composition of three samples. The whole patterns are shown in Fig. 5a, three distinct peaks are observed in the spectra of NHC, TCBQ–NHC and AQ–NHC, which can be explained by C 1s peak at around 285 eV, O 1s peak near 531 eV and a weak N 1s peak at about 400 eV.22 The appearance of nitrogen signal peak confirms that N atoms are successfully incorporation into the NHC through pyrolysis. In addition, in the spectrogram of TCBQ–NHC emerges another new peak, corresponding to the Cl 2p peak at around 200 eV which results from TCBQ.45 The C 1s spectra of samples can be resolved into three distinct components and shown in Fig. S3a–c. For NHC (Fig. S3a), the peaks at binding energy of 284.6, 285.8, and 287.6 eV are represent sp2–sp2 C, N–sp2 C (C–O) and N–sp3 C (C[double bond, length as m-dash]O) bonds, respectively.46,47 After functionalization, the peaks of composites at near 287.6 eV are slightly enhanced, which may be attributed to the C[double bond, length as m-dash]O of TCBQ or AQ molecules, respectively (Fig. S3b and c). Similarly, the O 1s spectrum of NHC (Fig. S3d) can be fitted into three peaks located at 531.4 eV (C[double bond, length as m-dash]O), 532.2 eV (C–OH) and 533.3 eV (C–O–C).22,48 Compared with NHC, the peaks at near 531.4 eV (C[double bond, length as m-dash]O) for composites become intensive slightly, implying the content of C[double bond, length as m-dash]O increases after adsorbing organic molecules (Fig. S3e and f). Furthermore, the N 1s spectrum (Fig. 5b) of the NHC has been resolved into four individual component peaks, which represents pyridine nitrogen (N-6, 398.4 eV), pyrrole nitrogen (N-5, 400 eV), quaternary nitrogen (N-Q, 400.9 eV) and N-oxides of pyridine-N group (N-Ox, 402.6 eV), respectively.47


image file: c6ra07923g-f5.tif
Fig. 5 XPS spectra of the samples (a) and N 1s region of NHC (b). Nitrogen adsorption/desorption isotherms of NHC (c), TCBQ–NHC and AQ–NHC (d).

Nitrogen adsorption/desorption isotherms of NHC, TCBQ–NHC and AQ–NHC are shown in Fig. 5c and d. According to the classification of IUPAC, these three materials all belong to type IV adsorption/desorption isotherms with the mesoporous features.49 After activation, the adsorption amount of NHC increases rapidly with a high specific surface area of 1454 m2 g−1, which is larger than pyrolytic PANI/HCNTs with a specific surface area of 234 m2 g−1 (Fig. S4). Furthermore, the N2 adsorption–desorption isotherm of NHC with an almost horizontal plateau at the medium pressure (P/P0 = 0.2–0.9) and a clear capillary condensation step at the high relative pressure (P/P0 = 0.9–0.99) indicate that there are a large number of mesoporous and a certain of macropores.50 These porous enlarge the specific surface and are beneficial to transport the electrolyte ions into the inner tubes during the rapid charge/discharge process. After adsorbing TCBQ and AQ on the surface of NHC, the specific surface areas of composites sharply decrease to 219 m2 g−1 (TCBQ–NHC) and 571 m2 g−1 (AQ–NHC), respectively. We speculate that the organic molecules should be adsorbed on the surface of NHC, which lead to some porous are coved.

3.2. Electrochemical characterization

The electrochemical behaviors were researched in a three-electrode configuration with 1 M H2SO4 electrolyte. Fig. 6a and b show the CV curves of TCBQ–NHC (0–1.0 V) and AQ–NHC (−0.4 to 0.6 V) at 20 mV s−1, respectively. For comparing, the CV curves of the substrate materials are also given at the same time. Apparently, the integral area for the CV curve of the MWCNTs is much smaller in comparison with that of NHC and two composites. Therefore, the specific capacitance of MWCNTs can be ignored. The CV curve of the NHC shows rectangular-like shape, which is the characteristic of electrical double-layer capacitance (EDLC) behavior. Comparatively, after functionalizing, the CV curve of TCBQ–NHC shows an obviously reversible redox couple with oxidative peak potential at around 0.52 V and reductive peak potentials at near 0.49 V, respectively. Moreover, the CV curve appears the other two pairs of shoulder peaks at the potential about 0.4 V. The overall electrochemical process of TCBQ can be described as two electrons and two protons process and shown in reaction (R1).26 In contrary, as for the AQ–NHC (Fig. 6b), a couple of conspicuous redox peaks can been seen from the CV curve. The oxidative and reductive peaks are locate near −0.08 and −0.115 V, respectively. The electrochemical process of AQ–NHC can also be described as a two electrons and two protons process and shown in reaction (R2):21,26
 
image file: c6ra07923g-u1.tif(R1)
 
image file: c6ra07923g-u2.tif(R2)

image file: c6ra07923g-f6.tif
Fig. 6 CV curves of MWCNTs, NHC, TCBQ–NHC (a) and MWCNTs, NHC, AQ–NHC (b) at a scan rate of 20 mV s−1. CV curves of TCBQ–NHC (c) and AQ–NHC (d) at different scan rates and the relationships between the peak specific current (ip) and scan rate (ν) of TCBQ–NHC (e) and AQ–NHC (f).

The electrochemical performances of the other composites, which has different mass ratio between molecule (TCBQ or AQ) and NHC, are shown in Fig. S6.

Fig. 6c and d show the CV curves of the two composites at different scan rates. As the scan rate increases, the oxidative and reductive peaks shift to higher and lower potentials due to uncompensated resistance but the shapes of CV curves are without distortion, indicating that the electrolyte ions can diffuse into the NHC rapidly.51,52 The CV curves in the positive sweep region are symmetric to their corresponding negative sweep region, suggesting the kinetic reversibility in the redox process. When the scan rate at 20 mV s−1, the CV curves of TCBQ–NHC and AQ–NHC have small peak potential separations of 25 and 37 mV, respectively, which can be ascribed to the fast charge transfer process between organic molecules and NHC. By reason of the uncompensated resistance, the peak potential separations are continuously enlarged with the scan rate increasing from 5 to 50 mV s−1, which is showed in Table 2.46

Table 2 Peak potential separation at different scan rates
Scan rate (mV s−1) 5 10 20 30 50
TCBQ–NHC 23 mV 24 mV 25 mV 32 mV 46 mV
AQ–NHC 19 mV 24 mV 37 mV 49 mV 65 mV


Furthermore, the variation of peak current (ip) with scan rate (ν) will reveal kinetic information of the electrode materials. When the redox reaction is controlled by capacitive process (surface-controlled), the ip is proportional to ν. However, if the ip varies directly with ν1/2, the redox reaction is limited by semi-infinite diffusion.53 Fig. 6e presents the plot of ip against ν for the TCBQ–NHC. A linear relationship is detected between the ip and the ν with Ro2 = 0.994 and RR2 = 0.994 (the scan rate range from 5 to 100 mV s−1), respectively, which indicates that the redox process is not controlled by concentration diffusion. This kinetic behavior makes charge transfer of electroactive species relaxed, which is similar to charging and discharging in electric layer double capacitors to some extent. For AQ–NHC electrode, it has a same feature as shown Fig. 6f.

Fig. 7a presents the galvanostatic charge–discharge curves (GCD curves) of MWCNTs, NHC and TCBQ–NHC at current density of 1 A g−1 with the potential ranging from 0 to 1.0 V. Meanwhile, Fig. 7b shows the GCD curves of MWCNTs, NHC and AQ–NHC at current density of 1 A g−1 with the potential ranging from −0.4 to 0.6 V. Compared to MWCNTs and pure NHC, the GCD curves of TCBQ–NHC and AQ–NHC show an overtly plateau, which are attributable to the redox of TCBQ and AQ, respectively. The specific capacitances (C, F g−1) of the electrodes can be calculated from the discharge curves by using the formula as follow:

 
image file: c6ra07923g-t1.tif(1)
where I (A) is current, Δt (s) is the discharge time, ΔV (V) is the practical potential window, and m (g) is the mass of active materials.28 The specific capacitances of TCBQ–NHC and AQ–NHC are calculated to be 365 and 331 F g−1 which are higher than the specific capacitance of AQ functionalized HCNTs (AQ–HCNTs, the details can been seen in Fig. S7). Just as the results of the CV test, these values are much higher than the pure NHC (251.0 F g−1 with the potential ranging from 0 to 1.0 V and 252.3 F g−1 with the potential ranging from −0.4 to 0.6 V). These excellent capacitances derive from the additional electrochemical capacitance of active organic molecules and the strong positive synergistic effects between organic molecules and NHC.


image file: c6ra07923g-f7.tif
Fig. 7 GCD curves of MWCNTs, NHC, TCBQ–NHC (a) and MWCNTs, NHC, AQ–NHC (b) at 1 A g−1, GCD curves of TCBQ–NHC (c) and AQ–NHC (d) at different current densities, specific capacitances of TCBQ–NHC and AQ–NHC (e) at various current density and cycle life of the two composites (f) at 10 A g−1.

The discharge curves of TCBQ–NHC and AQ–NHC at various current densities are shown in Fig. 7c and d. All of these curves show an overtly plateau. Besides, it also demonstrates that the reversible redox of organic molecules make it possible for composites to charge/discharge under high current density. The specific capacitances of TCBQ–NHC and AQ–NHC at different current densities are illustrated in Fig. 7e. For TCBQ–NHC, the capacitance retention (276 F g−1 at 20 A g−1) is 75.6% of the initial value at 1 A g−1. Similarly, the AQ–NHC (250 F g−1 at 20 A g−1) can remain 75.5%, which is higher than AQ–HCNTs, rHCNTs and MWCNTs (Fig. S7c). The good rate capability is closely related to a key factor that the unique heterostructure of composites leads to the fast electrochemical kinetic process. Above all, the unzipped carbon nanotubes as the core of composites enhance overall electrical conductivity of the electrode materials. Next, the as-adsorbed organic molecules have the smaller charge transfer resistance due to electrochemical catalytic action of the substrate surface. Finally, in the process of electrochemistry, the porous structure of the substrates is beneficial to the electrolyte ions transport during the electrochemical process.

To evaluate the stability of the electrodes during the charge–discharge circle, the plot of capacitance retention against cycle number is displayed in Fig. 7f. After 5000 cycles, the capacitances of TCBQ–NHC and AQ–NHC remain 96% and 81% of the initial value, respectively. The excellent stability of TCBQ–NHC could be attributed to the low-solubility of tetrachlorohydroquinone (TCHQ) which obtains from TCBQ in the electrochemical process with four hydrophobic chloric groups. However, the decay of AQ–NHC has to do with the relatively high solubility of hydroquinone (HQ), which obtains from AQ in the electrochemical process.26

Electrochemical impedance tests were employed to study the kinetic features of the electrodes. Nyquist plots of NHC and two composites with the frequency ranging from 0.1 to 105 Hz are shown in Fig. 8a and b. The TCBQ–NHC electrode was carried out at a bias potential of 0.1 V. In the inset, we can observe that the complex plane plots for NHC and TCBQ–NHC show an inconspicuous semicircle in the high frequency region. The semicircle for NHC corresponds to the surface electrochemical reaction of residual oxygen-containing group or doped nitrogen, while the semicircle for TCBQ–NHC is relative to the organic molecule faradaic reaction on the electrode surface. The diameter of semicircle is equal to the charge-transfer resistance.47,54 Apparently, the TCBQ–NHC is larger than NHC in the diameter of semicircle on the Nyquist plot, but its value is still relatively low, implying that electrochemical polarization of composite electrode is slight. The intercept along the x axis corresponds to the equivalent series resistance, which is a sum of the electrolyte resistance, the intrinsic resistance of the active material and the contact resistance between the active material and current collector interface.29 Obviously, TCBQ–NHC is larger than pure NHC in the equivalent series resistance, which may be caused by poor electronic conductivity of TCBQ. In the low frequency, all of the straight line is almost perpendicular to the x axis. This phenomenon reveals that the TCBQ–NHC contributes not only electrochemical capacitance to the electrode but also electric double layer capacitance. The complex plane plot for AQ–NHC was tested at a bias potential of −0.1 V. As seen from Fig. 8b, the results are consistent with these for TCBQ–NHC.


image file: c6ra07923g-f8.tif
Fig. 8 Nyquist plots of NHC and TCBQ–NHC (a) at a bias of 0.1 V, and Nyquist plots of NHC and AQ–NHC (b) at a bias of −0.1 V.

3.3. Asymmetric supercapacitor

For all types of energy storage and conversion devices, power density and energy density are crucial performance parameters. The energy density and power density can be calculated by using the followed equations:
 
image file: c6ra07923g-t2.tif(2)
 
image file: c6ra07923g-t3.tif(3)
 
image file: c6ra07923g-t4.tif(4)
 
image file: c6ra07923g-t5.tif(5)
where C (F g−1) is the total capacitance of the cell in the two-electrode system, Cs (F g−1) is the average specific capacitance of the electrode material, I (A) is the discharge current density, t (s) is the discharge time, ΔV (V) is the cell voltage, M (g) is the total mass of the active species on the two electrodes, E (W h kg−1) is the energy density, and P (W kg−1) is the power density of the ASC.50,55

An all-carbon ASC was assembled by using TCBQ–NHC as positive electrode and AQ–NHC as negative electrode. Moreover, in order to keep the equality of the electrical charge stored on the positive and negative electrodes, the proper mass ratio (R) between the positive and negative electrochemical active species in the two-electrode configuration is calculated as follows:

 
image file: c6ra07923g-t6.tif(6)
where m+ and m are the mass, C+ and C are the specific capacitance, and ΔV+ and ΔV are the potential windows of the positive and negative electrodes, respectively. On the basis of above analysis about the specific capacitance values and potential windows for the single electrodes in three-electrode system, the mass ratio of positive and negative materials is calculated to be 0.91.43

The more efforts have been made to obtain wide voltage since the energy and power densities are directly proportional to (ΔV)2. As seen in Fig. 9a, the CV curves were measured with the cell voltage ranging from 1.0 to 1.4 V at a scan rate of 10 mV s−1. No oxygen evolution is observed when the practical voltage is extended to 1.4 V. In addition, it is notable that there are a couple of obvious peaks near the voltage of 0.6 V, which is equal to the difference between redox peak positions of TCBQ and AQ in the three-electrode configuration. In order to give a reasonable explanation for the CV peaks in the two-electrode system, we image the reciprocity of the electrochemical behavior between two-electrode system and three-electrode system as shown Fig. 9b. The electrode potential in the three-electrode system is against reference electrode (here is saturated calomel electrode), while the cell voltage in the two-electrode system is equal to potential difference between positive and negative electrodes. When the ASC begins charging, its cell voltage will gradually increase starting from 0 V. If the electrode behaviors under the present circumstances are described in the three-electrode system, the corresponding electrochemical process will be that the potential of the positive electrode shift positively starting from 0.33 V while the potential of the negative electrode shift negatively starting from 0.33 V. As the ASC charging process continues until its CV curve reaches the top of peak at near 0.6 V, the two half reactions of redox occur respectively on the positive and negative electrodes by following:

 
image file: c6ra07923g-u3.tif(R3)
 
image file: c6ra07923g-u4.tif(R4)
where the reaction (R3) and reaction (R4) represent the process of charge and discharge. Corresponding results can be achieved in the three-electrode configuration when the potential of positive and negative electrodes arrives nearly at 0.520 and −0.115 V, respectively. After the charging segment is completed, cell voltage of the ASC reaches to 1.4 V. At the moment, the positive and negative electrodes in the electrochemical state as their potential is equal to 1.03 V and −0.37 V in the three-electrode configuration, respectively. On the contrary, the corresponding reverse processes take place in the discharging segment. When the as-fabricated ASC works, the cycle along with green and orange arrows (as shown in Fig. 9b) will repeat itself over and over on the positive and negative electrodes, respectively.28 The matching and coordination of electroactive species in the positive and negative electrodes is undoubtedly a reason resulting in CV peaks in the two-electrode system, which is an electrochemical foundation for obtaining high-performance supercapacitors.


image file: c6ra07923g-f9.tif
Fig. 9 (a) ASC for different cell voltage at a scan rate of 20 mV s−1, schematic diagram of imagination three-electrode system (b), GCD curves of ASC (c) at different cell voltage with the current density of 1 A g−1 in 1 M H2SO4, specific capacitances of ASC (d) at various current density, cycle life of the ASC (e) at 10 A g−1 for 5000 cycles and Ragone plots of ASC (f) as compared to data in other literatures.

Fig. 9c shows the GCD curves of the ASC with increasing cell voltage at the current density of 1 A g−1. The GCD curves are relatively symmetrical even when the cell voltage is extended from 1.0 to 1.4 V. A plot of specific capacitance against current density is illustrated in Fig. 9d. The specific capacitance at 20 A g−1 can retain about 82.4% of that at 1 A g−1 (74.5 F g−1, calculated by using the eqn (2)). The cycling stability of the ASC was tested at 10 A g−1 for 5000 cycles. As shown in Fig. 9e, after 5000 cycles the capacitance retention is 98% of its initial value, indicating a remarkable long-term stability of the ASC.

Power density and energy density are directly relevant to the practical application of supercapacitors. Fig. 9f shows the Ragone plot of energy density and power density. A high energy density of 20.3 W h kg−1 has been achieved at corresponding power density of 0.7 kW kg−1 with an operating voltage of 1.4 V, which is calculated according to eqn (2)–(5). This value is higher than similar systems reported previously such as C-AQ//C-DHB (10 W h kg−1 at 0.18 kW kg−1),56 AQ/GF//GF (13.2 W h kg−1 at 0.917 kW kg−1),31 AC//MnO2/CNTs (13.3 W h kg−1 at 0.6 kW kg−1),43 graphene/MnO2//activated carbon nanofiber (8.2 W h kg−1 at 16.5 kW kg−1),57 rGO/CNTs/PPy//Mn3O4 (14.1 W h kg−1 at 6.62 kW kg−1).58

The reasons of high-energy density and outstanding electrochemical behaviors about the ASC can be summarized as following: firstly, non-covalently functionalization leads to a perfect interfacial contact between the NHC substrate and organic molecules. As a consequence, the redox reactions take place at low charge-transfer resistance and could immediately respond to the change of potential; secondly, the HCNTs as core shortens the transfer path for electrolyte ions during electrochemical reaction process due to its residual hollow tubes; finally, the as-absorbed organic molecules are well matched with each other and fully display the electrochemical activity, which are beneficial to enhance the energy density.

4. Conclusions

In conclusion, a unique nitrogen-doped heterostructure carbon (NHC) with high conductivity and large special surface area is successfully synthetized through three steps. Then, the NHC as a conductive substrate is modified via non-covalent by using TCBQ and AQ as guest molecules to achieve the positive and negative materials with good electrochemical performance. An all-carbon ASC is fabricated by using TCBQ–NHC and AQ–NHC showing excellent energy storage performance. The average energy density can reach to 20.3 W h kg−1 in aqueous electrolyte solution at the power density of 0.7 kW kg−1 with the operating voltage of 1.4 V. Besides, the unique structure of as-prepared electrode materials is responsible for excellent rate capacity (82.4% retention rate at 20 A g−1) of the ASC with a long cycle life (the capacitance remains 98% of the initial value after 5000 cycles). The results show that the organic non-covalent functionalization carbon material is a promising candidate for environmentally friendly supercapacitors.

Acknowledgements

We gratefully acknowledge the financial support offered by the National Natural Science Foundation of China (No. 20963009, 21163017 and 21563027), Specialized Research Fund for the Doctoral Program of Higher Education (No. 20126203110001).

References

  1. N. L. Torad, M. Hu, Y. Kamachi, K. Takai, M. Imura, M. Naito and Y. Yamauchi, Chem. Commun., 2013, 49, 2521–2523 RSC.
  2. W. Xia, B. Qiu, D. Xia and R. Zou, Sci. Rep., 2013, 3, 1935 Search PubMed.
  3. F. Zheng, Y. Yang and Q. Chen, Nat. Commun., 2014, 5, 5261 CrossRef CAS PubMed.
  4. P. Cheng, S. Gao, P. Zang, X. Yang, Y. Bai, H. Xu, Z. Liu and Z. Lei, Carbon, 2015, 93, 315–324 CrossRef CAS.
  5. K. Jurewicz, K. Babeł, R. Pietrzak, S. Delpeux and H. Wachowska, Carbon, 2006, 44, 2368–2375 CrossRef CAS.
  6. S. H. Aboutalebi, A. T. Chidembo, M. Salari, K. Konstantinov, D. Wexler, H. K. Liu and S. X. Dou, Energy Environ. Sci., 2011, 4, 1855–1865 CAS.
  7. M. Yeh, L. Lin, C. Sun, Y. Leu, J. Tsai, C. Yeh, R. Vittal and K. Ho, J. Phys. Chem. C, 2014, 118, 16626–16634 CAS.
  8. L. Qiu, X. Yang, X. Gou, W. Yang, Z. F. Ma, G. G. Wallace and D. Li, Chemistry, 2010, 16, 10653–10658 CrossRef CAS PubMed.
  9. Y. Wang, Z. Shi and J. Yin, J. Phys. Chem. C, 2010, 114, 19621–19628 CAS.
  10. X. Wang, J. Wang and L. Su, J. Power Sources, 2009, 186, 194–200 CrossRef CAS.
  11. G. Wang, Y. Ling, F. Qian, X. Yang, X. Liu and Y. Li, J. Power Sources, 2011, 196, 5209–5214 CrossRef CAS.
  12. B. Xiao, X. Li, X. Li, B. Wang, C. Langford, R. Li and X. Sun, J. Phys. Chem. C, 2014, 118, 881–890 CAS.
  13. L. Lin, M. Yeh, J. Tsai, Y. Huang, C. Sun and K. Ho, J. Mater. Chem. A, 2013, 1, 11237 CAS.
  14. D. Kosynkin, W. Lu, A. Sinitskii, G. Pera, Z. Sun and J. Tour, ACS Nano, 2011, 5, 968–974 CrossRef CAS PubMed.
  15. H. Peng, G. Ma, K. Sun, J. Mu, M. Luo and Z. Lei, Electrochim. Acta, 2014, 147, 54–61 CrossRef CAS.
  16. V. DiNoto, E. Negro, S. Polizzi, K. Vezzu, L. Toniolo and G. Cavinato, Int. J. Hydrogen Energy, 2014, 39, 2812–2827 CrossRef CAS.
  17. E. Negro, K. Vezz, F. Bertasi, P. Schiavuta, L. Toniolo, S. Polizzi and V. Di Noto, ChemElectroChem, 2014, 1, 1359–1369 CrossRef CAS.
  18. J. Hou, C. Cao, F. Idrees and X. Ma, ACS Nano, 2015, 9, 2556–2564 CrossRef CAS PubMed.
  19. J. Zhao, H. Lai, Z. Lyu, Y. Jiang, K. Xie, X. Wang, Q. Wu, L. Yang, Z. Jin, Y. Ma, J. Liu and Z. Hu, Adv. Mater., 2015, 27, 3541–3545 CrossRef CAS PubMed.
  20. X. Du, C. Zhou, H. Liu, Y. Mai and G. Wang, J. Power Sources, 2013, 241, 460–466 CrossRef CAS.
  21. N. An, Y. An, Z. Hu, Y. Zhang, Y. Yang and Z. Lei, RSC Adv., 2015, 5, 63624–63633 RSC.
  22. H. Liu, H. Song, X. Chen, S. Zhang, J. Zhou and Z. Ma, J. Power Sources, 2015, 285, 303–309 CrossRef CAS.
  23. S. Gao, K. Wang, Z. Du, Y. Wang, A. Yuan, W. Lu and L. Chen, Carbon, 2015, 92, 254–261 CrossRef CAS.
  24. S. Burkhardt, M. Lowe, S. Conte, W. Zhou, H. Qian, G. Rodríguez-Calero, J. Gao, R. Hennig and H. Abruña, Energy Environ. Sci., 2012, 5, 7176 CAS.
  25. A. Jaffe, A. Saldivar Valdes and H. Karunadasa, Chem. Mater., 2015, 27, 3568–3571 CrossRef CAS.
  26. T. Tomai, S. Mitani, D. Komatsu, Y. Kawaguchi and I. Honma, Sci. Rep., 2014, 4, 3591 Search PubMed.
  27. S. Isikli and R. Díaz, J. Power Sources, 2012, 206, 53–58 CrossRef CAS.
  28. N. An, F. An, Z. Hu, B. Guo, Y. Yang and Z. Lei, J. Mater. Chem. A, 2015, 3, 22239–22246 CAS.
  29. H. Wang, H. Yi, C. Zhu, X. Wang and H. Jin Fan, Nano Energy, 2015, 13, 658–669 CrossRef CAS.
  30. D. Anjos, J. McDonough, E. Perre, G. Browna, S. Overbury and Y. Gogotsib, Nano Energy, 2013, 2, 702–712 CrossRef CAS.
  31. N. An, F. Zhang, Z. Hu, Z. Li, L. Li, Y. Yang, B. Guo and Z. Lei, RSC Adv., 2015, 5, 23942–23951 RSC.
  32. X. Chen, W. Li, C. Tan, W. Li and Y. Wu, J. Power Sources, 2008, 184, 668–674 CrossRef CAS.
  33. Z. Song, H. Zhan, Y. Zhou and Z. Song, Chem. Commun., 2009, 4, 448–450 RSC.
  34. G. Cheek and R. A. Osteryoung, J. Electrochem. Soc., 1982, 129, 2739–2745 CrossRef CAS.
  35. X. Chen, H. Wang, H. Yi, X. Wang, X. Yan and Z. Guo, J. Phys. Chem. C, 2014, 118, 8262–8270 CAS.
  36. A. Diaz, J. Photochem. Photobiol., A, 1990, 53, 141–167 CrossRef.
  37. M. Shukla, N. Srivastava and S. Saha, J. Mol. Struct., 2012, 1021, 153–157 CrossRef CAS.
  38. S. Trassl, G. Motz, E. Rössler and G. Ziegler, J. Am. Ceram. Soc., 2002, 85, 239–244 CrossRef CAS.
  39. V. Di Noto, E. Negro, K. Vezzù, L. Toniolo and G. Pace, Electrochim. Acta, 2011, 57, 257–269 CrossRef CAS.
  40. V. Di Noto, E. Negro, S. Polizzi, K. Vezzù, L. Toniolo and G. Cavinato, Int. J. Hydrogen Energy, 2014, 39, 2812–2827 CrossRef CAS.
  41. H. Wang, Y. Wang, Z. Hu and X. Wang, ACS Appl. Mater. Interfaces, 2012, 4, 6827–6834 CAS.
  42. T. Aitchison, M. Ginic-Markovic, J. Matisons, G. Simon and P. Fredericks, J. Phys. Chem. C, 2007, 111, 2440–2446 CAS.
  43. L. Li, Z. Hu, Y. Yang, Z. Li, N. An and H. Wu, J. Phys. Chem. C, 2014, 118, 22865–22872 CAS.
  44. D. Yuan, T. Zhou, S. Zhou, W. Zou, S. Mo and N. Xia, Electrochem. Commun., 2011, 13, 242–246 CrossRef CAS.
  45. A. Bansal, X. Li, I. Lauermann and N. Lewis, J. Am. Chem. Soc., 1996, 118, 7225–7226 CrossRef CAS.
  46. A. Leela, M. Reddy, A. Srivastava, R. Gowda, H. Gullapalli, M. Dubey and M. Ajayan, ACS Nano, 2010, 4, 6337–6342 CrossRef PubMed.
  47. H. Peng, G. Ma, K. Sun, J. Mu, X. Zhou and Z. Lei, RSC Adv., 2015, 5, 12034–12042 RSC.
  48. M. Yang, Y. Zhong, J. Bao, X. Zhou, J. Wei and Z. Zhou, J. Mater. Chem. A, 2015, 3, 11387–11394 CAS.
  49. R. Qiang, Z. Hu, Y. Yang, Z. Li, N. An, X. Ren, H. Hu and H. Wu, Electrochim. Acta, 2015, 167, 303–310 CrossRef CAS.
  50. H. Huang, C. Huang, C. Hsieh and H. Teng, J. Mater. Chem. A, 2014, 2, 14963–14972 CAS.
  51. J. Wei, H. Liu, K. Niki, E. Margoliash and D. H. Waldeck, J. Phys. Chem. B, 2004, 108, 16912–16917 CrossRef CAS.
  52. H. Yue, D. H. Waldeck, K. Schrock, D. Kirby, K. Knorr, S. Switzer, J. Rosmus and R. Clark, J. Phys. Chem. C, 2008, 112, 2514–2521 CAS.
  53. P. Simon, Y. Gogotsi and B. Dunn, Science Magazine, 2014, 343, 1210–1211 CAS.
  54. X. Li, J. Shen, W. Sun, X. Hong, R. Wang, X. Yan, X. Zhao and X. Yan, J. Mater. Chem. A, 2015, 3, 13244–13253 CAS.
  55. Y. Zhang, Z. Hu, Y. Liang, Y. Yang, Y. An, N. An, Z. Li and H. Wu, J. Mater. Chem. A, 2015, 3, 15057–15067 CAS.
  56. Z. Algharaibeh and P. Pickup, Electrochem. Commun., 2011, 13, 147–149 CrossRef CAS.
  57. Z. Fan, J. Yan, T. Wei, L. Zhi, G. Ning, T. Li and F. Wei, Adv. Funct. Mater., 2011, 21, 2366–2375 CrossRef CAS.
  58. Y. Peng, T. Wu, C. Hsu, S. Li, M. Chen and C. Hu, J. Power Sources, 2014, 272, 970–978 CrossRef CAS.

Footnote

Electronic supplementary information (ESI) available: The dispersion, Brunauer–Emmett–Teller (BET) and hydrophilicity measurements of HCNTs and MWCNTs, Table 1, FTIR spectrum of NHC, the C 1s and O 1s spectra, nitrogen adsorption/desorption isotherms of nitrogen-doped heterostructure carbon, electrochemical characterization of TCBQ–NHC, AQ–NHC with different mass ratios and electrochemical characterization of AQ–HCNTs. See DOI: 10.1039/c6ra07923g

This journal is © The Royal Society of Chemistry 2016
Click here to see how this site uses Cookies. View our privacy policy here.