
Co-cultivation of Synechocystis salina and Pseudokirchneriella subcapitata under varying phosphorus concentrations evidences an allelopathic competition scenario†
A. L. Gonçalvesa,
A. C. Abreua,
A. Coqueirob,
A. Gasparc,
F. Borgesc,
Y. H. Choib,
J. C. M. Piresa and
M. Simões*a
aLEPABE, Departamento de Engenharia Química, Faculdade de Engenharia, Universidade do Porto, Rua Dr. Roberto Frias, 4200-465 Porto, Portugal. E-mail: mvs@fe.up.pt; Fax: +351 22 508 1449; Tel: +351 22 508 1654
bNatural Products Laboratory, Institute of Biology, Leiden University, Leiden, The Netherlands
cCIQUP, Department of Chemistry and Biochemistry, Faculty of Sciences, University of Porto, Rua do Campo Alegre s/n, 4169-007, Porto, Portugal
First published on 6th June 2016
Abstract
Microalgae and cyanobacteria have received ample attention in the last few decades due to their environmental and biotechnological applications. Co-cultures of these microorganisms may present benefits particularly on wastewater bioremediation and biomass production. However, the understanding on the interactions between photosynthetic microorganisms is still in an early stage of knowledge. In this line, the aim of the present study was the evaluation of the growth dynamics of co-cultures of a cyanobacterium, Synechocystis salina, and a microalga, Pseudokirchneriella subcapitata, under low phosphate-phosphorus concentrations. Kinetic growth parameters were determined through the Monod and modified Gompertz models and evidence of allelochemical production was confirmed through metabolomic analysis of the supernatant obtained from the co-cultures using GC-MS and 1D-NMR. Kinetic growth parameters have shown that P. subcapitata was better adapted to grow under low phosphorus concentrations. Co-cultivation of these microorganisms did not influence P. subcapitata growth; however, S. salina growth was strongly inhibited. The modified Gompertz model has shown that growth inhibition of S. salina in co-cultures may be related to the activity of allelochemicals produced by P. subcapitata. This assumption was corroborated by the assessment of the antimicrobial potential of lactic acid (2-hydroxypropanoic acid), an organic acid identified in the supernatant from the co-cultures with growth inhibitory effects against S. salina.
1. Introduction
Microalgal/cyanobacterial culturing has been the focus of several research studies worldwide due to the huge biotechnological potential of these photosynthetic microorganisms.1,2 When growing autotrophically, microalgae and cyanobacteria perform photosynthesis converting CO2 (from the atmosphere or flue gas emissions) into organic carbon compounds, thus reducing CO2 accumulation in the atmosphere.3–6 Additionally, these microorganisms can assimilate nutrients, such as nitrogen and phosphorus species released into the environment and frequently found in wastewaters, meaning that they can be applied in wastewater treatment processes.7–10 Furthermore, microalgal/cyanobacterial biomass has other diverse attractive applications,1,11–13 particularly human food and animal feed, production of cosmetics, drugs, functional food and biofuels.Although the majority of research studies using microalgae and cyanobacteria refer to mono-cultures, several studies have reported the use of microalgal/cyanobacterial co-cultures for diverse applications14–16 namely: (i) biomass production and CO2 uptake in adverse conditions; (ii) pollutant removal from wastewaters; (iii) carbohydrate accumulation for biofuels production; (iv) production of high-valued secondary metabolites; and (v) bio-flocculation and biofilm formation. The use of co-cultures combining microorganisms presenting different metabolic activities and adapted to different environmental conditions results in the development of a robust system that can operate under different environmental conditions and different nutrient supplies.17–19 Therefore, important characteristics of these cultures include: (i) high tolerance to environmental fluctuations and to multiple nutrient sources; and (ii) resistance to invasion by other species. However, due to the huge number of possible combinations between these microorganisms, studies on multispecies growth are still in an early stage of knowledge.
Furthermore, the study of interactions between different microalgal species or between microalgae and cyanobacteria is of great importance to understand their behaviour in aquatic environments. Aquatic photoautotrophs often face severe competition for resources, either space, light or nutrients.15,20 In these competitive environments, microorganisms tend to produce secondary metabolites, known as allelochemicals. The biosynthesis pathways and mode of action of these compounds, also identified as the chemical ecology of microalgae, has received much attention in the last few years, due to their importance in natural products chemistry and in several biotechnological processes, such as bioremediation and wastewater treatment.14,21
Allelopathy is defined as the direct or indirect harmful effect of one species on another through the production of chemicals released to the environment. It occurs essentially under stress situations, such as nutrient limitation. Target organisms might be more susceptible to allelochemicals under stress, and/or donor organisms might induce or increase the production of allelopathically active compounds in such conditions.20,21 For example, polyphenolic compounds produced by some organisms interfere with alkaline phosphatase, an exoenzyme used by several algae and cyanobacteria to overcome phosphorus limitation.20
To better understand the behaviour of photosynthetic organisms in aquatic environments, mathematical models have been developed to describe microalgal/cyanobacterial growth.22,23 The majority of these models are mainly applied to mono-cultures and in laboratory environments.24 Therefore, these type of models need to be adapted to allow their application to more complex systems, such as co-cultures of photosynthetic microorganisms.
This study provides an experimental and mathematical approach towards the understanding of the interactions between Synechocystis salina and Pseudokirchneriella subcapitata when exposed to a stress condition (low phosphate-phosphorus concentrations), trying to overcome the limitations of current mathematical models that can only be applied to microalgal/cyanobacterial mono-cultures. The specific aims of this study were: (i) to characterize the growth dynamics of mono- and co-cultures of these microorganisms when grown under limiting phosphorus concentrations; (ii) to establish a mathematical model able to describe the behaviour of these microorganisms in mono- and co-cultures; and (iii) to evaluate possible allelopathic interactions between these microorganisms. Phosphorus is one of the most important macronutrients for microalgae and cyanobacteria, as this nutrient is used for the synthesis of proteins, nucleic acids and phospholipids.25,26 Accordingly, microalgal/cyanobacterial cultures were supplied with low concentrations of this nutrient to evaluate possible growth competition between the studied microorganisms. Selection of the microorganisms integrating the co-cultures is a critical step. One possible alternative is to combine, for example, photoautotrophs and mixotrophs, ammonia and nitrate users, or marine and freshwater, aiming to improve both biomass productivities and the resilience of the co-culture.18 In this study, a marine cyanobacterium, S. salina, was co-cultured with a freshwater microalga, P. subcapitata. Selection of a marine microorganism was based on the following factors:18 (i) marine microalgae or cyanobacteria are more resilient to salinity changes and can be cultured in freshwater; and (ii) the high productivities observed in marine coastal waters, even when submitted to considerable salinity and nutrient oscillations, suggest that these microorganisms may be effectively used for biomass production using wastewaters as culture medium. P. subcapitata is a green microalga that has shown to easily adapt to grow under low phosphorus concentrations.21 Additionally, several authors have reported the use of both S. salina and P. subcapitata a wide variety of biotechnological applications, such as wastewater treatment27 and synthesis of bioactive compounds.18
2. Materials and methods
2.1. Microorganisms and culturing conditions
S. salina LEGE 06079 was obtained from the Laboratory of Ecotoxicology, Genomic and Evolution (LEGE) – CIIMAR (Centre of Marine and Environmental Research of the University of Porto, Porto, Portugal) and P. subcapitata 278/4 was obtained from the Culture Collection of Algae and Protozoa (CCAP, Scotland, UK). Stock solutions of these microorganisms were prepared in OECD test medium (Organisation for Economic Co-operation and Development28), a synthetic medium commonly used for microalgal/cyanobacterial growth.29–31 Culture medium was sterilized by autoclaving at 121 °C for 15 min. Cultures were incubated in 500 mL flasks at room temperature (25 ± 2 °C), under continuous exposure to fluorescent light with irradiance of approximately 72 μE m−2 s−1. Atmospheric air (filtered through 0.22 μm cellulose acetate membranes, Orange Scientific, Braine-l'Alleud, Belgium) was bubbled at the bottom of the flasks to promote agitation.2.2. Mono- and co-cultures growth under different phosphorus concentrations
Batch experiments with mono- and co-cultures were performed to study the influence of low phosphate-phosphorus (KH2PO4, Sigma-Aldrich, St. Louis, MO, USA) concentrations (1.50 to 24.0 × 10⁻³ mg L−1 of KH2PO4, which corresponds to 0.341 to 5.46 × 10⁻³ mgP L−1 of phosphate-phosphorus) on S. salina and P. subcapitata growth dynamics. Selection of this concentration range was based on the one reported by Fergola et al.,21 when evaluating allelopathic competition between Chlorella vulgaris and P. subcapitata. After an acclimation period of seven days under these concentrations, microorganisms were cultured for twelve days in 500 mL flasks (working volume of 400 mL), with an initial cell concentration of about 1.0 to 2.0 × 10⁶ cells per mL. Other growth conditions, such as light, temperature and aeration, were similar to those previously described. Two independent experiments were performed for each studied condition.2.3. Determination of S. salina and P. subcapitata growth parameters
Specific growth rates (μ, h−1) were determined by the evaluation of cell concentration within the cultivation time. These assays were performed in duplicate using a Neubauer counting chamber (Marienfeld, Lauda-Königshofen, Germany) and a Leica DM LB (Leica Microsystems, Wetzlar, Germany) microscope. The relationship between cell and biomass concentrations was obtained by determination of cell dry weight of both microorganisms for different cell concentrations and established through linear regression (R2 ≥ 0.995; data not shown). Specific growth rates were determined according to eqn (1):32
 | (1) |
Average biomass productivities (P, mg L−1 h−1) were calculated from the variation in biomass concentration within the cultivation time, as shown in eqn (2):32,33
 | (2) |
2.4. Kinetic modelling of specific growth rates from mono- and co-cultures
Specific growth rates determined for each phosphate-phosphorus concentration assessed (S, mgP L−1) were used to determine the kinetic parameters μmax (maximum specific growth rate, h−1) and KS (half saturation constant, mgP L−1), according to the Monod model:34
 | (3) |
The use of the Monod model to predict microalgal and cyanobacterial growth in response to varying phosphorus concentrations was selected based on previous reports describing the effective use of this model to evaluate phytoplankton growth kinetics.35–37
2.5. Kinetic modelling of allelopathic-based competition in co-cultures
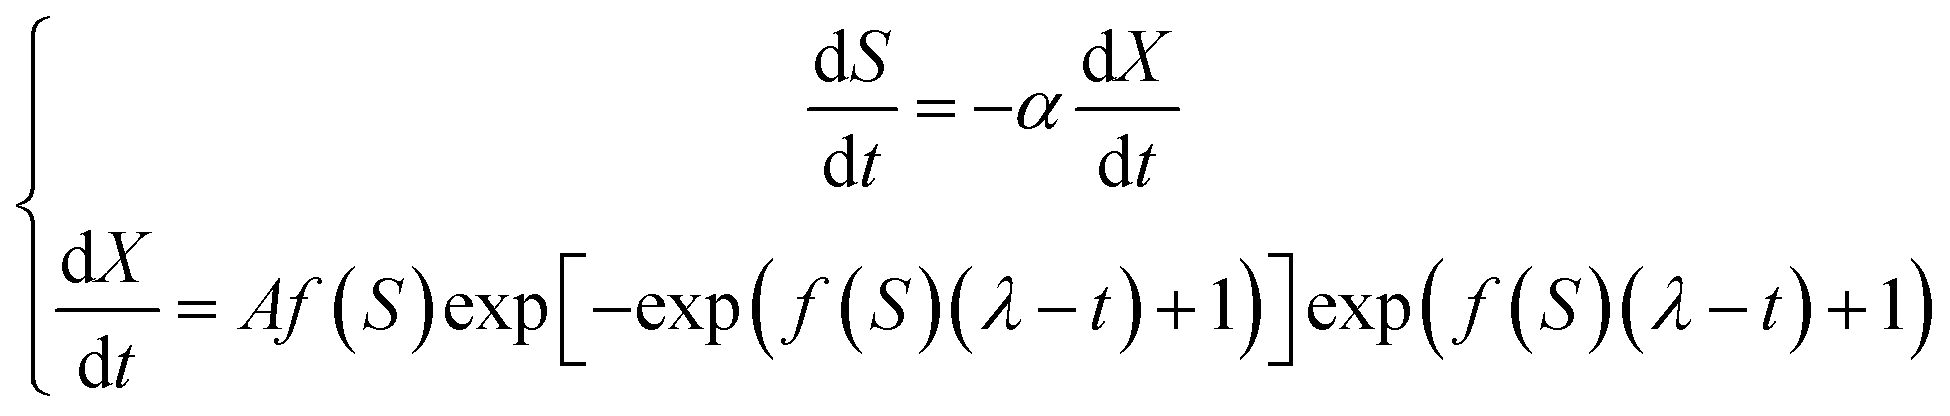
As the kinetic growth parameters determined through the Monod model have shown that the growth of S. salina in co-cultures may be limited by other factors rather than nutrient limitation, the growth of both microorganisms in mono- and co-cultures was evaluated using a modified version of the Gompertz model:38
y = a![[thin space (1/6-em)]](https://www.rsc.org/images/entities/char_2009.gif) exp[−exp(b − ct)] exp[−exp(b − ct)]
| (4) |
|
X = Aexp[−exp(μmax(λ − t) + 1)]
| (5) |
 | (6) |
As experimental data has shown that the growth of S. salina in co-cultures was strongly influenced by the presence of P. subcapitata, the model was adapted by including the parameters γ and β proposed by Fergola et al.21 Therefore, it was assumed that the microalga produced allelochemicals towards the cyanobacterium and that the specific growth rate of the cyanobacterium decreased for increasing concentrations of allelochemicals, undergoing a function of type:
| μ1(S) = f1(S)e−γX2 | (7) |
| μ2(S) = f2(S)(1 − β) | (8) |
The modified Gompertz model established in eqn (5), as well as the assumptions expressed in eqn (7) and (8), resulted in a three-equation system, which was used to model the phosphorus uptake and the growth of both S. salina and P. subcapitata in co-cultures:
 | (9) |
The parameters λ1, λ2, A1 and A2, previously determined for mono-cultures, were applied in this system to allow the determination of γ and β. Integration of these equations was also performed using the fourth-order Runge–Kutta method.42
The model fits of the Monod and modified Gompertz models were obtained through nonlinear regression techniques and the estimated parameters were determined using an iterative procedure that minimizes the sum of squared residuals. The quality of the model fits was evaluated by calculating the performance indexes described by Queiroz et al.:43 (i) root mean squared error (RMSE); (ii) standard error of prediction (% SEP); (iii) bias factor (Bf); and (iv) accuracy factor (Af) (see ESI, File S2†).
2.6. Analytical methods for allelochemicals identification
Instrumentation. GC-MS analysis was performed on an Agilent Technologies 7890A gas chromatograph coupled to a 5975C mass selective detector (Agilent Technologies, Palo Alto, CA, USA). The mass spectra were obtained by electron ionization at 70 eV.
Chromatographic conditions. DB-5 capillary column (cross-linked, 5% diphenyl, 95% dimethyl polysiloxane, 30 m × 0.25 mm × 0.25 μm, Agilent Technologies Inc., Santa Clara, CA, USA). Helium was used as the carrier gas at a flow rate of 1 mL min−1. The injection volume was 1 μL and split ratio was 20
:1. The oven temperature was increased to 50 °C and held at this temperature for 2 min. Then, temperature was raised to 250 °C at a rate of 8 °C min−1, to 300 °C at a rate of 3 °C min−1 and to 310 °C at a rate of 3 °C min−1. Total run time was 47 min.
Data processing. Registered peaks were identified by comparison with the mass spectra available in the National Institute of Standards and Technology (NIST) library.
Derivatization conditions. An aliquot of the sample (2.5 mg) was transferred into a vial and 75 μL of pyridine followed by 75 μL of N,O-bis(trimethylsilyl)trifluoroacetamide (Alfa Aesar, Ward Hill, MA, USA) containing 1% trimethyl chlorosilane was added. The derivatization was allowed to occur, firstly, at 60 °C for 1 h and then at 40 °C for 30 min.
Instrumentation. NMR spectra were recorded at room temperature on a 600 MHz DMX-600 spectrometer (Brucker, Karlsruhe, Germany) operating at a proton NMR frequency of 600.13 MHz. Methanol-d4 was used as the internal lock. The resulting spectra were manually phased, baseline corrected and calibrated to the internal standard, trimethylsilylpropionic acid sodium salt at δ 0.0 using TOPSPIN software (version 2.0, Bruker).
Sample preparation. The lyophilized material was placed in a 1.5 mL microtube and dissolved in 1 mL of a mixture (1
:1) containing methanol-d4 and KH2PO4 buffer (pH 6.0) dissolved in D2O containing 0.29 mM 3-(trimethylsilyl)propionic acid sodium salt (Sigma Aldrich, St. Louis, MO, USA). The mixture was vortexed at room temperature for 1 min, ultrasonicated for 15 min in a Branson 5510E-MT ultrasonic cleaner (Branson Ultrasonics, Danbury, CT, USA) and centrifuged at 17000g for 20 min in a Thermo Scientific Heraeus Pico 17 centrifuge (Fischer Scientific, Landsmeer, Netherlands). An aliquot (0.3 mL) of the supernatant was transferred to a 3 mm NMR glass tube and analysed.
Data processing. The signals detected in the spectra were analysed by spectral patterns and intensities. After statistical analysis, compounds were identified by comparison of spectral patterns of enrichment and depletion found in the following metabolomic database libraries: Chenomx NMR Suite (Chenomx Inc.) and Leiden University – Natural Products Laboratory (private).
2.7. Evaluation of the inhibitory activity of identified allelochemicals
After analysing co-cultures medium, some allelochemicals, particularly organic acids, were selected (2-hydroxypropanoic acid (5), butanedioic acid (16), 4-aminobutanoic acid (21) and 2,3,4-trihydroxybutanoic acid (22)) to assess their growth inhibitory potential against S. salina and P. subcapitata. Stock solutions of the selected organic acids, obtained from Sigma Aldrich (St. Louis, MO, USA), were prepared in sterilized distilled water at a concentration of 1000 μg mL−1.The growth inhibition caused by the selected organic acids was evaluated according to the Bauer et al.46 disc diffusion method. Suspensions of S. salina and P. subcapitata in the exponential growth phase were harvested, washed twice and resuspended in saline solution (0.85% w/v NaCl) to obtain a final concentration of about 5.0 × 10⁶ cells per mL. The suspensions were seeded in Petri dishes (90 mm diameter) containing modified Bold's Basal Medium24 supplemented with agar. Sterile filter paper discs (6 mm diameter) impregnated with approximately 1 mg of the organic acid solutions (1000 μg mL−1) were placed in Petri dishes. Afterwards, these Petri dishes were incubated for one week at room temperature under continuous light supply (72 μE m−2 s−1). The clear zones around the discs were recorded. Three independent experiments were performed.
2.8. Statistical analysis
Results were expressed as the mean value ± standard error of the mean. Statistical analysis of experimental data were carried out at a significance level of 0.05 using paired-samples t-test from the statistical software SPSS 22.0 (SPSS Inc., Chicago, IL, USA).3. Results and discussion
3.1. Influence of phosphorus concentrations on S. salina and P. subcapitata growth parameters
Specific growth rates and average biomass productivities determined for mono- and co-cultures of S. salina and P. subcapitata grown under different phosphate-phosphorus concentrations are presented in Table 1 (the respective growth curves are presented in ESI, File S3†). In general, higher specific growth rates were observed for increasing phosphorus concentrations (p < 0.05). These results are in agreement with those reported by Litchman et al.47 for the microalgae Nitzschia sp. and Sphaerocystis schroeteri and the cyanobacterium Phormidium luridum. Specific growth rates of P. subcapitata were significantly higher (p < 0.05) than those of S. salina in both mono- and co-cultures. In mono-cultures, specific growth rates for the microalga ranged from (0.821 ± 0.115) × 10−2 to (2.87 ± 0.13) × 10−2 h−1, while for the cyanobacterium ranged from (0.296 ± 0.071) × 10−2 to (1.59 ± 0.20) × 10−2 h−1. Lower specific growth rates determined for S. salina suggest that low phosphorus concentrations favour the growth of P. subcapitata. Similar orders of magnitude were described for two different strains of the cyanobacterium Trichodesmium sp. grown under phosphate-phosphorus concentrations ranging from 0 to 20 μM.48 No significant differences (p > 0.05) were found on the specific growth rates determined for P. subcapitata grown in mono- and co-cultures. On the other hand, specific growth rates of S. salina in co-cultures were statistically lower (p < 0.05) than those determined in mono-cultures. These results indicate that co-cultivation with P. subcapitata is prejudicial to cyanobacterial growth. For diverse phosphorus concentrations higher average biomass productivities were determined for the highest nutrient concentrations. Additionally, average biomass productivities determined for P. subcapitata (ranging between (0.641 ± 0.134) × 10−2 and (2.54 ± 0.08) × 10−2 mg L−1 h−1) were statistically higher (p < 0.05) than those determined for S. salina (ranging between (0.119 ± 0.032) × 10−2 and (0.413 ± 0.028) × 10−2 mg L−1 h−1). Comparing mono- and co-cultures, average biomass productivities determined for both S. salina and P. subcapitata grown in mono-cultures were higher than those determined in co-cultures. These results indicate that in co-cultures, lower phosphorus availability leads to lower average biomass productivities, proposing the inadequacy of these co-cultures when large biomass amounts are required. Average biomass productivities determined in mono- and co-cultures of S. salina presented a similar behaviour to the one observed for specific growth rates. In P. subcapitata cultures, average biomass productivities contrast with specific growth rate values, which have shown to be similar (p > 0.05) in both mono- and co-cultures. Inhibitory growth effects in co-cultures of microalgae has already been reported in the literature. For example, Solé et al.40 have reported growth inhibition of Heterocapsa triquetra when co-cultured with Chrysocromulina polylepis. The mechanisms involved in the inhibitory effects of C. polylepis remain unknown.| S (×10−3 mgP L−1) | Mono-cultures | Co-cultures | |||
|---|---|---|---|---|---|
| S. salina | P. subcapitata | S. salina | P. subcapitata | ||
| a Values are presented as the mean ± standard error of the mean of two independent experiments. | |||||
| μ (×10−2 h−1) | 0.341 | 0.296 ± 0.071 | 1.02 ± 0.19 | 0.650 ± 0.110 | 0.429 ± 0.082 |
| 0.683 | 0.638 ± 0.119 | 0.821 ± 0.115 | 0.250 ± 0.015 | 1.10 ± 0.15 | |
| 1.37 | 0.758 ± 0.245 | 1.99 ± 0.03 | 0.275 ± 0.058 | 2.26 ± 0.38 | |
| 2.73 | 0.892 ± 0.216 | 2.87 ± 0.13 | 0.475 ± 0.029 | 2.43 ± 0.44 | |
| 5.46 | 1.59 ± 0.20 | 2.82 ± 0.40 | 1.21 ± 0.14 | 2.69 ± 0.36 | |
| P (×10−2 mg L−1 h−1) | 0.341 | 0.127 ± 0.027 | 0.828 ± 0.318 | 0.154 ± 0.060 | 0.641 ± 0.134 |
| 0.683 | 0.136 ± 0.072 | 0.952 ± 0.022 | 0.119 ± 0.032 | 0.668 ± 0.211 | |
| 1.37 | 0.191 ± 0.033 | 1.97 ± 0.10 | 0.142 ± 0.022 | 1.38 ± 0.04 | |
| 2.73 | 0.202 ± 0.037 | 2.28 ± 0.01 | 0.182 ± 0.013 | 2.20 ± 0.08 | |
| 5.46 | 0.413 ± 0.028 | 2.54 ± 0.08 | 0.243 ± 0.031 | 2.31 ± 0.05 | |
3.2. Kinetic modelling of specific growth rates from mono- and co-cultures
Specific growth rates obtained for the different phosphate-phosphorus concentrations were used to establish a model fit (Fig. 1) according to the hyperbolic Monod function (eqn (3)) and to determine the associated kinetic growth parameters (Table 2). The quality of the model fits was evaluated through the performance indexes presented in Table 2. The low values determined for RMSE and % SEP as well as Bf and Af values of approximately 1 have shown that the models are able to accurately describe the relationship between specific growth rates and phosphorus concentrations in the culture medium. As phosphorus concentration increases, there is an increase in specific growth rates until a certain concentration, where this kinetic parameter remains approximately constant (Fig. 1). Similar results were obtained for P. subcapitata and Trichodesmium sp. in the studies performed by Fergola et al.21 and Fu et al.,48 respectively. The maximum specific growth rates determined for P. subcapitata in mono- and co-cultures were not statistically different (p > 0.05). However, they were significantly lower (p < 0.05) for S. salina, suggesting that low phosphorus concentrations can be a growth limiting factor to this microorganism. Additionally, μmax determined for S. salina grown in co-cultures was statistically lower (p < 0.05), meaning that these conditions favoured the growth of P. subcapitata. Lower KS values obtained for the microalga indicate that this organism is better adapted to uptake phosphate-phosphorus supplied at low concentrations. On the other hand, higher KS values estimated for S. salina indicate that the growth of this strain may be limited by phosphorus concentration. However, half saturation constant determined for the cyanobacterium in co-cultures (1.57 ± 0.26 × 10⁻³ mgP L−1) was statistically lower (p < 0.05) than the one obtained for mono-cultures (2.45 ± 0.40 × 10⁻³ mgP L−1), indicating that the growth of S. salina in co-cultures may be limited by other factors rather than phosphorus limitation. | ||
| Fig. 1 Model fit of the Monod model to the experimental data: (A) S. salina grown in mono-cultures; (B) S. salina grown in co-cultures; (C) P. subcapitata grown in mono-cultures; (D) P. subcapitata grown in co-cultures. Dashed lines represent the predicted values obtained through the Monod model. | ||
| Mono-cultures | Co-cultures | |||
|---|---|---|---|---|
| S. salina | P. subcapitata | S. salina | P. subcapitata | |
| a Values are presented as the mean ± standard error of the mean of two independent experiments. μmax, maximum specific growth rate (×10−2 h−1); KS, half saturation constant, (mgP L−1); RMSE, root mean squared error (×10−2 h−1); % SEP, standard error of prediction; Bf, bias factor; Af, accuracy factor. | ||||
| μmax (×10−2 h−1) | 2.13 ± 0.56 | 3.75 ± 0.71 | 0.932 ± 0.198 | 3.47 ± 0.59 |
| KS (×10−3 mgP L−1) | 2.45 ± 0.40 | 1.32 ± 0.67 | 1.57 ± 0.26 | 1.22 ± 0.57 |
| RMSE (×10−2 h−1) | 0.14 | 0.29 | 0.321 | 0.26 |
| % SEP | 17 | 16 | 56 | 14 |
| Bf | 0.943 | 1.01 | 0.802 | 1.11 |
| Af | 1.17 | 1.21 | 1.71 | 1.21 |
3.3. Kinetic modelling of allelopathic-based competition in co-cultures
As the kinetic parameters determined through the model fit of the Monod function suggested that the growth of the cyanobacterium in co-cultures may be inhibited by other factors rather than phosphorus limitation, a new model was established to describe the behaviour of both microorganisms (in mono- and co-cultures). The new model, which was based on the Gompertz model, takes into account the hypothesis that S. salina growth inhibition can be related to the presence of allelochemicals excreted by P. subcapitata. The use of the Gompertz model to describe microalgal and bacterial growth has already been reported in the literature.22,39,40,49 In this study, the referred model was adapted by assuming that S. salina growth decreased in response to increased concentrations of the allelochemicals produced by P. subcapitata and that P. subcapitata presented a fraction of potential growth devoted to the production of allelochemicals. In fact, lower biomass productivities determined for this microalga in co-cultures suggest that unlike mono-cultures, nutrients removal was devoted to the production of other molecules, rather than microalgal biomass. The excretion of metabolic molecules and harmful chemicals presenting inhibitory effects towards cyanobacteria or microalgae in co-cultures has already been reported in the literature.20,21,50,51 Moreover, Bittencourt-Oliveira et al.50 suggested that nutrient limitation is not the only factor that can explain the prevalence of a given strain in co-cultures. The presence of allelochemicals can also regulate the interaction of these microorganisms.50Fig. 2A and C show the modified Gompertz model fits obtained for mono-cultures of S. salina and P. subcapitata, respectively. Differences in initial biomass concentrations between both microorganisms were related to the different cell densities of the microorganisms, as all the cultures were inoculated with the same initial cellular concentration (between 1 and 2 × 10⁶ cells per mL). The closeness of the fits obtained through the modified Gompertz model can be evaluated by observing the model curves superimposed on the experimental data, which means that the modified Gompertz model correctly describes the behaviour of the selected microorganisms. In fact, low RMSE and % SEP values were determined for all the model fits (Table 3). In addition, the values of Bf and Af close to one (Table 3) also confirm the existence of a good correlation between estimated values and experimental data.
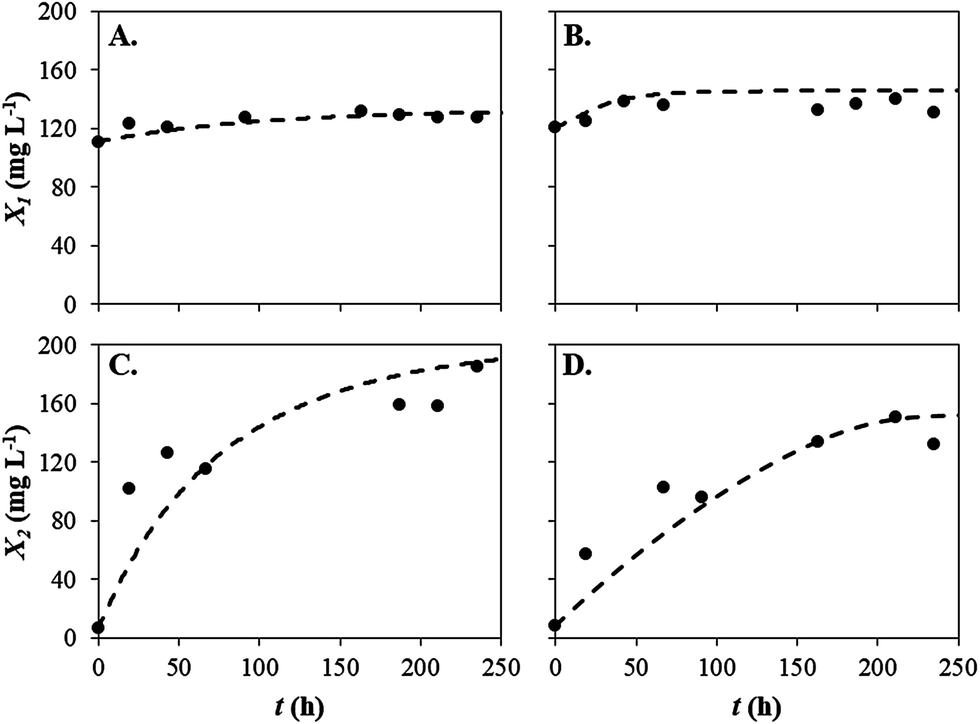 | ||
| Fig. 2 Model fit of the modified Gompertz model to the experimental data: (A) S. salina grown in mono-cultures; (B) S. salina grown in co-cultures; (C) P. subcapitata grown in mono-cultures; (D) P. subcapitata grown in co-cultures. Dashed lines represent the predicted values obtained through the modified Gompertz model. | ||
| Mono-cultures | Co-cultures | |||
|---|---|---|---|---|
| S. salina | P. subcapitata | S. salina | P. subcapitata | |
| a λ, lag time (h); A, maximum biomass concentration or upper asymptote value (mg L−1); γ, measure of the inhibitory effect of the allelochemicals produced by P. subcapitata; β, fraction of potential growth devoted to the production of allelochemicals; RMSE, root mean squared error (mg L−1); % SEP, standard error of prediction; Bf, bias factor; Af, accuracy factor. | ||||
| λ (h) | <0 | <0 | — | — |
| A (mg L−1) | 400 | 418 | — | — |
| γ | — | — | 33.0 | |
| β | — | — | 0.710 | |
| RMSE (mg L−1) | 4 | 30 | 9 | 17 |
| % SEP | 3 | 22 | 7 | 17 |
| Bf | 0.990 | 0.886 | 1.06 | 0.880 |
| Af | 1.02 | 1.22 | 1.06 | 0.18 |
Biological parameters, such as lag time, λ, and upper asymptote value, A, determined for S. salina and P. subcapitata grown in mono-cultures are shown in Table 3. Values of lag time determined for these microorganisms were negative, indicating that both cultures were acclimated to the experimental conditions. These results were not surprising since both S. salina and P. subcapitata were acclimated to phosphorus concentrations within the range used in this study prior to the mono- and co-culture experiments. Additionally, low λ values, approximately 4–5 h, or even negative values were obtained in the studies performed by Çelekli et al.39 Regarding maximum biomass concentrations, A, the values determined for S. salina and P. subcapitata were 400 and 418 mg L−1, respectively. These maximum values indicate the biomass concentration achieved when stationary growth phase was reached. Both microorganisms reached the stationary growth phase after 67 h of culturing.
Fixing λ and A values determined for mono-cultures, the parameters β and γ were determined according to eqn (9). Fig. 2B and D show the growth curves obtained for S. salina and P. subcapitata in co-cultures and the respective model fits. The positive parameter value obtained for the measure of the inhibitory effect of the allelochemicals produced by P. subcapitata, γ, confirms the hypothesis of growth inhibition of S. salina by allelochemicals released by the microalga (Table 3). Although the production of allelochemicals by this microalga is not documented in the literature, it has already been reported for other freshwater species, such as C. vulgaris,52 Botryococcus braunii,53 S. obliquus54 and Chlamydomonas reinhardtii.55 In the study performed by Fergola et al.,21 γ value estimated for the assessment of the inhibitory effect of C. vulgaris towards P. subcapitata was 7.81. The fraction of potential growth devoted to allelochemicals production, represented by β, was estimated to be 0.710, which indicates that a large amount of phosphate-phosphorus present in the culture medium is used by P. subcapitata to produce allelochemicals. These results corroborate the low average biomass productivities determined for P. subcapitata grown in co-cultures. According to Fergola et al.,21 if 0 < β < 1, the competition is driven towards the extinction of the strain that presents lower biomass productivities. In this study, biomass productivities determined for S. salina grown in co-cultures were lower than those determined for P. subcapitata, meaning that its growth inhibition was promoted by allelochemicals produced by the co-cultivated microalga.
3.4. Co-cultures medium analysis and evaluation of the inhibitory activity of identified allelochemicals
The analysis of the supernatant of S. salina with P. subcapitata co-cultures by GC-MS and 1D-NMR demonstrated the presence of several metabolites, such as alkaloids, amino acids, organic acids, sugars (mono- and disaccharides) and alcohols (see ESI, File S4†). Excretion of this type of compounds in microalgae and cyanobacteria polycultures has already been described.56–62Four organic acids (2-hydroxypropanoic acid – 5, butanedioic acid – 16, 4-aminobutanoic acid – 21 and 2,3,4-trihydroxybutanoic acid – 22), identified from GC-MS analysis (Fig. 3), were selected for an in-depth growth inhibitory study. In fact, several studies have pointed out that this type of organic acids can act as effective antimicrobial agents;63–67 therefore it was decided to inspect their effects on the growth of each microorganism. Accordingly, their inhibitory potential towards S. salina and P. subcapitata was evaluated (see ESI, File S5†). Results have shown that all the organic acids tested had no inhibitory effect on the growth of P. subcapitata and S. salina, except 2-hydroxypropanoic acid (5). Lactic acid (2-hydroxypropanoic acid (5)) displayed an inhibitory growth activity on S. salina, but not on P. subcapitata, suggesting the role of this organic acid as an allelochemical able to modify the growth of S. salina. This result corroborates the data obtained with the modified Gompertz model, by which it was proposed that the inhibition of S. salina growth was a consequence of the presence of allelochemicals excreted by P. subcapitata.
 | ||
| Fig. 3 GC-MS chromatogram of the co-cultures medium of S. salina and P. subcapitata. Peaks 5, 16, 21 and 22 correspond to 2-hydroxypropanoic acid, butanedioic acid, 4-aminobutanoic acid and 2,3,4-trihydroxybutanoic acid, respectively. The mass spectra correspond to the organic acids silane derivatives. | ||
4. Conclusions
The behaviour of S. salina and P. subcapitata under low phosphate-phosphorus concentrations was assessed by studying their growth in mono- and co-cultures. For increasing phosphorus concentrations, higher average biomass productivities were determined for both microorganisms. However, lower values were determined in co-cultures. Regarding specific growth rates, values determined for both microorganisms were higher for increased phosphorus concentrations, being constant for higher nutrient concentrations. This behaviour was correctly described by the Monod model fitted to the experimental data. Higher specific growth rates were obtained for the microalga (both in mono- and co-cultures), indicating that this microorganism presents higher ability to uptake phosphorus supplied at low levels. Regarding S. salina, the specific growth rates determined in co-cultures were significantly lower than those obtained in mono-cultures. Data coming from the development of the modified Gompertz model suggested that growth inhibition of S. salina in co-cultures was related to the presence of allelochemicals produced by P. subcapitata. Metabolomic and antimicrobial analysis demonstrated that lactic acid (2-hydroxypropanoic acid) can be proposed as an allelochemical involved in growth inhibition of S. salina when co-cultured with P. subcapitata. This study provides new insights on allelochemical production by the freshwater microalga P. subcapitata and how they can influence the growth of other species, such as S. salina. This information can be very useful to maintain naturally-occurring species in natural lakes or ponds and in aquaculture. Additionally, this study proposes simple methods for the understanding of interactions involved in co-cultures.Acknowledgements
This work was financially supported by: Project POCI-01-0145-FEDER-006939 – Laboratory for Process Engineering, Environment, Biotechnology and Energy – LEPABE funded by FEDER funds through COMPETE2020 – Programa Operacional Competitividade e Internacionalização (POCI) – and by national funds through FCT – Fundação para a Ciência e a Tecnologia; Project 0687-Novomar-1-P; Scholarships SFRH/BD/88799/2012, SFRH/BD/84383/2012 and SFRH/BPD/66721/2009. Dr A. Coqueiro thanks Ciências sem fronteiras, CAPES Foundation, Ministry of Education of Brazil, for the scholarship. The authors also acknowledge CIIMAR (Centre of Marine and Environmental Research of the University of Porto), for providing the cyanobacterium Synechocystis salina LEGE 06079.References
- L. Brennan and P. Owende, Renewable Sustainable Energy Rev., 2010, 14, 557–577 CrossRef CAS.
- A. Demirbas, Appl. Energy, 2011, 88, 3541–3547 CrossRef CAS.
- D. Bilanovic, A. Andargatchew, T. Kroeger and G. Shelef, Energy Convers. Manage., 2009, 50, 262–267 CrossRef CAS.
- S.-H. Ho, C.-Y. Chen, D.-J. Lee and J.-S. Chang, Biotechnol. Adv., 2011, 29, 189–198 CrossRef CAS PubMed.
- R. Sayre, Bioscience, 2010, 60, 722–727 CrossRef.
- J. C. M. Pires, A. L. Gonçalves, F. G. Martins, M. C. M. Alvim-Ferraz and M. Simões, Mitigation and Adaptation Strategies for Global Change, 2013, 19, 1109–1117 CrossRef.
- N. C. Boelee, H. Temmink, M. Janssen, C. J. N. Buisman and R. H. Wijffels, Water Res., 2011, 45, 5925–5933 CrossRef CAS PubMed.
- J. B. K. Park, R. J. Craggs and A. N. Shilton, Bioresour. Technol., 2011, 102, 35–42 CrossRef CAS PubMed.
- I. Rawat, R. Ranjith Kumar, T. Mutanda and F. Bux, Appl. Energy, 2011, 88, 3411–3424 CrossRef CAS.
- A. Silva-Benavides and G. Torzillo, J. Appl. Phycol., 2012, 24, 267–276 CrossRef CAS.
- Q. Hu, in Handbook of Microalgal Culture: Biotechnology and Applied Phycology, ed. A. Richmond, Blackwell Science Ltd, Oxford, UK, 2004, ch. 12, pp. 268–271 Search PubMed.
- S. Singh, B. Kate and U. Banerjee, Crit. Rev. Biotechnol., 2005, 25, 73–95 CrossRef CAS PubMed.
- P. Spolaore, C. Joannis-Cassan, E. Duran and A. Isambert, J. Biosci. Bioeng., 2006, 101, 87–96 CrossRef CAS PubMed.
- A. D. Cembella, Phycologia, 2003, 42, 420–447 CrossRef.
- F. D. Hulot, P. J. Morin and M. Loreau, Oikos, 2001, 95, 231–238 CrossRef.
- S. R. Subashchandrabose, B. Ramakrishnan, M. Megharaj, K. Venkateswarlu and R. Naidu, Biotechnol. Adv., 2011, 29, 896–907 CrossRef CAS PubMed.
- S. Boonma, S. Chaiklangmuang, S. Chaiwongsar, J. Pekkoh, C. Pumas, T. Ungsethaphand, S. Tongsiri and Y. Peerapornpisal, Clean: Soil, Air, Water, 2014, 43, 761–766 CrossRef.
- E. Fouilland, Rev. Environ. Sci. Bio/Technol., 2012, 11, 1–4 CrossRef.
- K. R. Johnson and W. Admassu, J. Chem. Technol. Biotechnol., 2013, 88, 992–998 CrossRef CAS.
- E. M. Gross, Crit. Rev. Plant Sci., 2003, 22, 313–339 CrossRef.
- P. Fergola, M. Cerasuolo, A. Pollio, G. Pinto and M. DellaGreca, Ecol. Modell., 2007, 208, 205–214 CrossRef.
- A. Çelekli, M. Yavuzatmaca and H. Bozkurt, Bioresour. Technol., 2009, 100, 3625–3629 CrossRef PubMed.
- F. Mairet, O. Bernard, T. Lacour and A. Sciandra, Proceedings of the 18th World Congress of The International Federation of Automatic Control, Milano, Italy, 28 August–2 September 2011 Search PubMed.
- C. Zonneveld, Ecol. Modell., 1998, 113, 41–54 CrossRef.
- L. Barsanti and P. Gualtieri, Algae - Anatomy, Biochemistry and Biotechnology, CRC Press, USA, 2nd edn, 2006 Search PubMed.
- A. Kumar, S. Ergas, X. Yuan, A. Sahu, Q. Zhang, J. Dewulf, F. X. Malcata and H. Van Langenhove, Trends Biotechnol., 2010, 28, 371–380 CrossRef CAS PubMed.
- Q. Hu, P. Westerhoff and W. Vermaas, Appl. Environ. Microbiol., 2000, 66, 133–139 CrossRef CAS PubMed.
- OECD, Test Guideline 201, Organisation for economic co-operation and development, 2011 Search PubMed.
- A. Gonçalves, M. Simões and J. Pires, Energy Convers. Manage., 2014, 85, 530–536 CrossRef.
- B. Kolar, L. Arnuš, B. Jeretin, A. Gutmaher, D. Drobne and M. K. Durjava, Chemosphere, 2014, 115, 75–80 CrossRef CAS PubMed.
- I. Rodea-Palomares, K. Boltes, F. Fernández-Piñas, F. Leganés, E. García-Calvo, J. Santiago and R. Rosal, Toxicol. Sci., 2011, 119, 135–145 CrossRef CAS PubMed.
- P. Feng, Z. Deng, L. Fan and Z. Hu, J. Biosci. Bioeng., 2012, 114, 405–410 CrossRef CAS PubMed.
- E. Jacob-Lopes, C. H. G. Scoparo, L. M. C. F. Lacerda and T. T. Franco, Chem. Eng. Process., 2009, 48, 306–310 CrossRef CAS.
- J. Monod, Annu. Rev. Microbiol., 1949, 3, 371–394 CrossRef CAS.
- D. M. Di Toro, Ecol. Modell., 1980, 8, 201–218 CrossRef CAS.
- R. W. Sterner and J. P. Grover, Water Res., 1998, 32, 3539–3548 CrossRef CAS.
- L. Xin, H. Hong-ying, G. Ke and S. Ying-xue, Bioresour. Technol., 2010, 101, 5494–5500 CrossRef CAS PubMed.
- B. Gompertz, Philos. Trans. R. Soc. London, 1825, 115, 513–583 CrossRef.
- A. Çelekli, M. Balcı and H. Bozkurt, Bioresour. Technol., 2008, 99, 8742–8747 CrossRef PubMed.
- L. M. C. F. Lacerda, M. I. Queiroz, L. T. Furlan, M. J. Lauro, K. Modenesi, E. Jacob-Lopes and T. T. Franco, J. Pet. Sci. Eng., 2011, 78, 679–686 CrossRef CAS.
- Y. Chisti, Biotechnol. Adv., 2007, 25, 294–306 CrossRef CAS PubMed.
- S. C. Chapra and R. P. Canale, Numerical Methods for Engineers, McGraw-Hill Higher Education, New York, 6th edn, 2010 Search PubMed.
- M. I. Queiroz, M. O. Hornes, A. G. da Silva-Manetti and E. Jacob-Lopes, Appl. Energy, 2011, 88, 3438–3443 CrossRef CAS.
- F.-M. Li and H.-Y. Hu, Appl. Environ. Microbiol., 2005, 71, 6545–6553 CrossRef CAS PubMed.
- L. Ni, K. Acharya, X. Hao and S. Li, Chemosphere, 2012, 88, 1051–1057 CrossRef CAS PubMed.
- A. W. Bauer, M. D. K. Kirby, J. C. Sherria and M. Turck, Am. J. Clin. Pathol., 1966, 45, 493–506 CAS.
- E. Litchman, D. Steiner and P. Bossard, Freshwater Biol., 2003, 48, 2141–2148 CrossRef CAS.
- F.-X. Fu, Y. Zhang, P. R. F. Bell and D. A. Hutchins, J. Phycol., 2005, 41, 62–73 CrossRef CAS.
- M. Zwietering, I. Jongenburger, F. Rombouts and K. Van't Riet, Appl. Environ. Microbiol., 1990, 56, 1875–1881 CAS.
- M. C. Bittencourt-Oliveira, M. A. Chia, H. S. B. Oliveira, M. K. C. Araújo, R. J. R. Molica and C. T. S. Dias, J. Appl. Phycol., 2014, 27, 275–284 CrossRef.
- J. Leflaive and L. Ten-Hage, Freshwater Biol., 2007, 52, 199–214 CrossRef CAS.
- R. Pratt and J. Fong, Am. J. Bot., 1940, 27, 431–436 CrossRef CAS.
- I.-Z. Chiang, W.-Y. Huang and J.-T. Wu, J. Phycol., 2004, 40, 474–480 CrossRef CAS.
- X.-H. Jia, D.-J. Shi, R.-J. Kang, H.-M. Li, Y. Liu, Z.-Z. An, S.-S. Wang, D.-H. Song and G.-S. Du, in Photosynthesis. Energy from the Sun, Springer, 2008, pp. 1339–1342 Search PubMed.
- V. W. Proctor, Limnol. Oceanogr., 1957, 2, 123–139 CrossRef.
- R. A. Lewin, Can. J. Microbiol., 1956, 2, 665–672 CrossRef CAS.
- M. B. Allen, Arch. Mikrobiol., 1956, 24, 163–168 CAS.
- A. Mishra, K. Kavita and B. Jha, Carbohydr. Polym., 2011, 83, 852–857 CrossRef CAS.
- J. A. Hellebust, Limnol. Oceanogr., 1965, 10, 192–206 CrossRef.
- H. Fallowfield and M. Daft, British Phycological Journal, 1988, 23, 317–326 CrossRef.
- E. Granum, S. Kirkvold and S. M. Myklestad, Mar. Ecol.: Prog. Ser., 2002, 242, 83–94 CrossRef CAS.
- A. M. Waite, R. J. Olson, H. G. Dam and U. Passow, J. Phycol., 1995, 31, 925–933 CAS.
- Y.-W. In, J.-J. Kim, H.-J. Kim and S.-W. Oh, J. Food Saf., 2013, 33, 79–85 CrossRef.
- S. A. Ibrahim, H. Yang and C. W. Seo, Food Chem., 2008, 109, 137–143 CrossRef CAS PubMed.
- J. L. Thompson and M. Hinton, Br. Poult. Sci., 1997, 38, 59–65 CrossRef CAS PubMed.
- S. Doores, in Antimicrobials in Food, ed. P. M. Davidson, J. N. Sofos and A. L. Branen, CRC Press, Florida, USA, 2005, ch. 4, pp. 91–142 Search PubMed.
- C. B. Huang, Y. Alimova, T. M. Myers and J. L. Ebersole, Arch. Oral Biol., 2011, 56, 650–654 CrossRef CAS PubMed.
Footnote |
| † Electronic supplementary information (ESI) available. See DOI: 10.1039/c6ra07771d |
| This journal is © The Royal Society of Chemistry 2016 |