Cuprous oxide/titanium dioxide nanotube-array with coaxial heterogeneous structure synthesized by multiple-cycle chemical adsorption plus reduction method

Wen Zhu*abc, Baohe Chonga, Ke Qina, Li Guanb, Xianghui Houb and George Z. Chen*b
aState Key Laboratory of Materials Processing and Die & Mould Technology, Huazhong University of Science & Technology, Wuhan 430074, People's Republic of China
bFaculty of Engineering, University of Nottingham, Nottingham, NG7 2RD, UK. E-mail: George.Chen@nottingham.ac.uk; Wen.Zhu@nottingham.ac.uk
cResearch Institute of Huazhong University of Science & Technology in Shenzhen, Shenzhen Virtual University Park, Shenzhen 518000, People's Republic of China

Received 15th March 2016 , Accepted 8th June 2016

First published on 15th June 2016


Abstract

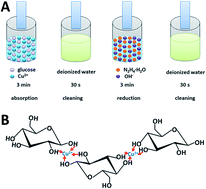
We report the formation and characterization of a cuprous oxide/titanium dioxide (Cu2O/TiO2) nanotube-array coaxial heterogeneous structure, which is supposed to have potential applications in photo-induced water decomposition and organic pollutant degradation. Such structure is formed by coating nano-particles of Cu2O onto titanium dioxide nanotube-array walls via multiple-cycle chemical adsorption plus reduction method (MC-CAR). The practical deposition technique employs a soaking step to separate the adsorption and reduction processes, thus enhancing the controllability of deposition rate and preventing the clogging of nanotube pores. The size of Cu2O nano-particles is adjusted by changing the glucose concentration in the reaction solutions. As a result, compact nano-particle film with sufficiently small crystal sizes is uniformly covered on the tube walls, resulting in the formation of coaxial heterogeneous structure. The detailed synthesis process and the surface morphology, structure, photoelectric properties, and hydrogen evolution ability of the Cu2O/TiO2 nanotube-array with coaxial heterogeneous structure are systematically investigated. The resulting film shows a stable hydrogen production rate of 3.1 mL cm−2 h−1, which can be targeted for energy application in relation with solar energy driven production of hydrogen from water.


Introduction

In recent years, significant technologies have been developed to control environmental pollution and solve the energy crisis. Photocatalytic technology is considered a promising pathway for low cost energy generation and efficient energy use with minimal environmental impact. The photocatalytic decomposition of water, which uses solar energy to split water to produce cheap hydrogen as the clean energy carrier, is believed to be able to help mitigate the crisis of fossil fuel depletion,1,2 while the photocatalytic degradation of toxic organic pollutants is recognized to be an inexpensive and feasible way to address the pressing environmental needs.3,4 The supporting photocatalytic materials with top performance are the key to achieve these goals.

Highly ordered nano-materials with ultra large specific surface areas, like vertically oriented titanium dioxide (TiO2) nanotube-arrays (NTAs), are becoming increasingly attractive for potential and versatile applications in energy fields.5,6 Large specific surface areas can increase the photo-absorption and the contact region between electrode and solution, making available a larger number of active reaction sites for chemical reactions to occur; while the vertically oriented array structure is helpful to establish efficient conduction channel, prompting photogenerated electrons and holes quickly arrived at the electrode surfaces to participate in the photocatalytic reaction.

However, TiO2 is a wide band gap semiconductor (Eg = 3.2 eV), and its reactivity is limited only in the UV region.7,8 Efforts to shift the band gap of TiO2 to the visible light response while maintain its excellent charge-transfer properties and photocorrosion stability have primarily focused on metal/non-metal ion doping9,10 and coupling with narrow band gap semiconductor.11,12 Sensitizing TiO2 NTAs with a narrow band gap semiconductor can result in the formation of heterogeneous structure and produce a novel photocatalyst with continuously changed band gap, thereby effectively enhancing the photoresponse. It was recently reported that cuprous oxide (Cu2O) can be used as a promising sensitizer due to its nontoxicity, low cost, and outstanding optical properties.13,14 Cuprous oxide is a typical narrow band gap semiconductor (Eg = 2.17 eV), and also has a favorable match of energy band structure with TiO2 in order to separate the photogenerated electron and hole.

Currently, the research of Cu2O/TiO2 compound semiconductor heterojunction focuses mainly on suspended particles or TiO2 nano-particle films.15,16 So far there are several interesting reports on using TiO2 NTAs to form Cu2O/TiO2 NTAs compound semiconductor heterojunctions.17,18 However, the photocatalytic activity of these composite heterojunctions needs improvement. The common methods for synthesis of Cu2O include electrochemical deposition,18,19 photoreduction20,21 and chemical bath deposition (CBD).22,23 In general, these methods cannot precisely control morphology and composition of the coating. For special highly structured TiO2 NTAs substrates, an accurate control of microstructure and composition of the coatings can play a critical role in determining the resultant photocatalytic activity. However, it has been proven that it is difficult to use some conventional methods to coat the special structured TiO2 NTAs substrates with a narrow band gap semiconductor. The lack of controlling microstructure and composition of the coating usually leads to the precipitation of the coating inside nanotubes or even plugging nanotubes and as a result reduces the specific surface area and adsorption capacity of the nanotubes.24,25 Several epitaxial methods, such as molecular beam epitaxy (MBE), atomic layer epitaxy (ALE), metal organic chemical vapour deposition (MOCVD), etc. seem to gain acceptance for integrating uniform thin films onto NTAs as they promote layer-by-layer growth and conformal deposition. However, these methods generally are performed in ultra-high vacuum and are thermal methods, achieving compound formation by controlling reactant fluxes and substrate temperature. Heating the reactants and NTAs would result in inter-diffusion of elements of adjacent layers and blur the interfaces. In addition, these epitaxial methods also encountered some problems such as expensive precursors, complicated process and devices, high temperature condition and even some toxic by-products. These shortcomings are limiting their industrial exploitation. Therefore, the development of fabrication methodology of multi-junction nano-materials coated with highly ordered structure remains possible future research focus.

Herein, a simple multiple-cycle chemical adsorption plus reduction method (MC-CAR) is developed to form Cu2O coating layer onto the TiO2 tube walls while minimizing deposition at the tube entrances, thus preventing pore clogging. In the practical deposition technique, the adsorption and reduction processes are separated by an intermediate soaking step that effectively reduced the reaction rate, resulting in the conformal deposition of Cu2O coating layer onto the TiO2 NTAs substrate. Furthermore, glucose as an available additive is employed to manipulate the microstructural and compositional properties of Cu2O coating layer. The effects of glucose content on the surface morphology and the crystal structure of Cu2O nanofilms on TiO2 NTAs substrates are investigated. As a result, coaxial heterogeneous structures within a homogeneous coating are obtained. Particularly, by restricting the number of cycles, the thickness of Cu2O coating layer can be precisely controlled. The controllability of the relevant geometric thickness of the Cu2O layer can reduce the distance that holes and electrons must travel in the coating layer to reach the electrolyte or underlying conducting substrate. This enables minimal charge-carrier recombination. This study also provides information on the hydrogen generation properties of the resulting Cu2O/TiO2 nanotube array with coaxial heterogeneous structure prepared using various glucose contents.

Experimental

Highly ordered TiO2 NTAs were fabricated on the surface of Ti foil (200 μm thick, 99.7 purity, Boxin metal materials Co., Ltd) by two-step anodization in an ethylene glycol solution containing 0.3 wt% NH4F and 3.0 vol% deionized H2O.26,27 The anodization was carried out in a two-electrode system composed of Ti foil as a working electrode and Pt foil as a counter electrode under constant potential (55 V) and temperature (27 °C). The first anodization took 20 minutes followed by two hours of annealing at 700 °C, after which a compact nanofilm composed of disorganized TiO2 rutile nanowire layer was formed on the Ti surface. The samples were then re-soaked into the reaction solution and were subjected to the subsequent anodization for 6 h to synthesize a very regular nanotubular structure. The secondly anodized samples were annealed again at 300 °C in muffle furnace for 2 h with a heating rate of 2 °C min−1 to transform the amorphous phase to anatase crystalline phase.

Cu2O coating layer was deposited onto TiO2 tube walls through a facile multiple-cycle chemical absorption plus reduction method (MC-CAR). Each CAR process involved two-step procedures composed of absorption-soaking plus reduction-soaking. Firstly, TiO2 NTAs were dipped into an aqueous solution that consisted of 0.1 M CuSO4 and glucose with two different contents (0.5 M and 1.0 M) for 3 min to ensure adequate absorption, and then were soaked with deionized water for 30 s to remove excessive CuSO4. Subsequently, the coated TiO2 NTAs substrates with Cu2+ monolayer were immersed into another aqueous solution containing 0.1 M N2H4 and 0.6 M NaOH, in which Cu2+ monolayer was reduced to Cu2O monolayer. The reduction process was followed by soaking with deionized water for 30 s again. The thickness of Cu2O coating was controlled by the number of CAR cycles. All the procedures above were operated at 40 °C in a thermostatic water bath. After the CAR cycles, the resulting Cu2O/TiO2 samples were dried at 100 °C in N2 stream for 2 h.

The morphologies of both pure TiO2 NTAs and Cu2O/TiO2 NTAs were investigated using a field emission scanning electron microscope (FESEM, Nova NanoSEM 450). X-ray diffraction (XRD, X'Pert PRO) and energy-dispersive X-ray spectrophotometry (EDX, Inca X-Max) were used to examine the crystalline structure and elemental composition. The optical absorption spectra of samples were recorded by UV-vis spectrophotometer (Lambda 35). Photocurrent activities were carried out in an electrochemical workstation (Corrtest™ CS350) using Pt foil as the counter electrode and saturated calomel electrode (SCE) as the reference electrode. A solar simulator (CHF-XM35-500 W) coupled to an AM 1.5G filter was employed as the light source to provide an illumination intensity of 100 mW cm−2. The electrolyte comprised of 0.5 M Na2SO4 and 20 mL ethylene glycol in 150 mL aqueous solution. The photocurrent density–voltage (JV) scan was performed from open circuit potential to 1.5 V (versus SCE) with a scan rate of 10 mV s−1 under illumination and the photocurrent was recorded. All the experiments were carried out under ambient conditions. The photoresponse measurements were carried out to understand the charge transport properties of the heterojunction electrode. The photoresponse was determined by potentiostatic (current vs. time, It) measurements under pulsed illumination. The photocurrent dynamics of the electrode were recorded according to the responses to sudden switching on and off the incident light with a pulse of 50 s at a bias voltage of 0 V (vs. SCE). For photo-electrocatalytic hydrogen evolution experiment, two-electrode configuration was used with Cu2O/TiO2 NTAs as the photoanode and Pt foil as the counter electrode. The photoanode was subjected to continuous irradiation under illumination intensity of 100 mW cm−2 and the hydrogen was collected from above the counter electrode of Pt foil.

Results and discussion

Fig. 1A shows the fabrication process of Cu2O/TiO2 NTAs. According to the applied preparation procedure (see the Experimental section for more details), the formation of Cu2O is considered to be following the below overall reaction equation:28
N2H4 + 4Cu(OH)42− → 2Cu2O + N2 + 6H2O + 8OH

image file: c6ra06893f-f1.tif
Fig. 1 (A) Flowchart illustrating the fabrication process of Cu2O/TiO2 NTAs; (B) schematic of the role of glucose.

To enable this reaction to occur, the Cu2+ ions must firstly be reduced to Cu+ by N2H4, then the obtained Cu+ ions have three possible completion reactions to achieve different final product:

 
Cu+ → Cu0 (1)
 
2Cu+ → Cu0 + Cu2+ (2)
 
2Cu+ + 2OH → 2CuOH → Cu2O (3)

Cu2O can be obtained only when the reaction (3) occupies an absolute advantage. As depicted in Fig. 1B, a cage can be formed by the hydroxyl ligand of glucose. In the appearance of glucose, the Cu2+ ions are shut inside the cage. However, OH ions that have small size can freely permeate into the cage, in which it will quickly combine with the Cu+ ion to form CuOH once the Cu+ ion is available through the reduction of Cu2+ in the cage by N2H4. Then the CuOH is converted to Cu2O based on the reaction (3). In contrast, N2H4 molecule has much larger size that makes it relatively difficult to enter into the cage. Such a weaker competition than OH into the cage limits the diffusion of N2H4 to continue reaction with Cu+ and thus inhibits the reactions (1) and (2) of Cu+ into Cu.

Fig. 2 shows the FESEM images of pure TiO2 NTAs (Fig. 2A) and Cu2O/TiO2 NTAs (Fig. 2B–F). As shown in Fig. 2A, vertically aligned pure TiO2 tube arrays have an average diameter of 120 nm and wall thickness of 10 nm. After 8 CAR cycles, sample prepared in the solution with 0.5 M glucose content produced out abundant oval particles with size of about 35 nm, which have a tendency to agglomerate on the surface of nanotubes (see Fig. 2B). However, as shown in Fig. 2C for the sample prepared using 1.0 M glucose solution, numerous spherical particles with very small size uniformly covered the walls of TiO2 NTAs. The size of Cu2O particles reduced in the wake of the increasing glucose content from 0.5 M to 1.0 M, while their shape changed from cube to sphere in the appearance of glucose (see Fig. 2D and E), resulting in more symmetrical coverage and forming a hollow coaxial heterogeneous structure. Apparently, such structure possesses much greater contact area between particles and the wall of nanotubes and much more specific surface area of the NTAs. In this MC-CRA process, two key steps must be mentioned. They are the glucose adding and the intermediate soaking. For comparison, the morphologies of Cu2O/TiO2 NTAs samples fabricated in the solution without glucose and with 1.0 M glucose content but in an absence of the intermediate soaking step are shown in Fig. 2D and E, respectively. As shown in Fig. 2D, the sample without adding glucose produces cubic Cu2O particles with larger size. These large particles simply accumulated on the surface of the nanotubes, and were unable to enter the inside of the nanotubes. Obviously, such morphology cannot form the heterogeneous structure between Cu2O and TiO2 NTAs with the aim to extend the visible-light response of TiO2 NTAs. After adding the glucose, the shape of Cu2O particles changed from cubic to sphere and their size obviously decreased (Fig. 2E). However, in the absence of the intermediate soaking, the particle size is still as large as the diameter of nanotube pore, thereby causing the clogging of partial nanotube pores. In contract, introducing the intermediate soaking step produced very small particles which formed an even covering layer on the wall of the nanotubes (Fig. 2F, a magnified morphology of sample obtained according to the normal MC-CAR process as described in the Experimental section). Such a soaking step separated the adsorption and reduction processes to produce the effects of two aspects: on one hand, this soaking step isolates the Cu2+ nuclei and prevent them growth from aggregating and as a result enables them to form very even and uniform particle film with very small particle size; on the other hand, it also limits the diffusion of N2H4 to the nuclei and thus inhibit the further reduction of Cu+ into Cu.


image file: c6ra06893f-f2.tif
Fig. 2 FESEM images of TiO2 NTAs (A) and Cu2O/TiO2 NTAs fabricated in the solutions containing 0.5 M glucose (B), 1.0 M glucose (C), without glucose (D), with glucose but in an absence of the intermediate soaking step (E). Enlarged micrograph showing a very thin covering layer grown on the tube wall surface using the normal MC-CAR process (F).

Fig. 3 shows the influence of glucose content on morphology of as-prepared Cu2O. As depicted in Fig. 3, the shape of Cu2O particles changed from cubic to sphere and their size obviously decreased from 580 nm to 35 nm after adding the glucose. The size of Cu2O particles reduced from 35 nm to 10 nm in the wake of the increasing glucose content from 0.5 M to 1.0 M. As is known, two completely different mechanisms including diffusion mechanism and aggregation mechanism are usually used to explain the formation of crystals.29,30 In the absence of glucose, the aggregation may be a dominating factor, and the nucleation stage was followed by the aggregation of dispersed Cu2+, then large cubic Cu2O was obtained. In the presence of glucose, the diffusion mechanism may control the formation of Cu2O nuclei. As depicted in Fig. 1B, nucleation sites were produced in the cage formed by the hydroxyl ligand of glucose. The evenly dispersing cage could isolate the nuclei and prevent them from agglomeration. Glucose can act as a stabilizing agent and control the particle size and distribution more uniform. In other words, increasing glucose content enables Cu2+ to disperse more evenly in glucose solution, forming a greater number of cages and nucleation sites, and as a result forms smaller Cu2O particle.


image file: c6ra06893f-f3.tif
Fig. 3 The influence chart of glucose content on morphology of as-prepared Cu2O.

The XRD patterns of pure TiO2 NTAs and Cu2O/TiO2 NTAs are shown in Fig. 4A. Only anatase peaks appeared in the pattern of pure TiO2 NTAs. The anatase phase was expected to achieve better photoelectrochemical performance.31 In comparison with the pattern of pure TiO2 NTAs, the XRD patterns of both 0.5 M and 1.0 M samples (samples prepared in the solution with 0.5 M and 1.0 glucose content, respectively) presented several additional peaks, which were indexed to Cu2O phases (the label C in Fig. 4A). The three additional peaks with 2θ values of 36.52, 42.44, and 61.54 correspond to 〈111〉, 〈200〉, 〈220〉 crystal faces of Cu2O, respectively. No diffractive peaks of Cu and CuO phase were observed in the XRD patterns, suggesting that the resulting samples were pure Cu2O/TiO2 NTAs.


image file: c6ra06893f-f4.tif
Fig. 4 XRD patterns (A) and UV-vis spectra (B) of pure TiO2 NTAs and Cu2O/TiO2 NTAs fabricated in the solutions containing 0.5 M or 1.0 M glucose. EDX spectra of 0.5 M sample (C) and 1.0 M sample (D).

Fig. 4B features the UV-vis diffuse reflectance spectra (DRS) of pure TiO2 NTAs and Cu2O/TiO2 NTAs. The absorption limit of 390 nm in pure TiO2 NTAs corresponds to anatase band gap of 3.2 eV. For Cu2O/TiO2 NTAs samples, red shifts and enhanced absorption in the visible-light region were observed. 1.0 M sample showed higher absorption ability than 0.5 M sample in the whole visible-light region. By combining with the SEM images, the improvement of optical absorption ability might be derived from the decrease in particle size of Cu2O and thus resulting available larger specific surface area in the 1.0 M sample.

Fig. 4C and D show the EDX spectra of 0.5 M sample and 1.0 M sample, respectively. The contents of copper element in both samples were approximately identical (4.48% in 0.5 M sample and 4.21% in 1.0 M sample), which indicated that the glucose content did not significantly influence the deposition amount of Cu2O particles. The deposition amount of Cu2O in each cycle depended on two factors, namely Cu2+ adsorption and subsequent reduction. To begin with, the employed intermediate soaking step interrupted the adsorption process, resulting in a dramatic decrease in the Cu2+ adsorption rate at each adsorption step. In such a small adsorption rate condition, the glucose content hardly exerted any influence on the adsorption process. Secondly, the reduction of adsorptive Cu2+ was mainly carried out by N2H4 that as a relatively stronger reductant played a principal role in the reduction process rather than the residual glucose after soaking. Since no impurities were detected in XRD patterns, the samples obtained using different glucose contents were considered to contain the same amount of Cu2O in each specific cycle number, therefore, the photocatalytic properties can be compared to investigate the effect of particle size and morphology of the samples prepared using different glucose contents in each specific cycle number.

Fig. 5A features the potentiodynamic behaviors of 0.5 M samples prepared using different deposition cycles; data for the corresponding pure TiO2 NTAs substrate before sensitization is also provided. Only photocurrent density of 1.9 mA cm−2 was observed in the pure TiO2 NTAs, and all the Cu2O/TiO2 NTAs showed higher photocurrent density than the pure TiO2 NTAs. The photocurrent densities of these Cu2O/TiO2 NTAs expressed as functions of the deposition cycle number are presented as a histogram in Fig. 5C. The photocurrent density increased in the wake of the increasing cycle number when the deposition cycles were below than 8. The maximum photocurrent density in 0.5 M samples was 5.9 mA cm−2 at 8 cycles that is a 3-fold enhancement compared with that of the pure TiO2 NTAs. When the deposition cycles were greater than 8, the photocurrent density rapidly dropped to 4.9 mA cm−2 at 10 cycles and 4.5 mA cm−2 at 12 cycles. This decline was possibly attributed to the clogging of nanotube mouth due to the excessive deposition, resulting in a decrease in the light absorption areas of the NTAs.


image file: c6ra06893f-f5.tif
Fig. 5 Potentiodynamic current density of 0.5 M samples (A) and 1.0 M samples (B) after different deposition cycles, and histogram of the photocurrent density of both samples at different deposition cycles (C).

Photocurrent densities of 1.0 M samples are given in Fig. 5B, and their values expressed as functions of the deposition cycle numbers also are presented in Fig. 5C. As shown in Fig. 5C, the changes of photocurrent density with the variation of deposition cycle number in 1.0 M samples were similar to that in 0.5 M samples. The highest photocurrent density among 1.0 M samples was 7.2 mA cm−2 at 8 cycles. This value is 3.8 times enhancement compared with that of pure TiO2 NTAs, and is also higher than the 5.9 mA cm−2 level obtained from 0.5 M sample.

Fig. 6 shows several typical top-surface micrographs of Cu2O/TiO2 NTAs fabricated using different deposition cycle number (1.0 M glucose). As shown in Fig. 6A, four cycles of Cu2O seem to be unable to fully cover the wall surface of the TiO2 NTAs. However, increasing the cycle number to 8, an even coating layer was formed on the wall surface of the TiO2 NTAs (Fig. 6B). The average thickness of wall was 36 nm, suggesting that the Cu2O coating layer was 13 nm (the pure TiO2 NTAs had an average wall thickness of 10 nm). When the deposition cycle was further increased to 12, the wall thickness enhanced to 70 nm, indicating that the sensitized Cu2O coating layer was too thick at the cycle number (Fig. 6C). Thicker coating layer increased the distance that photogenerated holes and electrons must travel in the sensitization layer of Cu2O to reach the electrolyte or underlying conducting substrate. The longer distance the charge-carriers traveled, the greater possibility the photogenerated e–h pairs recombined. It is also highly likely that the nanotube mouth was partially plugged, resulting in the decrease in the light absorption areas of the NTs and the attenuation of their photoelectrochemical performance.


image file: c6ra06893f-f6.tif
Fig. 6 FESEM images of top-surface of as-prepared Cu2O/TiO2 NTAs using standard MC-CAR process in solution containing 1.0 M glucose with various cycle number. (A) 4 cycles; (B) 8 cycles; (C) 12 cycles.

Furthermore, in comparison with 0.5 M samples, 1.0 M samples owned more outstanding photocatalytic properties in each investigated cycle point. Since the Cu2O amount obtained in each specific deposition cycle point exhibited approximately identical value regardless of the content change of glucose additive (based on the EDX results), thus the improvement of photocatalytic properties in 1.0 M samples should be attributed to the formation of unique morphological structure, namely coaxial heterogeneous structure. The particle sizes achieved in 1.0 M samples is consistently smaller relative to that in 0.5 M samples as mentioned above. The resultant particles with relatively small and uniform size can evenly cover the TiO2 NTAs walls to form a compact coaxial heterogeneous structure. Such a structure greatly increased the contact area between TiO2 NTAs and Cu2O particles, exciting the photoelectrons in the sensitizer and smoothly injecting them into the conduction band of TiO2 NTAs. This unique morphological structure also did not reduce the specific surface area and absorption capacity of TiO2 NTAs.

The prepared Cu2O/TiO2 NTAs sample was further investigated using high resolution transmission electron microscopy (HRTEM). Fig. 7A shows the HRTEM image of two single tubes of the prepared sample. The enlarged micrograph clearly shows a coaxial heterogeneous structure, in which the wall of TiO2 nanotube formed the core material and Cu2O coating layer was covered on both sides of the tube wall (Fig. 7B). The d spacing of 0.35 nm in the core was identifiable to the interplanar spacing of the TiO2 (101) plane. The d spacing in the outer side of the tube wall was 0.25 nm and was assignable to the interplanar spacing of the Cu2O (111) plane, while the d spacing in the inner side of the wall was measured to be 0.21 nm, which matched well the interplanar spacing of Cu2O (200) plane. The crystal phase was consistent with the XRD measurement result shown in Fig. 4A. The direction difference of crystal plane between both sides of the tube wall can be explained by a diffusion-limited progressive growth model due to different kinetic condition caused by copper ion concentration. Considering the adjacent growth of the tube with tube, the outer space of the tube wall is smaller than its internal space. It appears that an inadequate washing process may occur in such a small outer space of the tube wall as the intermediate soaking step is only 30 s. Therefore, after using the intermediate soaking step, the copper ion concentration outside the wall should be higher than inside the wall. The deposition and growth kinetics of different concentrations were believed to play an especially important role in forming different crystal plane direction between both sides of the tube wall. According to the crystal growth theory, particles tended to grow along the high-energy crystal planes that have higher surface free energy, with the purpose to reduce the surface free energy by eliminating these crystal planes. For Cu2O monocrystal, by adjusting the precursor such as copper ion and reductant concentration, the growth rate along the [100] direction relative to that of the [111] direction could be varied owing to the change of surface free energy of crystal plane in different concentrations.32,33 Therefore, Cu2O crystals with different crystal plane direction on each side of the tube wall were obtained.


image file: c6ra06893f-f7.tif
Fig. 7 (A) TEM image of sample Cu2O/TiO2 NTAs with coaxial heterogeneous structure (8 cycles, 1.0 M glucose). (B) Enlarged micrograph showing the interplanar spacing of Cu2O grown on both sides of the tube wall of the TiO2 nanotube.

Fig. 8A shows the photoresponse activities of pure TiO2 NTAs and Cu2O/TiO2 NTAs (8 cycles) at a 0 V bias with a pulse of 50 s under an illumination intensity of 100 mW cm−2. Within the initial 50 s, no current was recorded in the absence of irradiation. When receiving illumination at the end of 50 s, transient current density was generated up to 5.2 mA cm−2 and 7.2 mA cm−2 in 0.5 M sample and 1.0 M sample, respectively, then gradually leveled off to a steady value of 4.5 mA cm−2 and 5.6 mA cm−2. The current immediately dropped to about zero at the moment of turning off the light. There was no obvious current density in the dark, and all the current generated under illumination was considered the photocurrent density. In comparison with the pure TiO2 NTAs, great improvements of photocurrent density were observed in all the Cu2O/TiO2 NTAs samples, in which 1.0 M sample possessed higher current density than 0.5 M sample.


image file: c6ra06893f-f8.tif
Fig. 8 (A) Photoresponse of (a) TiO2 NTAs, (b) 0.5 M sample, and (c) 1.0 M sample. (B) Average hydrogen yield within 10 hours. (C) Schematic of photocatalytic hydrogen evolution using Cu2O/TiO2 NTAs as the photoanodes.

To investigate the hydrogen evolution ability and photocorrosion resistibility, hydrogen evolution reaction was measured. Fig. 8C shows the schematic of photocatalytic hydrogen evolution using Cu2O/TiO2 NTAs as the photoanodes, in which the conduction band of Cu2O is more cathodic than the corresponding band of TiO2. The photoelectrons generated in the Cu2O conduction band move to the conduction band of the TiO2 NTAs and are then transferred to the counter electrode of Pt (through back-contact of Ti), thereby reducing protons and generating hydrogen. The valence band of Cu2O is more positive than the corresponding band of TiO2, which promote the migration of photogenerated holes. The holes (from both Cu2O and TiO2) move to the interface to react with the hole trapping agent of ethylene glycol to generate protons.

Fig. 8B shows the hydrogen production rates per hour of pure TiO2 NTAs and Cu2O/TiO2 NTAs prepared in 0.5 M and 1.0 M glucose solutions using 8 deposition cycles. In first hour, the hydrogen yield of 0.5 M sample was approximately 3.05 mL cm−2 h−1 and is 2.5 times that of TiO2 NTAs (1.2 mL cm−2 h−1). However, the yields dropped to 2.75 mL cm−2 h−1 and 2.5 mL cm−2 h−1 in the second and third hours, respectively, then reached a steady state. An average recession rate of 0.275 mL cm−2 h−1 was calculated in the initial two hours. The initial recession possibly resulted from the oxidation of Cu2O by photo-generated holes.34 The yield remained the approximatively same value after third hour, which was due to the protection of the oxidation product (CuO) on the surface of electrode.35 In contrast, 1.0 M sample achieved a maximum hydrogen yield of 3.5 mL cm−2 h−1, which was in accord with the previous results of photocurrent density. Drops were also observed in the second and third hours, whereas the recession rate was merely 0.15 mL cm−2 h−1 for both the hours. After slightly initial recession, the yields trended toward a stable value, 3.1 mL cm−2 h−1, in the subsequent investigation period. These results suggested that the 1.0 M sample possesses better hydrogen evolution ability and photocorrosion resistibility, indicating a suitable particle size of sensitizer and resulting unique morphological structure that is useful for hydrogen generation from water.

Conclusions

Cu2O/TiO2 nanotube-array with coaxial heterogeneous structure has been synthesized by multiple-cycle chemical absorption plus reduction method. Small Cu2O particles (∼10 nm) were successfully formed and uniformly deposited onto nanotube walls. The photocatalytic performance of TiO2 NTAs was enhanced by loading Cu2O nanoparticles while the sample coated with smaller particles exhibited the better photoconversion efficiency and outstanding hydrogen evolution ability. In addition, excessive deposition can result in the reduction in photocatalytic performance. In summary, Cu2O/TiO2 nanotube-array with coaxial heterogeneous structure is a promising candidate for the photo-induced splitting of water into hydrogen. More importantly, this mentioned method is expected to be useful in depositing nanoparticles into highly ordered nano-materials with ultra large specific surface areas.

Acknowledgements

This work was financed by the Marie Curie IIF Fellowship (623733), the National Natural Science Foundation of China (21173090), the Special Found for Strategic Emerging Industry Development of Shenzhen (JCYJ20120618100557119). Technical assistance from the Analytical and Testing Center of HUST is gratefully acknowledged.

References

  1. Y.-H. Pai and S.-Y. Fang, J. Power Sources, 2013, 230, 321–326 CrossRef CAS.
  2. K. Lalitha, G. Sadanandam, V. D. Kumari, M. Subrahmanyam, B. Sreedhar and N. Y. Hebalkar, J. Phys. Chem. C, 2010, 114, 22181–22189 CAS.
  3. J. Fenoll, P. Hellín, P. Flores, I. Garrido and S. Navarro, J. Taiwan Inst. Chem. Eng., 2013, 45, 981–988 CrossRef.
  4. M. Kaneko, S. Suzuki, H. Ueno, J. Nemoto and Y. Fujii, Electrochim. Acta, 2010, 55, 3068–3074 CrossRef CAS.
  5. S. Sato, R. Nakamura and S. Abe, Appl. Catal., A, 2005, 284, 131–137 CrossRef CAS.
  6. D. Liu, F. Liu and J. Liu, J. Power Sources, 2012, 213, 78–82 CrossRef CAS.
  7. E. Bae and W. Choi, Environ. Sci. Technol., 2003, 37, 147–152 CrossRef CAS PubMed.
  8. W. Zhu, X. Liu, H. Liu, D. Tong, J. Yang and J. Peng, J. Am. Chem. Soc., 2010, 132, 12619–12626 CrossRef CAS PubMed.
  9. L. Xiang, X. Zhao, C. Shang and J. Yin, J. Colloid Interface Sci., 2013, 403, 22–28 CrossRef CAS PubMed.
  10. Z. L. Hua, Z. Y. Dai, X. Bai, Z. F. Ye, H. X. Gu and X. Huang, J. Hazard. Mater., 2015, 293, 112–121 CrossRef CAS PubMed.
  11. W.-T. Sun, Y. Yu, H.-Y. Pan, X.-F. Gao, Q. Chen and L.-M. Peng, J. Am. Chem. Soc., 2008, 130, 1124–1125 CrossRef CAS PubMed.
  12. V. Brus, M. Ilashchuk, Z. Kovalyuk, P. Maryanchuk and K. Ulyanytsky, Semicond. Sci. Technol., 2011, 26, 125006 CrossRef.
  13. C. Lu, L. Qi, J. Yang, X. Wang, D. Zhang, J. Xie and J. Ma, Adv. Mater., 2005, 17, 2562–2567 CrossRef CAS.
  14. H. Gao, J. Y. Zhang, R. M. Wang and M. Wang, Appl. Catal., B, 2015, 172, 1–6 CrossRef.
  15. W. Siripala, A. Ivanovskaya, T. F. Jaramillo, S.-H. Baeck and E. W. McFarland, Sol. Energy Mater. Sol. Cells, 2003, 77, 229–237 CrossRef CAS.
  16. C. Shifu, Z. Sujuan, L. Wei and Z. Wei, J. Nanosci. Nanotechnol., 2009, 9, 4397–4403 CrossRef PubMed.
  17. L. Yang, S. Luo, Y. Li, Y. Xiao, Q. Kang and Q. Cai, Environ. Sci. Technol., 2010, 44, 7641–7646 CrossRef CAS PubMed.
  18. S. Zhang, S. Zhang, F. Peng, H. Zhang, H. Liu and H. Zhao, Electrochem. Commun., 2011, 13, 861–864 CrossRef CAS.
  19. Z. Jin, G. T. Fei, X. Y. Hu, M. Wang and L. De Zhang, J. Nanoeng. Nanomanuf., 2012, 2, 49–53 CrossRef CAS.
  20. Y.-h. Xu, D.-h. Liang, M.-l. Liu and D.-z. Liu, Mater. Res. Bull., 2008, 43, 3474–3482 CrossRef CAS.
  21. Y. Hou, X. Li, X. Zou, X. Quan and G. Chen, Environ. Sci. Technol., 2008, 43, 858–863 CrossRef.
  22. L. Huang, F. Peng, H. Wang, H. Yu and Z. Li, Catal. Commun., 2009, 10, 1839–1843 CrossRef CAS.
  23. H. Y. Xu, C. Chen, L. Xu and J. K. Dong, Thin Solid Films, 2013, 527, 76–80 CrossRef CAS.
  24. Z. H. Gao, Z. D. Cui, S. L. Zhu, Y. Q. Liang, Z. Y. Li and X. J. Yang, J. Power Sources, 2015, 283, 397–407 CrossRef CAS.
  25. M. Wang, L. Sun, Z. Lin, J. Cai, K. Xie and C. Lin, Energy Environ. Sci., 2013, 6, 1211–1220 CAS.
  26. H. Wang, W. Zhu, B. Chong and K. Qin, Int. J. Hydrogen Energy, 2014, 39, 90–99 CrossRef CAS.
  27. W. Zhu, X. Liu, H. Liu, D. Tong, J. Yang and J. Peng, Electrochim. Acta, 2011, 56, 2618–2626 CrossRef CAS.
  28. Y. Dong, Y. Li, C. Wang, A. Cui and Z. Deng, J. Colloid Interface Sci., 2001, 243, 85–89 CrossRef CAS.
  29. M. Ocana, R. Rodriguez-Clemente and C. Serna, Adv. Mater., 1995, 2, 212–216 CrossRef.
  30. Y. Xia, B. Gates, Y. Yin and Y. Lu, Adv. Mater., 2000, 10, 693–713 CrossRef.
  31. N.-G. Park, J. Van de Lagemaat and A. Frank, J. Phys. Chem. B, 2000, 104, 8989–8994 CrossRef CAS.
  32. A. Radi, D. Pradhan, Y. Sohn and K. T. Leung, ACS Nano, 2010, 4, 1553–1560 CrossRef CAS PubMed.
  33. Y. B. Cao, J. M. Fan, L. Y. Bai, F. L. Yuan and Y. F. Chen, Cryst. Growth Des., 2010, 10, 232–236 CAS.
  34. Y. Bessekhouad, D. Robert and J.-V. Weber, Catal. Today, 2005, 101, 315–321 CrossRef CAS.
  35. K. Borgohain, N. Murase and S. Mahamuni, J. Appl. Phys., 2002, 92, 1292–1297 CrossRef CAS.

This journal is © The Royal Society of Chemistry 2016
Click here to see how this site uses Cookies. View our privacy policy here.