Removal of heavy metal ions using functionalized graphene membranes: a molecular dynamics study

Anitha Kommu, Sadanandam Namsani and Jayant K. Singh*
Department of Chemical Engineering, Indian Institute of Technology Kanpur, Kanpur-208016, India. E-mail: jayantks@iitk.ac.in; Fax: +91-512-259-0104; Tel: +91-512-259-6141

Received 15th March 2016 , Accepted 23rd June 2016

First published on 27th June 2016


Abstract

Industrial wastewater contains toxic metals such as copper, lead, cadmium, zinc and cobalt. Hence, it is necessary to eliminate the toxic heavy metal ions from wastewater before it is released into the environment. In this study, we have used classical molecular dynamics (MD) simulations and density functional theory (DFT) calculations to investigate the desalination performance of nanoporous graphene (NPG) membranes for different pore sizes and chemical functionalization (hydroxyl, nitrogen and fluorine) of the pore. The underlying mechanism involved in the separation process is explained using potential of mean force (PMF) calculations and plane-wave (PW) DFT calculations. The estimated energy barriers using DFT calculations were found to be in good agreement with the results obtained using classical MD simulations. This study shows that the NPG functionalized with N (NPG-N) shows higher salt rejection with intermediate permeability compared NPG functionalized with F (NPG-F) and OH (NPG-OH). NPG-OH shows higher water permeability with lower salt rejection compared to NPG-N and NPG-F. However, NPG-F shows lowest permeability compared to other two NPGs considered in this study. Even at high pressures like 500 MPa the salt rejection percentage is not less than 90% and the minimum permeability is 270 L cm−2 h−1 bar−1. Overall, our results indicate that the water permeability of NPG membranes is about 4–5 orders of magnitude higher than the existing technologies. Thus, the NPG membrane may have a valuable role to play in industrial waste water purification.

1. Introduction

Heavy metal pollution due to the indiscriminate disposal of wastewater is a worldwide environmental concern. Wastewater from industries such as metallurgical, mining and chemical manufacturing industries contains many kinds of toxic metal ions.1,2 A growing number of toxic contaminants are being poured into water resources, which has led to numerous people becoming sick or dying from contaminated water.3–5 Thereby, it is necessary to eliminate the toxic heavy metal ions from wastewater before it is released into the environment. These problems have driven rapid advancements in water purification6 and wastewater reutilization7 in recent years. Membrane-based desalination techniques, mainly reverse osmosis (RO), are currently considered as more environmental friendly and energy-efficient than that of thermal desalination methods such as multistage flash and multiple-effect distillation.8 Although, traditional membrane based desalination technique is the most efficient technique to date, it suffers from low desalination capacity and high capital costs.9–11 Moreover, the conventional membranes currently used in the RO plants are prone to fouling, suffer from flux decline under high pressure, undergo rapid degradation, and have low tolerance to high temperature, acids/alkaline, chlorine, and organic solvents.12 Hence there is a pressing need for developing novel membranes with high water permeability coupled with high salt rejection capacity, which can reduce the energy consumption of the RO process.13,14 The ideal membrane should provide higher flux and selectivity, improved stability, and resistance to fouling. Also, it should be as thin as possible and mechanically robust to maximize permeability, should be chemically inert, and must retain a high salt rejection rate throughout its service life.15 Recently, nanostructures such as zeolites, metal organic frameworks, ceramics and carbon based materials have attracted considerable attention as alternative membrane materials to replace polymeric membranes due to its good chemical resistance, high flux, and high rejection rates.13 However, zeolites membranes have failed to realize economical fabrication on a large scale due to manufacturing cost, reproducibility and presence of defects.16 The ceramic membranes are also costly and very brittle under high pressure that limits their practical application in membrane technologies. Although it is possible to fabricate high-flux and high selectivity membranes from carbon nanotubes (CNTs), it is currently difficult to synthesize highly aligned and high density CNTs with large lengths. CNTs remain an active area of research for membrane technologies but cost and operational issues have greatly hindered the development and integration of CNTs into large area membranes.17 In recent years, graphene based materials have attracted great interest for their potential use in desalination and purification of contaminated water.

Graphene is a two-dimensional sheet of sp2-bonded carbon atoms in a hexagonal honeycomb network, and it has an excellent mechanical, thermal, and electronic properties.18 A stable porous graphene is recently fabricated by creating pores in graphene sheet (GS) using a focused electron beam of the transmission electron microscope (TEM).19 The resultant porous GS is found to allow the DNA to pass through the nanopores. Ion bombardment is also employed to create nanopores in GS.20,21 First principle calculations22,23 and experimental investigations24 demonstrated that angstrom-sized pores on graphene are capable of selective molecular sieving for gas separation. In the recent past, the selective penetration properties of NPG membranes have been investigated using molecular dynamics (MD), and showed that they can be utilized to separate different gases25 and ions26 selectively through the design of various nanopores with different shapes, sizes, and chemical functionalities. Cohen-Tanugi et al.27 indicated that single-layer graphene with nanopores can be utilized to separate NaCl from water efficiently and the desalination performance depends on the pore size, chemical functionalization, and the pressure applied.

It is also demonstrated that the chemical functionalization of pore rim can affect the separation performance of porous graphene membranes. Sint et al.26 designed functionalized nanopores in graphene monolayers and showed that they could serve as ionic sieves of high selectivity and transparency using MD simulations. Various research groups have synthesized GS functionalized with carboxylate,28 hydroxyl28 and amine terminated polystyrene.29 In an experimental study, functionalized (carboxylate, hydroxyl and amine) graphene sheets have been used for removal of high concentrations of metal salts.30 Furthermore, Sun et al.31 investigated the transport of alkali and alkaline earth cations (Na+, K+, Mg2+, Ca2+ and Ba2+) into and through graphene oxide (GO) membranes. The authors, using first-principles calculations based on the plane-wave (PW) basis set density functional theory (DFT) approach, studied the interaction metal-graphene interactions, and found their results consistent with the experiments. Konatham et al.32 found that in NPG sheet, the pore diameter has the largest effect on free-energy profiles of the graphene sheets. On the other hand, hydroxyl (–OH) functionalized pores gave promising results for the removal of ions at both low and moderate ion concentrations indicating their strong potential for the purification of contaminated water.

In this paper, we have performed MD simulations using NPG membranes for removal of heavy metal ions from water. Using classical MD simulations, we examine the metal ion separation performance using NPG membranes with variable pore size, pore chemistry, and applied hydrostatic pressure. We quantify the effect of functionalizing pores with nitrogen, fluorine and hydroxyl (–OH) on the ability to reject Pb(NO3)2, Cu(NO3)2, Cd(NO3)2, Co(NO3)2 and Zn(NO3)2 using water permeability, salt rejection and free-energy profiles.

2. Models and methods

2.1 DFT calculations

The functionalized NPG sheet is prepared by drilling off the carbon atoms from a GS of size 20 Å × 20 Å. The number of carbon atoms to be removed from the GS for a functional group is decided on the basis of hydration radius of the ion. The pore size is selected in such a way that it is less than the hydration radius of the ion. In this study, the nanoporous sheet is functionalized using N, F, and OH functional groups. These functionalized NPGs are optimized using PW-DFT to get the minimum energy structures of the NPGs. The optimized geometries and the respective electron density isosurfaces are used to calculate the pore size. Here, the pore size is defined as the average of the maximum and minimum distances within the pore. The pore sizes of N, F and OH-functionalized porous GS are 8.0, 9.0 and 12.0 Å, respectively. We have also varied the pore size of the membranes to study the effect of pore size on separation of metal ions separation. The optimized structures are further used in the calculation of free energy barrier for water to pass through the graphene pore.

We have considered three different orientations for a water molecule in order to estimate its free energy barrier to pass through NPG. The considered different orientations for water molecule for the N functionalized graphene pore are shown in Fig. 1. The lowest energy structure among the considered orientations is further used in the energy barrier calculations. Further, we have varied the distance between the GS and the water molecule, and performed single point energy calculations to generate the energy vs. distance data. These single point energy calculations are performed using PW-DFT and the resulted energy vs. distance data is used to calculate the energy barrier. These calculations on functionalized NPG are performed using a periodic simulation box of size 22.098 Å × 21.263 Å × 100 Å.


image file: c6ra06817k-f1.tif
Fig. 1 Different orientations considered for water molecule in the NPG-N for energy barrier calculations: (a) hydrogen atoms of water molecule are in upward direction to the graphene pore, (b) hydrogen atoms are in the same plane of graphene pore, and (c) one of the hydrogen oxygen bond axis of the water molecule is perpendicular to the pore axis.

All the PW-DFT calculations are carried out using PBE functional and Ultrasoft pseudopotentials33 as implemented in Car-Parrinello MD (CPMD)34,35 code. A PW cutoff of 25 Ry is used. All the geometries are optimized using PW-DFT with a convergence criterion of 10−6 a.u. for SCF tolerance, 10−5 for energy. For the single point energy calculations, we have used wave function gradient convergence of 10−7 a.u.

2.2 Classical MD simulations

In order to perform MD simulations we have replicated the DFT optimized 20 Å functionalized graphene sheet to create the GS membrane of size 110.55 Å × 106.36 Å having 25 pores. This is placed parallel to the xy plane in the center of the simulation box. The pores are functionalized using functional groups: hydroxyl (NPG-OH), nitrogen (NPG-N) and fluorine (NPG-F). All MD simulations are carried out with LAMMPS software.36 These simulations are performed for systems with various aqueous solutions of Cd(NO3)2, Cu(NO3)2, Pb(NO3)2, Co(NO3)2 and Zn(NO3)2 ionic salts. TIP3P37 model is used to represents the water molecules, and OPLS (optimized potential for liquid simulation) parameters are used for metal ions, GS and functional groups.38 The long-range electrostatic interaction is accounted using particle–particle particle–mesh (PPPM) technique. The force field parameters used in this work are tabulated in Table 1. The carbon atoms in GS are modeled as uncharged and kept rigid. On the other hand, the functional groups on the GS pores are kept flexible.
Table 1 Non-bonded interaction parameters
Molecules/ions Site Charge (e) σ (Å) ε (kcal mol−1)
Water O (water) −0.8340 3.1506 0.1521
H (water) 0.4170 0.000 0.0000
Graphene C 0.000 3.400 0.0556
NPG-N C (graphene) 0.241 3.400 0.0556
N −0.241 3.263 0.077
NPG-F C (graphene) 0.220 3.400 0.069
F −0.220 2.850 0.061
NPG-OH C (graphene) 0.200 3.400 0.086
O −0.640 3.070 0.155
H 0.440 0.000 0.000
–NO3 N 0.950 3.207 0.160
O −0.650 3.349 0.170
Metal ions Pb2+ 2.000 3.000 0.19112
Cd2+ 2.000 2.700 0.00597
Cu2+ 2.000 2.130 0.0500
Co2+ 2.000 2.100 0.1811
Zn2+ 2.000 1.950 0.2500


The non-bonded interactions of water and ions with graphene are described by eqn (1).

 
image file: c6ra06817k-t1.tif(1)
where, εij and σij are the energy and length parameters of Lennard-Jones potential, respectively. The charges on the atoms i and j are represented by qi, and qj, respectively. rij denotes center to center distance, and ε0 represents the dielectric permittivity constant.

All the stretching and bending interactions are modeled using harmonic potentials:

 
image file: c6ra06817k-t2.tif(2)

Non-bonded cross interaction parameters of unlike pairs are calculated using Lorentz-Berthelot mixing rules.

The potential of mean force (PMF), for water and ions, is calculated in the direction perpendicular to the membrane pore (+z) using umbrella sampling,39,40 with 0.5 Å width of umbrella window. A biasing potential of around 10 kcal (mol−1 Å−2) is applied on the z coordinates of the ion and water in each window. All simulations are performed for 5 ns, and last 4 ns configurations are used for data analysis. The yielded umbrella histograms are then unbiased and combined using weighted histogram analysis method39 (WHAM) to obtain the PMF profile. NPG is solvated in 0.5 M initial concentration of ions is considered to calculate the PMF of water molecule. To obtain sufficient sampling in each window region, a quadratic biasing potential is used

 
image file: c6ra06817k-t3.tif(3)
where, ξ is the distance between the center of mass of molecule and graphene nanopore, ξi is the variation in the reaction coordinate from the graphene nanopore. K is the initially applied umbrella potential used to provide a significant overlapping between windows.

The biased probability ρ(b)(ξ) data from MD simulations is post processed using the WHAM to obtain the unbiased probability ρ(ξ) in the ith window, which is further used to estimate the PMF (W(ξ)) using the following equation:

 
Wi(ξ) = −kBT[thin space (1/6-em)]ln[thin space (1/6-em)]ρ(ξ) − wi + Fi, (4)
where the unknown free energy constant Fi is defined by the equation
 
image file: c6ra06817k-t4.tif(5)

In the WHAM, one uses an iterative process to determine the free energy constants, Fi. An initial guess set for Fi is used to estimate the unbiased probability (ρ(ξ)) distribution given by

 
image file: c6ra06817k-t5.tif(6)
where, Nw is the window number and n is the number configurations for a biased simulation. The statistical inefficiency gi is given by gi = 1 + 2τi, with the integrated autocorrelation time τi of umbrella window i. The quantity Fi is considered as the dimensionless free energy corresponding to the ith window, and it can be determined by the following equation
 
image file: c6ra06817k-t6.tif(7)

The unbiased probability itself depends on the value of Fi, hence the WHAM eqn (6) and (7) must be solved iteratively until they are self-consistent.

The simulations are performed using 0.5 M concentration for each metal ion using their nitrate salts in an aqueous solution. A representative snapshot is shown in Fig. 2. First, an upstream reservoir is initially filled with a salt water of 0.5 M concentration. The second portion of the box is made up of an initially empty downstream reservoir. The physical rigid piston made of a single layer of graphene in the xy plane is positioned initially at end of the solution containing reservoir, and subsequently allowed to push the salt water towards the NPG membrane at a prescribed external force. A simulation box of 110.55 × 106.36 × 103.00 Å3 size is used containing NPG membrane aligned along the z-axis. Subsequently, 50[thin space (1/6-em)]175 water molecules and 150 metal ions are added to the simulation box with the help of Packmol program.41 Periodic boundary conditions are applied in x and y directions. The long-range electrostatic interaction is accounted using particle–particle particle–mesh (PPPM) technique. A cut off distance of 10 Å is used for the non-bonded interactions. A time step of 1.0 fs is used, and trajectories of the simulations are collected at every 10 ps for the analysis. Non-equilibrium MD simulations are performed by applying a constant force to the rigid piston, corresponding to five different external pressures ΔP = 100, 200, 300, 400 and 500 MPa. In addition, we have also performed simulations at lower pressures of 5 and 10 MPa. The overall system is simulated under NVT ensemble, at a constant volume and temperature (298 K), using a Nosé–Hoover thermostat42,43 for 10 ns. The trajectories of the system obtained from NVT simulations are used to calculate the flux, salt rejection and water permeability.


image file: c6ra06817k-f2.tif
Fig. 2 (a) Functionalized NPG sheet (blue color functionalized atom) (b) overall view of the computational system, water (light blue surface), metal ions (pink color), nitrate ions (green and red color) and pressure applied on piston (grey color).

3. Results and discussion

3.1 Salt rejection

We start with the discussion on the salt rejection, which is one of the key issues for the separation performance of NPG membranes in water purification processes. Fig. 3a–c presents the salt rejection for NPG functionalized with hydroxyl, nitrogen and fluorine, at different pressures. In case of NPG-OH for all the salts considered in this study complete rejection is observed up to 100 MPa, and beyond 100 MPa salt rejection is found to decrease with increase in pressure (see Fig. 3a). The amount of decrease in the salt rejection is different for different type of ionic salts considered in this study. The maximum reduction is seen for zinc, and minimum reduction is observed for lead such that the percentage of salt rejection at 500 MPa is approximately 98% for lead salt and 90% for the zinc salt. In contrast to the behavior seen for NPG-OH the salt rejection for all the ionic salts in case of NPG-N is 100% up to 400 MPa, and beyond this pressure the percentage of salt rejection decreases (see Fig. 3b). The average percentage of the salt rejection for all the ions is approximately 98% at 500 MPa, which is remarkably good. Thus NPG-N is quite efficient material for rejection of ions up to 500 MPa. We further investigated the behavior of salt rejection in the presence of fluorine functionalized NPG, and found decline in the salt rejection capability than seen for NPG-N. However, NPG-F shows a better salt rejection performance than NPG-OH. The percentage of salt rejection observed for NPG-F is 100% up to 300 MPa for all the ionic salts considered in this study. Beyond 300 MPa there is decrease in salt rejection for all the ionic salts other than the lead salt. For the lead salt the percentage of rejection is ∼100% for the entire pressure range (100–500 MPa) considered in this study. The average percent of salt rejection for all ionic salts (other than lead) at 500 MPa is approximately 98%. This shows that the reduction in the salt rejection percentage is approximately 2% with increase in pressure from 300 MPa to 500 MPa.
image file: c6ra06817k-f3.tif
Fig. 3 Salt rejection as a function of applied pressure for NPG-OH, NPG-N and NPG-F pores. The results indicate that smaller pores are capable of effectively rejecting salt, but the rejection performance decreases with higher pressures.

It is evident based on the results presented above that, for the considered functionalized NPGs and applied pressures, NPG-N shows superior salt rejection ability compared to NPG-F and NPG-OH. Furthermore, compared to NPG-OH, NPG-F pore shows better salt rejection percentage at high pressures. Hence, the salt rejection efficiency of the three systems follows the order of NPG-N > NPG-F > NPG-OH. The variation in the percentage of the salt rejection for different pores (NPG-OH, NPG-N, and NPG-F) and different ionic salts is primarily because of the changes in the free-energy barrier due to the change in pore chemistry and salt. This aspect is discussed more elaborately in the later part of the article using PMF analysis.

3.2 Water conduction across NPG sheet

Now, we turn our attention to the water conduction rate across the NPG sheets under external hydrostatic pressure. We first measure the water conduction across the NPG sheets with pore functionalized with three different groups (hydroxyl, nitrogen and fluorine) under applied pressures ranging from 100 to 500 MPa. Although most of the industrial desalination processes are operated at a pressure of 5.5 MPa, higher pressure used here allowed us to obtain reasonable statistics within practical simulation time frame. Fig. 4 presents the water flux across the membrane as a function of the external hydrostatic pressure. The net flux is defined as the number of water molecules per picosecond per nanopore permeating across the NPG sheet. It is found that the water flux increases with the applied pressure, consistent with the previous observations for nanotube membranes44 and graphene nanopores.27 Fig. 4a presents the change in water flux with the applied pressure for NPG-OH. In the case NPG-OH, the water flux increases for all metal ions with increasing pressure (see Fig. 4a). The flux is almost same for all ionic solutions up to 500 MPa. Similar, behavior is seen for NPG-N and NPG-F pores. While there is no evidence of plateauing of the flux with pressure for NPG-OH, it is seen for NPG-N and NPG-F beyond 400 MPa i.e., the flux values remain more or less constant beyond 400 MPa for nitrogen and fluorine functionalized NPG (Fig. 4b and c). Specifically, under a given pressure of 300 MPa, the average water transport through NPG-N and NPG-F pores is ∼39% faster than that seen for NPG-OH. Therefore the NPG-N and NPG-F are both permeable to water, and the corresponding water flux is higher than that for NPG-OH (Fig. 4a–c). This analysis shows that the water flux through NPG-F is more compared to NPG-N and NPG-OH up to 300 MPa. In general the water flux follows the order of NPG-F > NPG-N > NPG-OH for the lower pressure range. After 300 MPa there is not much change in water flux value in the different functionalized NPGs.
image file: c6ra06817k-f4.tif
Fig. 4 Water flux per nanopore across NPG-OH, NPG-N and NPG-F pores at 0.5 M initial salt solution. The inset shows the water flux per nanopore for 5 and 10 MPa pressures.

Since most of the industrial reverse osmosis (RO) processes are operated within a pressure range of 5–10 MPa, we have performed additional molecular dynamics (MD) simulations at 5 and 10 MPa. The water flux values calculated at these pressures are shown as insets in Fig. 4, which are found to be many order lower than that seen for a pressure of 300 MPa. To study the effect of pore size on the desalination performance we carried out simulations for different pore sizes of functionalized NPG, at a pressure of 300 MPa. In case of NPG-OH, increasing the pore size from 8 to 9 Å increases the average water flux from ∼55 to ∼88 molecules per (ps per pore). For NPG-N, at 5 Å pore size the water molecules do not pass through the pore, and upon increasing the pore size to 9 Å the water flux increase to ∼110 molecules per (ps per pore). In case of NPG-F, for 8 and 12 Å pore sizes the obtained water flux values are ∼64 and ∼113 molecules per (ps per pore) respectively. Thus, for all the cases we observed increase in the flux value with increasing the pore size.

The water flux and salt rejection of dissolved impurities are the two main aspects for governing the separation performance of graphene and GO-based membranes in water purification processes. Recent MD simulations45,46 on GO membranes show that the GO also has the potential to separate the ions and dye molecules from contaminated water. Hu et al.47 reported that GO membranes display significant rejection of monovalent and divalent salts and moderate or high rejection of organic dyes. According to Josh et al.,48 the filtration is exclusively related to the hydrated radii of particles and does not depend on the charge of ions passing through the system. It was observed that an ultrafast permeation is possible only for ions smaller than a specific size. The GO membranes demonstrated significant promise for water purification applications in various studies. Compared to GO, graphene is simpler to design, more toxic to microbacteria,49 and more resistant to swelling in water. Thus, it is more competitive compared to GO. In order to understand the mechanism of water transport through these pores we have also performed PMF calculations for water and ions, which are presented in a later section.

3.3 Water permeability

The average water permeability across three different functionalized graphene pores as a function of effective pore area of functionalized GS is shown in Fig. 5. The permeability is calculated as (number of water molecules)/(area × time × applied pressure). It is evident from the Fig. 5 that the permeability is highly dependent on functional groups leading to different pore sizes. In case of NPG–OH group, all ions have almost constant permeability. The water permeability is highest for NPG-OH is around 590–620 L cm−2 h−1 bar−1, and this narrow range show that the water permeability is nearly same for all the heavy metal ions in the aqueous solutions. However, nitrogen and fluoride groups show some variability in the permeability values for different ions considered in this study. For example, for NPG-N, the permeability value range is 470–550 L cm−2 h−1 bar−1 for different ions considered in this study. Moreover, the highest permeability value is observed for the case of Pb2+ ion solution among the other ionic solutions. This value is comparable to that seen for the NPG-OH case. The water permeability for NPG-F is around 270–350 L cm−2 h−1 bar−1 for all metals ions considered in this study. The highest water permeability of ∼620 L cm−2 h−1 bar−1 is obtained in Pb2+ ion solution for NPG-OH, which is ∼13% and 50% larger than that seen in Pb2+ solution for the cases of NPG-N and NPG-F, respectively. Similar behavior is seen for other metal ions. This analysis shows that the water permeability is more for NPG-OH than NPG-N and NPG-F. This is because the pore area of NPG-OH is lower than that of NPG-N and NPG-F.
image file: c6ra06817k-f5.tif
Fig. 5 Average water permeability for the considered NPG-OH, NPG-N and NPG-F pores.

The water permeability behavior can be explained by the strength of hydrogen bond formed between the three membranes and a water molecule. To account for the hydrogen bond strength we have performed equilibrium MD simulations of a single water molecule and NPG systems. The difference in the interaction energies between the composite system and pure systems (ENPG-H2OENPGEH2O) is taken as the strength of the hydrogen bond. The obtained interaction energies are 3.87, 2.23, 1.70 kcal mol−1 for NPG-OH, NPG-N and NPG-F systems, respectively. This shows that the strength of the hydrogen bonding for NPG-OH is more compared to the other two NPGs. Thus, the strong hydrogen bonding of the water molecule with the pore functional group results in reducing flux rates. This clearly shows that NPG-F exhibits higher probability to pass the water molecules through its pore. This in inline with the calculated order of water flux through NPG: NPG-F > NPG-N > NPG-OH.

To understand the underlying mechanism of the heavy metal ion rejection though NPG membrane, we have calculated the PMF for water molecule and metal ion across the monolayer graphene nanopore using umbrella sampling.

3.4 Potential of mean force calculation

The PMF results are calculated across the three functionalized monolayer GS pores for all metals ions as per the method described earlier. By using eqn (3) we provide a biasing potential to move the molecule or ion from the bulk region through the center of each pore (z = 0 Å), to the bulk region (z = 15 Å). The biased probability of histogram data from MD simulations is post-processed using the WHAM technique, as described in eqn (4)–(7), to obtain the unbiased probability. Here we have reported the PMF profiles for single metal ion and one water molecule in an aqueous solution of 0.5 M metal solution on both sides of graphene pore.

Fig. 6 shows the PMF profiles of heavy metal ions for NPG-OH pore. In the above mentioned figures the NPG is located at z = 0 Å. The PMF profiles are almost symmetric around the NPG as environment on both sides of the NPG is same. In the PMF profiles (Fig. 6), as the metal ion moves towards the NPG pore from the bulk water, there are three distinctive minima located at 8.0 Å, 5.0 Å and center of the pore (z = 0 Å) for all the ions. The first minimum from the surface (at 5.0 Å) is known as the contact minima between the ion and NPG-OH. The second minimum (at 8.0 Å) is known as solvent layer separated minimum.50 In case of Pb2+ ion (Fig. 6) a noticeable higher energy barrier is observed around 2.5 Å and the barrier value is 4.5 kcal mol−1. There is also a second energy barrier at 6.0 Å (1.7 kcal mol−1), which is less than that observed at 2.5 Å. The position of the first energy barrier (z = 6.0 Å) and the energy value (0.5 kcal mol−1) are same for other metal ions. The second energy barrier for other ions also appears at 2.5 Å and the values are 3.7, 3.5, 4.5 and 3.5 kcal mol−1 for Cd2+, Co2+, Cu2+ and Zn2+, respectively. The higher the energy barrier, resistance to pass through the NPG pore increases. Hence, increase/decrease in the energy barrier should increase/decrease the salt rejection ability of the NPG pore. The salt rejection (see Fig. 3a) values in the presence of Cd2+, Co2+, Cu2+, Pb2+ and Zn2+ ions are 95.46, 93.31, 95.50, 99.66 and 90.35% at 500 MPa. The calculated salt rejection values clearly correlate well with the free-energy values. Among all the ions, for NPG-OH, the maximum salt rejection value is for Pb2+ for the applied pressure range (100–500 MPa). This is due to higher energy barrier for Pb2+ ion as compared to other metal ions.


image file: c6ra06817k-f6.tif
Fig. 6 PMF for metal ion (solid line) and water molecule (dashed line) as a function of its axial distance from the center of NPG-OH pore.

Fig. 6 also shows the PMF profile of a water molecule in ionic solutions for NPG-OH pore, which exhibits two minima at 3.5 and 6.0 Å from the surface. The PMF profile clearly represents two distinctive energy barriers around 2.0 and 5.0 Å from the surface. While the position of first energy barrier (2.0 Å) of a water molecule is indifferent to metal ions, the barrier vary viz., 3.0, 3.4, 3.4, 3.0 and 2.7 kcal mol−1 in the presence Cd2+, Co2+, Cu2+, Pb2+ and Zn2+ ion, respectively. The position of the second energy barrier (5.0 Å) as well as barrier value is same (0.5 kcal mol−1) for all the ionic solution. The position of the first two minima (3.5 and 6.0 Å) of water molecule is nearer to the pore in comparison to that seen for the metal ions (8.0 and 5.0 Å). The lower energy barrier for water molecule as compared to metal ions implies that the water molecule can easily passes through the pore. From the energy barrier plots we can see that the energy barrier for water is lower than that of metal ions. This shows that the water can pass through the pores very easily compared to the ions. The water molecule has higher energy barrier in the Co2+ and Cu2+ salt solutions compared to other metal ions (see Fig. 6). These results are in agreement with the behavior seen in the water flux calculations. The average water flux (see Fig. 4a) in Cd2+, Co2+, Cu2+, Pb2+ and Zn2+ solutions is 86.0, 82.0, 79.0, 87.0, 87.50 molecules ps−1 per nanopore, respectively. This shows that the water flux is higher in the presence of Zn2+ and Pb2+ ions, which is due to the lower energy barrier for water molecules, as observed in the PMF profiles. It is noted that the behavior of the PMF profiles depends on the arrangement of water molecule near the pore.

The PMF profiles of metal ions and water molecule in different ionic solutions, across NPG-N, are shown in Fig. 7. The PMF profile for all the ions considered in this study (Fig. 7) shows that there are two minima associated with the energy profile, while the ion moves towards the graphene pore from the bulk water. These two minima are located at 5.0 Å and at the center of pore (0 Å). Moreover, we can also see that there exist two distinctive energy barriers for the ion movement towards the surface at 6.0 and 2.0 Å. The first energy barrier (6.0 Å) for the Cd2+, Co2+, Cu2+, Pb2+ and Zn2+ ions in water solution is 0.6, 0.5, 0.5, 1.0 and 0.5 kcal mol−1, respectively. On the other hand, the second energy barrier, at 2.0 Å, associated with the ion movement in water Cd2+, Co2+, Cu2+, Pb2+ and Zn2+ ions is 2.0, 4.5, 4.6, 3.7 and 4.5 kcal mol−1, respectively. This analysis shows that for NPG-N the Co2+, Cu2+ and Zn2+ ion shows higher energy barrier in comparison to that seen for other metal ions in the water. The salt rejection (Fig. 3b) results are consistent with PMF profiles.


image file: c6ra06817k-f7.tif
Fig. 7 PMF for metal ion (solid line) and water molecule (dashed line) as a function of its axial distance from the center of NPG-N pore.

The PMF profiles for water molecule across NPG-N shows two minima (at 3.5 and 6.0 Å) and two energy barriers (at 5.0 Å and at the center of the pore). Unlike NPG-OH, second energy barrier observed at the center of the pore is lower, which suggests higher flux through the NPG-N in comparison to that seen for NPG-OH. The energy barrier of water molecule at 5.0 Å in the presence of all ionic solutions is around 0.5 kcal mol−1. On the other hand, the energy barriers for the water molecule at the center of the pore (0 Å) in Cd2+, Co2+, Cu2+, Pb2+ and Zn2+ ionic solutions are 4.1, 3.1, 3.1, 3.5 and 3.0 kcal mol−1, respectively. The lower energy barrier for water molecule as compared to the metal ions implies that the water molecule can easily pass through the pores. The average water flux values for the whole pressure range follow the order: 90.0, 96.50, 96.0, 95.0, 97.0 molecules ps−1 per nanopore, in the presence of Cd2+, Co2+, Cu2+, Pb2+ and Zn2+ ions, respectively. This water flux results are in agreement with the PMF results, where energy barrier for water is lowest in Pb2+ solution, and highest in Zn2+ solution.

Fig. 8 presents the PMF profiles for ions and water molecules, across NPG-F, in different ionic solutions. The behavior, position of energy barrier and energy minima, observed in PMF profiles of water and ions are qualitatively akin to that seen for NPG-N and NPG-OH. However, the order of increasing energy barrier for ions and water is different. For ions the increasing order for the energy barrier is Pb2+, Cd2+, Co2+, Cu2+ and Zn2+. In case of water the increasing order for energy barriers is Pb2+, Zn2+, Cd2+, Co2+ and Cu2+. In general, it is evident from the above that the energy barrier for water molecules is lower than that experienced by metal ions. Hence, water molecules pass through the pore with relative ease. The water flux values (see Fig. 4c) values for NPG-F are in line with PMF results. In particular, the water flux is lowest in the presence of Pb2+ ionic solution, which is in contrast to the behavior seen in NPG-N and NPG-OH. This behavior corroborates the PMF nature observed in different functionalized NPGs.


image file: c6ra06817k-f8.tif
Fig. 8 PMF for metal ion (solid line) and water molecule (dashed line) as a function of its axial distance from the center of NPG-F pore.

3.5 Energy barrier calculation using DFT

In order to validate our observations based on PMF using classical MD, we have used DFT to calculate the energy barrier for the water molecule to pass through the graphene pore functionalized with N, F and OH functional groups. We have taken the lowest energy structure among the considered three orientations in this study for interaction energy calculations. The interaction energy is calculated varying the distance of the water molecule from the graphene surface along the pore axis. The interaction energy of water molecule with the functionalized nanopore graphene is shown in Fig. 9. It is evident from the Fig. 9 that at the pore (z = 0 Å) the energy is lowest, and as the molecule move away from the surface the interaction energy increases until it reaches a distance of 5 Å beyond which the energy remains constant. This constant energy represents that there is no effect of surface on the water molecule beyond 5 Å. To calculate the energy barrier for the water molecule to pass through the pore we have taken the energy of the molecule at the pore as reference (i.e. zero). The difference between the constant energy and energy at the pore is considered as the energy barrier. The energy barriers for water molecule for the OH, N, and F functionalized graphene pores are 3.0, 1.85 and 0.57 kcal mol−1 respectively. The order of probability for the water molecule to pass through the pore, from the energy barriers obtained from the DFT calculations, is NPG-F > NPG-N > NPG-OH. These results are in agreement with the water flux results and PMF profiles of water obtained in the MD simulations, where the order of the permeability is same as observed in the DFT calculations. The flux calculations also show the same order as observed in our DFT study.
image file: c6ra06817k-f9.tif
Fig. 9 Interaction energy profiles of water molecule with the functionalized nanopore graphene as function of distance between the graphene pore and the water molecule.

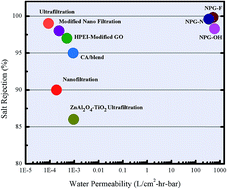
3.6 Performance comparison

Fig. 10 shows the performance comparison between hydroxyl, nitrogen and fluorine functionalized NPG and the existing technologies. The overall results show that the functionalized nanopore GS can be highly efficient for removing heavy metals from contaminated wastewater. The rejection percentage of salt is not less than 90% even at high pressures like 500 MPa. Moreover, the permeability of the water is 4–5 orders more than the existing technologies. For the case of NPG-OH we have observed very high permeability with ∼90% salt rejection percentage compared to NPG-N and NPG-F. On the other hand NPG-N has intermediate permeability with ∼100% salt rejection. However, NPG-F shows the low permeability compared to the other two NPGs considered in this study. Overall, the enhanced water permeability and salt rejection using functionalized NPG can offer important advantages over existing technologies.51,52 Reverse osmosis (RO) is considered as the most energy-efficient technique for desalination process. But the conventional polymeric membranes used in RO have lower flux rates, and also suffer from fouling and poor chemical resistance. The working pressures of existing RO process can reach up to a maximum pressure of 10 MPa[thin space (1/6-em)]53 and the reported power consumption of RO54 in the mentioned operating range is 10 kW h m−3. The power consumption is directly proportional to the operating pressure and inversely propositional to the permeability amount. The minimum operating pressure of the NPG in this study is 300 MPa, which is 30 times more than the operating pressure of RO. The permeability seen in NPG membranes is approximately 5 orders more than that of the RO process. This indicates that the power consumption in case of NPG may be six times than that of the existing RO technology. However, economical viability of NPGs at higher pressures would require an in-depth economical cost analysis, which is outside the scope of the current work.
image file: c6ra06817k-f10.tif
Fig. 10 Comparison of water permeability and salt rejection of functionalized NPG with the existing various technologies reported in literature.

4. Conclusions

MD simulations are performed to study the water transport through functionalized NPG membrane while rejecting the divalent metal ions at 100%, serving as effectively for waste water treatment. We have established that the filtration and separation performance of metal ions is most sensitive to pore size and pore chemistry of GS. Our results suggest that functionalizing the pores with hydroxyl and nitrogen might be a promising strategy because these pores yield high salt rejection with high water permeability. The mechanism of the water transport and ion rejection is explored using PMF calculations. Moreover, we have also used DFT calculations to corroborate the PMF results obtained using classical MD simulations. PMF results for NPG functionalized with different functional groups show significantly higher energy barriers for ions than that for water. This shows that the water pass through the pores more easily than the ions. The energy barrier for the water molecule is higher for NPG-OH followed by NPG-N and NPG-F which shows that the water flux will be more for NPG-F than the other two NPGs considered in this study. The water flux and PMF results obtained for water using MD simulations are also in agreement with the DFT calculations. Even at high pressures like 500 MPa the ion rejection is not less than ∼90% and the minimum permeability is ∼270 L cm−2 h−1 bar−1. These values of permeability are 4–5 orders more than the values obtained using the existing technologies with very high salt rejection. This study shows that the NPG membrane may have a valuable role to play for water purification from industrial waste.

Acknowledgements

This work is supported by the Department of Science of Technology, Government of India. The computational resources are provided by the HPC, Computer Center, Indian Institute of Technology Kanpur.

References

  1. C. Chen and X. Wang, Ind. Eng. Chem. Res., 2006, 45, 9144–9149 CrossRef CAS.
  2. Y. S. Al-Degs, M. I. El-Barghouthi, A. A. Issa, M. A. Khraisheh and G. M. Walker, Water Res., 2006, 40, 2645–2658 CrossRef CAS PubMed.
  3. A. T. Paulino, F. A. S. Minasse, M. R. Guilherme, A. V. Reis, E. C. Muniz and J. Nozaki, J. Colloid Interface Sci., 2006, 301, 479–487 CrossRef CAS PubMed.
  4. R. Naseem and S. S. Tahir, Water Res., 2001, 35, 3982–3986 CrossRef CAS PubMed.
  5. Z. Wang, P. Yin, Z. Wang, Q. Xu, R. Qu and Q. Tang, Sep. Sci. Technol., 2012, 48, 281–287 CrossRef CAS.
  6. M. A. Shannon, P. W. Bohn, M. Elimelech, J. G. Georgiadis, B. J. Marinas and A. M. Mayes, Nature, 2008, 452, 301–310 CrossRef CAS PubMed.
  7. B. E. Logan and M. Elimelech, Nature, 2012, 488, 313–319 CrossRef CAS PubMed.
  8. K. S. Spiegler and Y. M. El-Sayed, Desalination, 2001, 134, 109–128 CrossRef CAS.
  9. L. F. Greenlee, D. F. Lawler, B. D. Freeman, B. Marrot and P. Moulin, Water Res., 2009, 43, 2317–2348 CrossRef CAS PubMed.
  10. A. Zhu, A. Rahardianto, P. D. Christofides and Y. Cohen, Desalin. Water Treat., 2010, 15, 256–266 CrossRef CAS.
  11. M. Elimelech and W. A. Phillip, Science, 2011, 333, 712–717 CrossRef CAS PubMed.
  12. K. P. Lee, T. C. Arnot and D. Mattia, J. Membr. Sci., 2011, 370, 1–22 CrossRef CAS.
  13. T. Humplik, J. Lee, S. C. O'Hern, B. A. Fellman, M. A. Baig, S. F. Hassan, M. A. Atieh, F. Rahman, T. Laoui, R. Karnik and E. N. Wang, Nanotechnology, 2011, 22, 292001 CrossRef CAS PubMed.
  14. M. M. Pendergast and E. M. V. Hoek, Energy Environ. Sci., 2011, 4, 1946–1971 Search PubMed.
  15. N. Misdan, W. J. Lau and A. F. Ismail, Desalination, 2012, 287, 228–237 CrossRef CAS.
  16. J. Gascon, F. Kapteijn, B. Zornoza, V. Sebastián, C. Casado and J. Coronas, Chem. Mater., 2012, 24, 2829–2844 CrossRef CAS.
  17. P. S. Goh, A. F. Ismail and B. C. Ng, Desalination, 2013, 308, 2–14 CrossRef CAS.
  18. K. S. Novoselov, A. K. Geim, S. V. Morozov, D. Jiang, Y. Zhang, S. V. Dubonos, I. V. Grigorieva and A. A. Firsov, Science, 2004, 306, 666–669 CrossRef CAS PubMed.
  19. C. A. Merchant, K. Healy, M. Wanunu, V. Ray, N. Peterman, J. Bartel, M. D. Fischbein, K. Venta, Z. Luo, A. T. C. Johnson and M. Drndić, Nano Lett., 2010, 10, 2915–2921 CrossRef CAS PubMed.
  20. M. D. Fischbein and M. Drndić, Appl. Phys. Lett., 2008, 93, 113107 CrossRef.
  21. M. C. Lemme, D. C. Bell, J. R. Williams, L. A. Stern, B. W. H. Baugher, P. Jarillo-Herrero and C. M. Marcus, ACS Nano, 2009, 3, 2674–2676 CrossRef CAS PubMed.
  22. D.-E. Jiang, V. R. Cooper and S. Dai, Nano Lett., 2009, 9, 4019–4024 CrossRef CAS PubMed.
  23. S. Blankenburg, M. Bieri, R. Fasel, K. Müllen, C. A. Pignedoli and D. Passerone, Small, 2010, 6, 2266–2271 CrossRef CAS PubMed.
  24. S. P. Koenig, L. Wang, J. Pellegrino and J. S. Bunch, Nat. Nanotechnol., 2012, 7, 728–732 CrossRef CAS PubMed.
  25. H. Du, J. Li, J. Zhang, G. Su, X. Li and Y. Zhao, J. Phys. Chem. C, 2011, 115, 23261–23266 CrossRef CAS.
  26. K. Sint, B. Wang and P. Král, J. Am. Chem. Soc., 2008, 130, 16448–16449 CrossRef CAS PubMed.
  27. D. Cohen-Tanugi and J. C. Grossman, Nano Lett., 2012, 12, 3602–3608 CrossRef CAS PubMed.
  28. B. Konkena and S. Vasudevan, J. Phys. Chem. Lett., 2012, 3, 867–872 CrossRef CAS PubMed.
  29. E.-Y. Choi, T. H. Han, J. Hong, J. E. Kim, S. H. Lee, H. W. Kim and S. O. Kim, J. Mater. Chem., 2010, 20, 1907–1912 RSC.
  30. A. K. Mishra and S. Ramaprabhu, Desalination, 2011, 282, 39–45 CrossRef CAS.
  31. P. Sun, F. Zheng, M. Zhu, Z. Song, K. Wang, M. Zhong, D. Wu, R. B. Little, Z. Xu and H. Zhu, ACS Nano, 2014, 8, 850–859 CrossRef CAS PubMed.
  32. D. Konatham, J. Yu, T. A. Ho and A. Striolo, Langmuir, 2013, 29, 11884–11897 CrossRef CAS PubMed.
  33. D. Vanderbilt, Phys. Rev. B: Condens. Matter Mater. Phys., 1990, 41, 7892–7895 CrossRef.
  34. D. Marx and J. Hutter, Ab initio molecular dynamics: basic theory and advanced methods, Cambridge University Press, Cambridge, 2009 Search PubMed.
  35. CPMD, Journal.
  36. S. Plimpton, J. Comput. Phys., 1995, 117, 1–19 CrossRef CAS.
  37. W. L. Jorgensen, J. Chandrasekhar, J. D. Madura, R. W. Impey and M. L. Klein, J. Chem. Phys., 1983, 79, 926–935 CrossRef CAS.
  38. W. L. Jorgensen, D. S. Maxwell and J. Tirado-Rives, J. Am. Chem. Soc., 1996, 118, 11225–11236 CrossRef CAS.
  39. B. Roux, Comput. Phys. Commun., 1995, 91, 275–282 CrossRef CAS.
  40. M. Souaille and B. Roux, Comput. Phys. Commun., 2001, 135, 40–57 CrossRef CAS.
  41. L. Martínez, R. Andrade, E. Birgin and J. Martínez, J. Comput. Chem., 2009, 30, 2157–2164 CrossRef PubMed.
  42. W. G. Hoover, Phys. Rev. A, 1985, 31, 1695–1697 CrossRef.
  43. S. Nosé, J. Chem. Phys., 1984, 81, 511–519 CrossRef.
  44. B. Corry, J. Phys. Chem. B, 2008, 112, 1427–1434 CrossRef CAS PubMed.
  45. B. Mi, Science, 2014, 343, 740–742 CrossRef CAS PubMed.
  46. R. R. Nair, H. A. Wu, P. N. Jayaram, I. V. Grigorieva and A. K. Geim, Science, 2012, 335, 442–444 CrossRef CAS PubMed.
  47. M. Hu and B. Mi, Environ. Sci. Technol., 2013, 47, 3715–3723 CrossRef CAS PubMed.
  48. R. K. Joshi, P. Carbone, F. C. Wang, V. G. Kravets, Y. Su, I. V. Grigorieva, H. A. Wu, A. K. Geim and R. R. Nair, Science, 2014, 343, 752–754 CrossRef CAS PubMed.
  49. O. Akhavan and E. Ghaderi, ACS Nano, 2010, 4, 5731–5736 CrossRef CAS PubMed.
  50. Z. Xu, X. Yang and Z. Yang, J. Phys. Chem. B, 2008, 112, 13802–13811 CrossRef CAS PubMed.
  51. M. A. Barakat, Arabian J. Chem., 2011, 4, 361–377 CrossRef CAS.
  52. F. Fu and Q. Wang, J. Environ. Manage., 2011, 92, 407–418 CrossRef CAS PubMed.
  53. K. A. Mahmoud, B. Mansoor, A. Mansour and M. Khraisheh, Desalination, 2015, 356, 208–225 CrossRef CAS.
  54. R. Dashtpour and S. N. Al-Zubaidy, Int. J. Environ. Sci. Dev., 2012, 3, 339–345 CAS.

This journal is © The Royal Society of Chemistry 2016