DOI:
10.1039/C6RA06774C
(Paper)
RSC Adv., 2016,
6, 78335-78350
Facile fabrication of highly efficient modified ZnO photocatalyst with enhanced photocatalytic, antibacterial and anticancer activity†
Received
14th March 2016
, Accepted 5th July 2016
First published on 17th August 2016
Abstract
The degradation of organic pollutants in the aqueous medium using semiconductor photocatalysts has become an attractive method for detoxification of water. ZnO is an efficient photocatalyst with few disadvantages such as: (i) the wide band gap (3.37 eV); and (ii) the fast recombination rate of photogenerated electron–hole pairs which limit the photodegradation efficiency of bare ZnO photocatalyst. Herein, we report a strategy for the suppression of electron–hole pair recombination rate, extention the absorption edge in the visible region and enhancement of photocatalytic efficiency by introducing rare earth metal as a dopant. We present the fabrication of pure and Er/Nd doped ZnO semiconductor photocatalysts with hexagonal wurtzite structure using sol gel method. The prepared photocatalysts were characterized by standard analytical techniques, such as XRD, SEM-EDS, TEM, FTIR, XPS, BET, TGA, DTA, DSC, PL, DRS and UV-vis spectroscopy. The photocatalytic activity of pure and doped ZnO nanoparticles (NPs) was investigated by studying the degradation of two different organic dyes as a function of irradiation time. The results indicate that the photocatalytic activity of doped ZnO was found to be higher than bare ZnO for degradation of dyes. This may be attributed predominantly due to decrease in the recombination rate by the efficient charge separation of photoinduced electron–hole pair as inferred from PL studies. The results also indicate that parameters such as amount of photocatalyst dose, initial pH and different quenchers play a significant role for degradation of model dyes. The synthesized photocatalyst was recycled four times for degradation of dye with very little decrease in efficiency. Interestingly, comparative in vitro antibacterial and anticancer potential of the pure and Er/Nd doped ZnO NPs were also investigated against human pathogenic bacterial strains and various human cancer cell lines. The result of our study clearly revealed that Nd doped ZnO NPs showed better antibacterial as well as anticancer efficacy as compared to pure and Er doped ZnO NPs.
1. Introduction
Water pollution from different sources such as agricultural run-off, effluent from dyes & pesticides industries and chemical spill are major concern all over the world.1 Due to the development of new methods for dyeing textile, paper and pulp, a large amount of harmful waste containing dyes are continuously released into the water system. Most dyes contain a high degree of aromaticity, substituted with azo (–N![[double bond, length as m-dash]](https://www.rsc.org/images/entities/char_e001.gif) N) and hydroxyl (–OH) groups which are non-biodegradable.2 These dyes are polluting water and hazardous to health. Therfore, it is important to develop techniques which are helpful for their remediation. The techniques such as flocculation, precipitation, adsorption, physicochemical, biological and sedimentation for the degradation of dyes/organic pollutants from water bodies are not fully effective because they do not completely degrade the pollutants.3 Hence, there is a vital need to develop a new clean and ecofriendly technique for treating such environmental pollutants.4 The degradation of organic dyes in aqueous phase using advanced oxidation processes (AOPs) is an efficient approach. Purification of waste water using photocatalysis is one of the most widely used AOPs.5
N) and hydroxyl (–OH) groups which are non-biodegradable.2 These dyes are polluting water and hazardous to health. Therfore, it is important to develop techniques which are helpful for their remediation. The techniques such as flocculation, precipitation, adsorption, physicochemical, biological and sedimentation for the degradation of dyes/organic pollutants from water bodies are not fully effective because they do not completely degrade the pollutants.3 Hence, there is a vital need to develop a new clean and ecofriendly technique for treating such environmental pollutants.4 The degradation of organic dyes in aqueous phase using advanced oxidation processes (AOPs) is an efficient approach. Purification of waste water using photocatalysis is one of the most widely used AOPs.5
Recently, semiconductor based heterogeneous photocatalysis has attracted strong attention for the degradation of pollutants via photo-splitting of water using renewable solar energy.1,6,7 The reactive species generated can also kill microorganisms. Many semiconductor based heterogeneous photocatalysts, such as SnO2, Bi2O3, WO3, TiO2 and ZnO have been used.8–10 Among the various semiconductor photocatalysts ZnO and TiO2 are known as excellent photocatalysts for waste water treatment.11,12 TiO2 is universally recognized, extensively investigated and widely employed as the most active photocatalyst. ZnO is a suitable alternative to TiO2 due to its high reactivity, higher volume to area ratio, large excitation binding energy (60 meV), environmentally friendly nature, low cost and long life span.4,13,14 ZnO is an n-type II–VI semiconductor and has a wurtzite structure.15 However, the practical application of ZnO is restricted to UV-light due to its wide band gap and fast recombination rate of photogenerated charge carrier.16 Therefore, extensive researches are being carried out for the improvement of electrical and optical properties of bare ZnO. Development of solar light driven ZnO can effectively be carried out by doping with nonmetals, metals, metal oxides, and carbon materials.17–20 During doping process the higher valency metal ions can replace the Zn2+ ions in the ZnO lattice.12,15,21,22 Recently, doping of ZnO with rare earth metals has attracted much attention due to the f orbital that allows adsorption of more pollutants on the catalyst surface reducing the band gap energy which may in turn improve the photocatalytic activity. Rare earth metals have good ability to trap the photogenerated charge carrier and reduce the recombination rate, which may intern increase the photocatalytic activity of doped ZnO.23 Among them Er and Nd doped ZnO have attracted strong attention due to the optical intra-4f transition which can cause an emission at 1.54 μm with minimum loss in optical communication.24
A wide range of methods have been employed for the preparation of doped ZnO photocatalysts, such as autocombustion, co-precipitation, solvothermal processes, precipitation and ball-milling.25–29 However, these methods are expensive as they require complex equipment. Currently, synthesis of metal doped ZnO photocatalysts using sol–gel process has attracted considerable attention because of its acceptable costs, simplicity, simple experimental conditions, good crystalline quality and easy to handle.30 This method is also helpful for synthesis of ZnO with different morphologies, various sizes and higher surface area. The photocatalytic activity also depends upon the size and shape of fabricated ZnO. Controlling the morphology of ZnO can increase the photodegradation rate of pollutants.31 Herein, we report the synthesis of pure and Er/Nd doped ZnO NPs using sol gel method. The characterization of the synthesized materials was carried out using standard analytical techniques, such as X-ray diffraction analysis (XRD), scanning electron microscopy (SEM), electron dispersive X-ray spectroscopy (EDS), transmission electron microscopy (TEM), UV-vis spectroscopy, UV-vis diffuse-reflection spectroscopy (DRS), Fourier transformed infrared spectroscopy (FTIR), differential thermal analysis (DTA), thermo gravimetric analysis (TGA), differential scanning calorimetry (DSC), Brunauer–Emmett–Teller (BET), X-ray photoelectron spectroscopy (XPS) and photoluminescence (PL). The photocatalytic activity of the prepared photocatalyst was tested by studying the degradation of two different organic dyes under visible light illumination. In addition, we have also studied the antibacterial and anticancer activity of the prepared materials against human pathogenic bacterial strains and various human cancer cell lines.
2. Experimental section
2.1 Reagents and chemicals
Zinc acetate dihydrate was purchased from Sigma-Aldrich. Reactive Red 241 (RR 241) was supplied by Atul India Ltd. Valsad, Gujrat, India. Triton-X, nitric acid (HNO3, 98wt%), sodium hydroxide (NaOH), isopropanol (IPA), potassium iodide (KI) and ammonium solution were obtained from Merck, while erbium nitrate hexahydrate, neodymium nitrate hexahydrate Methylene Blue (MB) were purchased from Central Drug House, India. Benzoquinone (BQ) was obtained from Alfa Aesar.
2.2 Preparation of pure and doped ZnO NPs
All reagents were of analytical grade and used without further purification. Doped ZnO NPs were prepared by sol gel method using zinc acetate dihydrate as a precursor and erbium nitrate hexahydrate/neodymium nitrate hexahydrate as dopants. In a typical procedure 6 g, 0.023 M of zinc acetate dihydrate and 5 mL Triton-X were dissolved in 50 mL double distilled water in a round bottom flask under vigorous stirring for 60 min at room temperature to form a transparent solution. To the above solution, the desired mole percent of dopants in ammonium solution was added drop wise. The solution was stirred continuously at 40 °C until the formation of a white gel. The obtained gel was left for 24 h, which was filtered and washed thoroughly with water and ethanol. The obtained material was dried at 120 °C for 2 h in an oven and then manually ground into a fine powder and calcinated at 600 °C for 4 h. The pure ZnO NPs were fabricated using the same method without the addition of dopant. The formation of ZnO NPs can be explained by the chemical reaction given below.| | |
Zn(CH3COO)2·2H2O + 4NH4OH → Zn(NH3)42+ + 2CH3COOH + 6H2O
| (1) |
| | |
Zn(NH3)42+ + 2OH− → ZnO + 4NH3 + H2O
| (2) |
2.3 Characterization
XRD analysis of the fabricated samples were carried out with a Shimadzu diffractometer (model 6100) with Cu Kα radiations (λ = 1.5418 Å) operated at a voltage of 30 kV and current of 15 MA in the 2θ range of 20–80°. A JEOL JSM-6510 scanning electron microscope (SEM) was used to study the surface morphology and elemental analysis of pure and doped ZnO NPs. The optical properties of the prepared NPs were characterized using UV-vis absorption spectroscopy and UV-vis diffuse-reflection spectroscopy with a Perkin Elmer spectrophotometer (λ = 35). FTIR spectra of the fabricated NPs were recorded in KBr powder as a reference at room temperature using a Perkin-Elmer Spectrum 2 in the range 400–4000 cm−1. PL spectra of the prepared materials were recorded using Hitachi (F-2700). A Xe lamp was used as the excitation source during PL study and PL spectra was performed at an excitation wavelength of 290 nm. Thermal analysis (TGA/DTA) measurement of the prepared NPs was done using Shimadzu (model 60H) and DSC using Shimadzu (model 60). X-ray photoelectron spectroscopy (XPS) was carried out by a PHI VersaProbe II with AES photoelectron spectrometer. The Brunauer–Emmett–Teller (BET) analysis was done using Quantachrome Autosorb Automated Gas Sorption System Instruments.
2.4 In vitro antibacterial studies
2.4.1 Bacterial strain. The bacterial strains used for screening were Gram negative Escherichia coli (American Type Culture Collection (ATCC)® 25922™; ATCC, Manassas, VA, USA), Gram positive Listeria monocytogene (Microbial Type Culture Collection Gene Bank (MTCC)® 657™; MTCC, IMTECH, Chandigarh, India) and Staphylococcus aureus (ATCC 25923). The E. coli strain was cultured in Luria Bertani broth while L. monocytogene and S. aureus were cultured in a brain heart infusion broth medium for 12–18 hours at 37 °C.
2.4.2 Agar well diffusion assay. The antibacterial potential of the pure and doped ZnO NPs were evaluated using agar well diffusion method.32 The inoculum was prepared by diluting the overnight cultures with sterile normal saline to a 0.5 McFarland standard. The agar petri plates were prepared by spreading the 1 × 10⁷ CFU per 50 μL of mature broth culture of specific bacterial strains with a sterile L-shaped glass rod. The well of 8 mm was created in each petri-plate with the help of sterile yellow tips. Various formulations of ZnO suspended in sterile phosphate buffer saline was used to evaluate the antibacterial activity. The experimental procedure was performed under sterile conditions using bio-safety level 2 (BSL-2) hoods and petri plates incubated at 37 °C for 12–18 h. The susceptibility of our formulation was determined on the basis of diameter of the zone of inhibition against human pathogenic strain E. coli, S. aureus and L. monocytogene. The inhibition zone was measured in triplicate with various forms of ZnO NPs, the average of the three was calculated for the antibacterial activity and compared with the reference drug gentamicin as a control.
2.5 In vitro cell viability analysis by MTT assay
2.5.1 Cell culture. Human breast cancer cell line (MDA-MB-231), human liver cancer cell line (Hep3B) and human cervical cancer cell line (HeLa) were used in the present study and cell lines were procured from the Cell Repository – National Centre for Cell Science, Pune (India). Cell lines were cultured in the Roswell Park Memorial Institute (RPMI) 1640 culture medium supplemented with 10% heat inactivated fetal bovine serum (FBS) and 0.5% antibiotic antimycotic solution (Sigma-Aldrich Co, St Louis, MO, USA) at 37 °C in a humidified incubator maintaining 5% CO2.
2.5.2 MTT assay. The anticancer potential of the pure and Nd/Er doped ZnO NPs were determined using 3-(4,5-dimethylthiazol-2-y1)-2,5-diphenyltetrazolium bromide (MTT) assay. MTT is a colorimetric assay, which is based on the ability to cleave the tetrazolium ring of the MTT using the mitochondrial dehydrogenase enzyme in viable cells to form insoluble formazan crystals, which deposits in living cells. This insoluble formazan is then dissolved by addition of a suitable solvent into a purple colored solution. The absorbance of this colored solution can be measured at 570 nm.33 The amount of formazan crystal product is directly proportional to the number of living cells.
2.6 Photocatalytic performance
The photocatalytic activity of the prepared samples was evaluated by studying the degradation of an aqueous solution of two different organic dyes (RR-241 and MB) under visible light illumination using (500 W) tungsten halogen linear lamp as a light source. In a typical procedure, required amount of photocatalyst was added to 200 mL of an aqueous solution of dyes such as RR-241 (14 ppm) or MB (10 ppm) in the immersion well photochemical reactor. Prior to illumination, the solution was first ultrasonicated for 10 min and then stirred in the presence of photocatalyst in the dark for 15 min to ensure the establishment an adsorption–desorption equilibrium. In order to maintain the temperature (20 ± 0.5 °C) of dye solution to minimize the effects of heating, the photoreactor was surrounded by refrigerated flowing water. The zero time reading was given to a blank solution kept in the dark, but otherwise treated similarly to the irradiated solution. At a given time interval 5 mL suspension was withdrawn and centrifuged at 4000 rpm for 30 min to remove the photocatalyst powder completely. The photocatalytic degradation of RR-241 and MB dyes were monitored using a Perkin Elmer (Lamda 35) spectrophotometer.
3. Results and discussion
3.1 XRD analysis
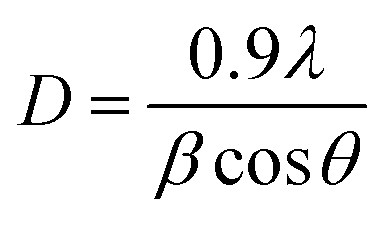
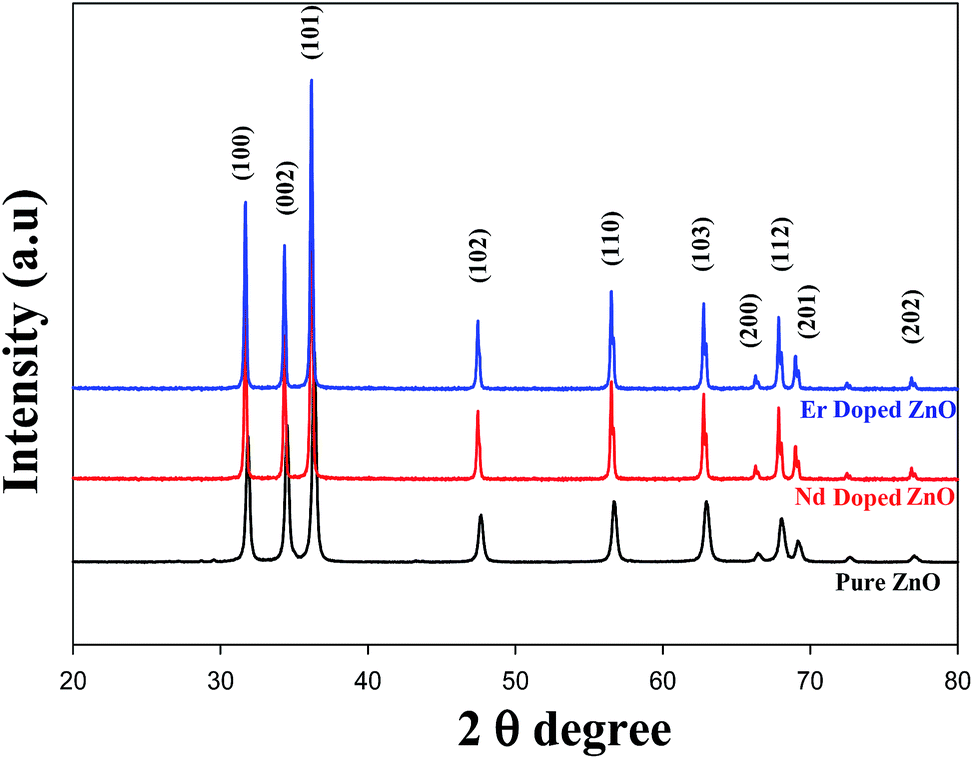
The crystal structure of fabricated NPs was investigated by powder X-ray diffraction analysis. Fig. 1 displays the XRD patterns of pure and Er/Nd doped ZnO calcinated at 600 °C for 4 h. The peaks at 31.80, 35.2, 36.9, 47.50, 56.50, 62.80, 66.20, 67.80, 69.10, 78.20 could be indexed to (100), (002), (101), (102), (110), (103), (200), (112), (201) and (202) crystal planes of hexagonal wurtzite ZnO (P63mc, a = 3.1495, c = 5.106), respectively.34,35 The XRD patterns of doped ZnO exhibit the same pattern as pure ZnO indicating that the products are in a pure hexagonal phase. The XRD analysis also indicate that there is no change in the crystal structure upon doping.36 Furthermore, all diffraction peaks are intense and sharp, indicating that the prepared NPs are in crystalline nature without any amorphous phase.4,37 The average crystallite size of pure and Er/Nd doped ZnO was estimated by Debye Scherer formula:| |
 | (3) |
where D is the crystallite size, λ is the X-ray wavelength (0.154 nm), θ is the Bragg diffraction angle and β is the full width at half maximum (FWHM). The crystallite size of pure and doped ZnO NPs were calculated using the most intense peak (101). The crystallite size of doped ZnO was found to be smaller than that of the pure ZnO as given in Table 1. The decrease in crystallite size of Er/Nd doped ZnO is mainly due to the formation of Er–O–Zn or Nd–O–Zn linkages on the surface of the doped samples, which may hinder the growth of ZnO particles to some degree.15,38
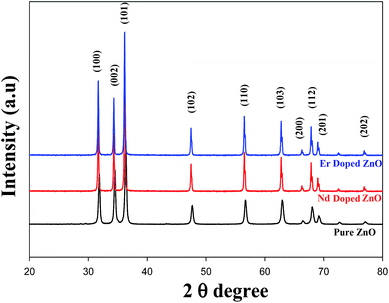 |
| | Fig. 1 XRD pattern of pure and Er/Nd doped ZnO NPs. | |
Table 1 Crystallite size of pure and doped ZnO NPs with different dopant concentrations
| S. No. |
Dopant concentration (Er)/crystallite size (nm) |
Dopant concentration (Nd)/crystallite size (nm) |
| 1 |
00/21.25 |
00/21.25 |
| 2 |
1.0/14.21 |
0.5/13.52 |
| 3 |
3.0/13.43 |
1.0/12.32 |
| 4 |
5.0/12.23 |
1.5/11.54 |
| 5 |
7.0/12.12 |
2.0/10.23 |
| 6 |
|
2.5/9.45 |
3.2 FTIR analysis
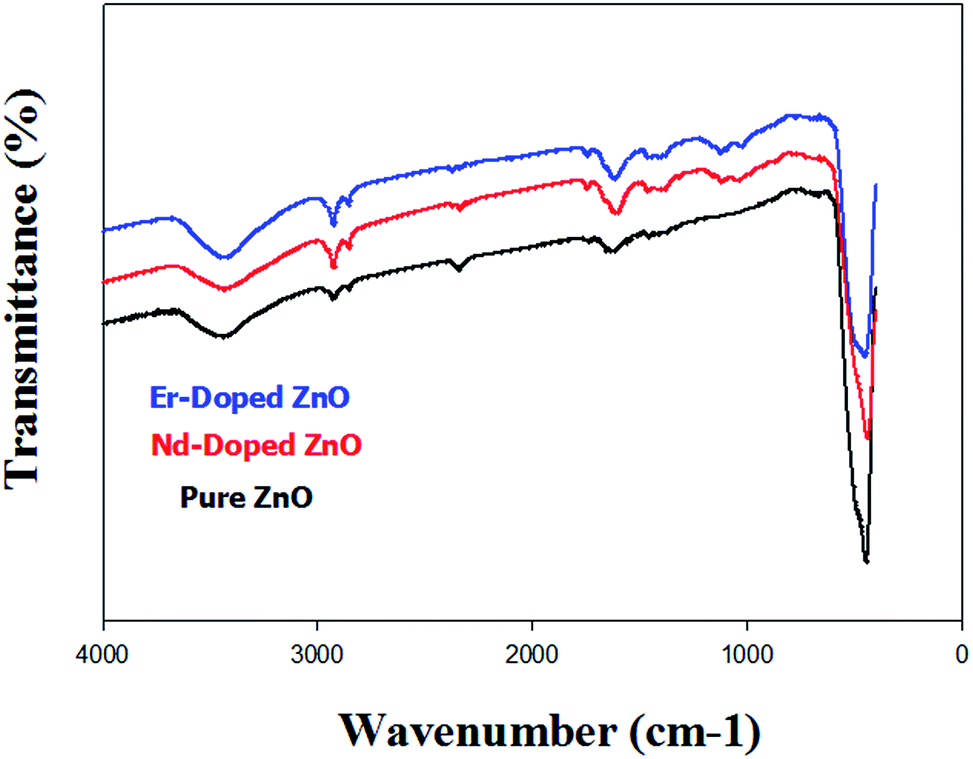
To confirm the nature of the reaction intermediate and identification of various functional groups which participate in the formation of ZnO NPs, FTIR analysis was carried out in the wavenumber range 400 to 4000 cm−1 using KBr powder at room temperature as shown in Fig. 2. The peaks below 500 cm−1 was assigned to the stretching vibration of Zn–O.39 The stretching vibration corresponds to the bond between dopant and oxygen (Nd/Er–O) may appear between 948 and 1113 cm−1 (ref. 15, 40 and 41). A sharp absorption band at 1623 cm−1 in the higher energy region was ascribed to O–H bending vibration.39 The ZnO surface contains hydroxyl groups and water molecules either chemisorbed or physisorbed as confirmed by the broad absorption band at around 3440 cm−1.42 The peaks at 2920 and 2842 cm−1 correspond to the –CH– stretching band which belongs to Triton-X.39,43 The sharp peak at 2332 cm−1 shows atmospheric CO2 absorbed on the metal cation.15,44
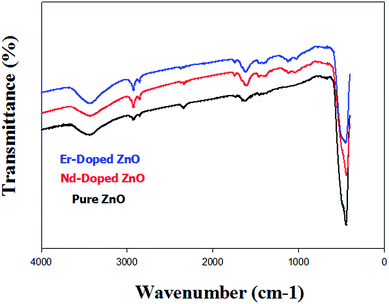 |
| | Fig. 2 FTIR Spectra of pure and Er/Nd doped ZnO NPs. | |
3.3 Optical properties and band gap
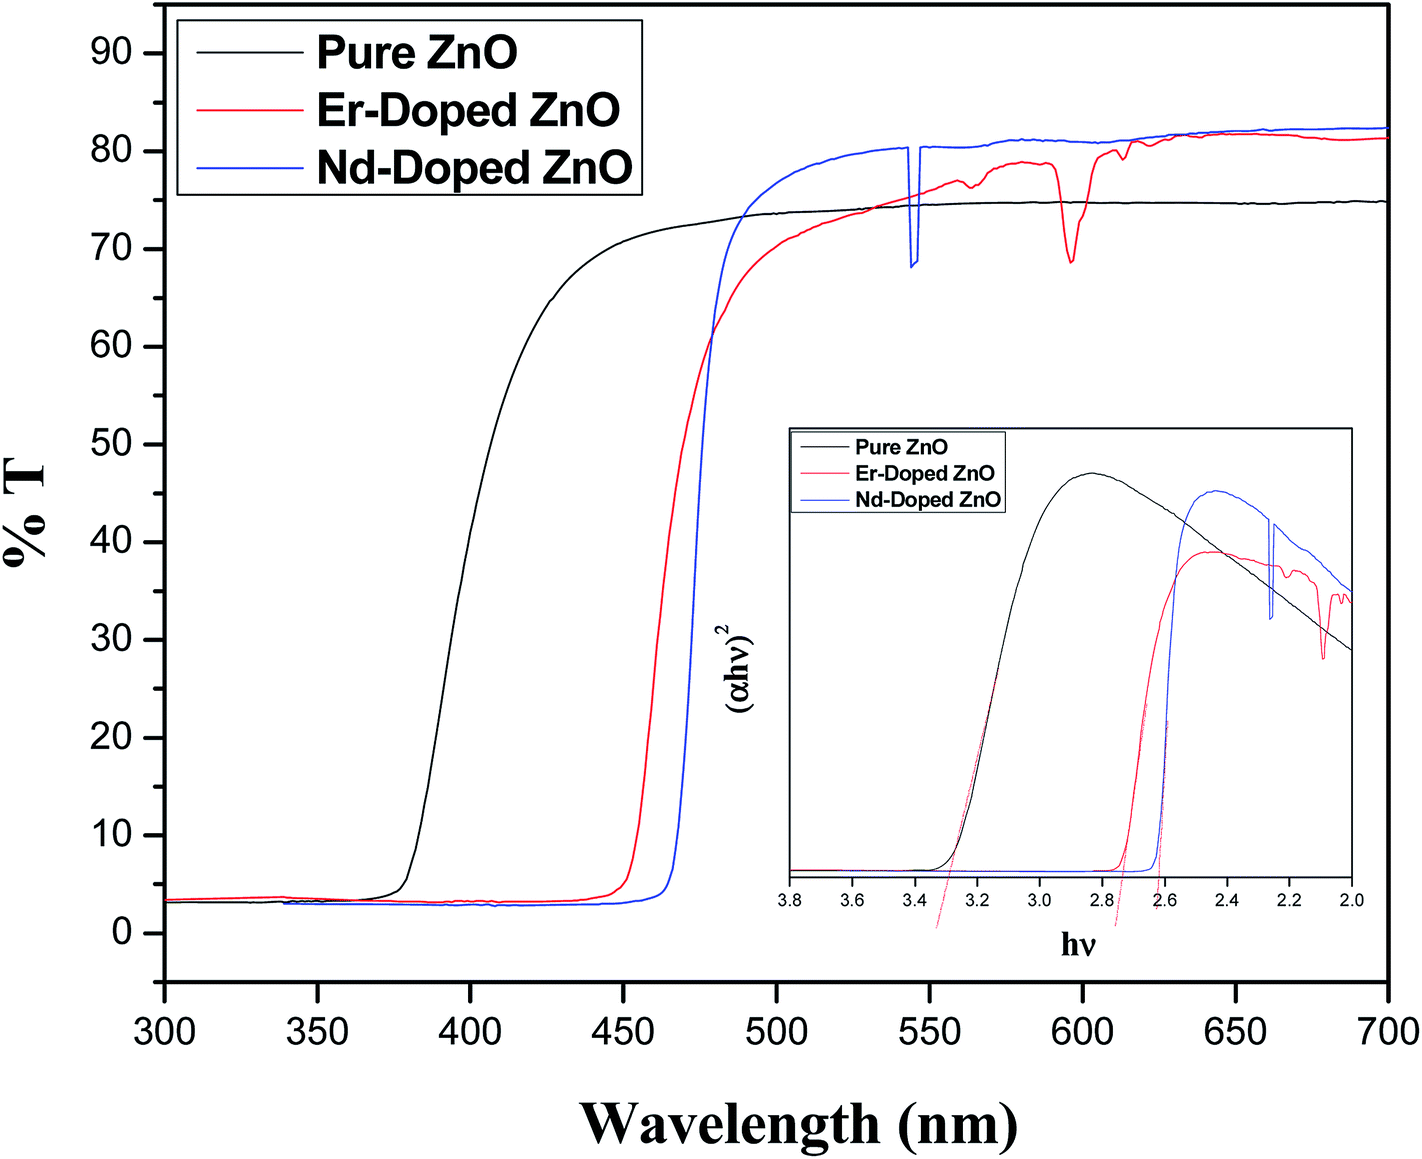
The optical characterization of the synthesized material was done using UV-vis diffuse reflectance spectroscopy (DRS). DRS is a good technique for examining the light harvesting ability of synthesized hexagonal semiconductor photocatalysts.45,46 Fig. 3 presents the DRS spectra of fabricated pure and Er/Nd doped ZnO NPs. A strong absorption at 372 nm in the UV region corresponding to pure ZnO may be due to band to band transitions.47,48 The Er/Nd doped ZnO NPs showed the broad absorption near 452 and 465 nm in the visible region. The band gap energy of pure and Er/Nd doped ZnO NPs was calculated by eqn (4),49where α, ν, Eg, and A are the absorption coefficient, light frequency, band gap, and a constant, respectively. Moreover, n depends on the characteristics of the transition in a semiconductor for direct transition n = 1 and for indirect transition n = 4. The value of n for ZnO was 1 due to direct transition.50 The band gap energy of pure and doped ZnO NPs is calculated from the plot between (αhν)2 vs. photon energy (hν). As seen from the inset in Fig. 3 the band gap of pure ZnO was found to be 3.3, while the band gap of Er and Nd doped ZnO was 2.74 and 2.66, respectively. These results are consistent with previous results.51–55 The band gap energy was found to decrease from 3.37 to 2.66 after doping, which may be due to increased defects introduced by Er and Nd doping or substitutional impurity located in the lattice position of ZnO.56 A higher defect makes the electronic transitions from the filled valence band to the energy level of the defect more probable than the transitions to the conduction band.57
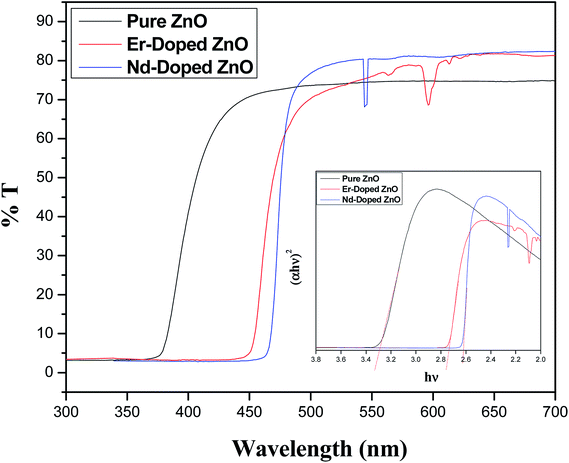 |
| | Fig. 3 UV-vis diffuse reflectance (DRS) spectra and the inset of the figure shows the plots of (αhν)2 vs. photon energy (hν) for pure and Er/Nd doped ZnO NPs. | |
3.4 Material morphology analysis (SEM-EDS and TEM)
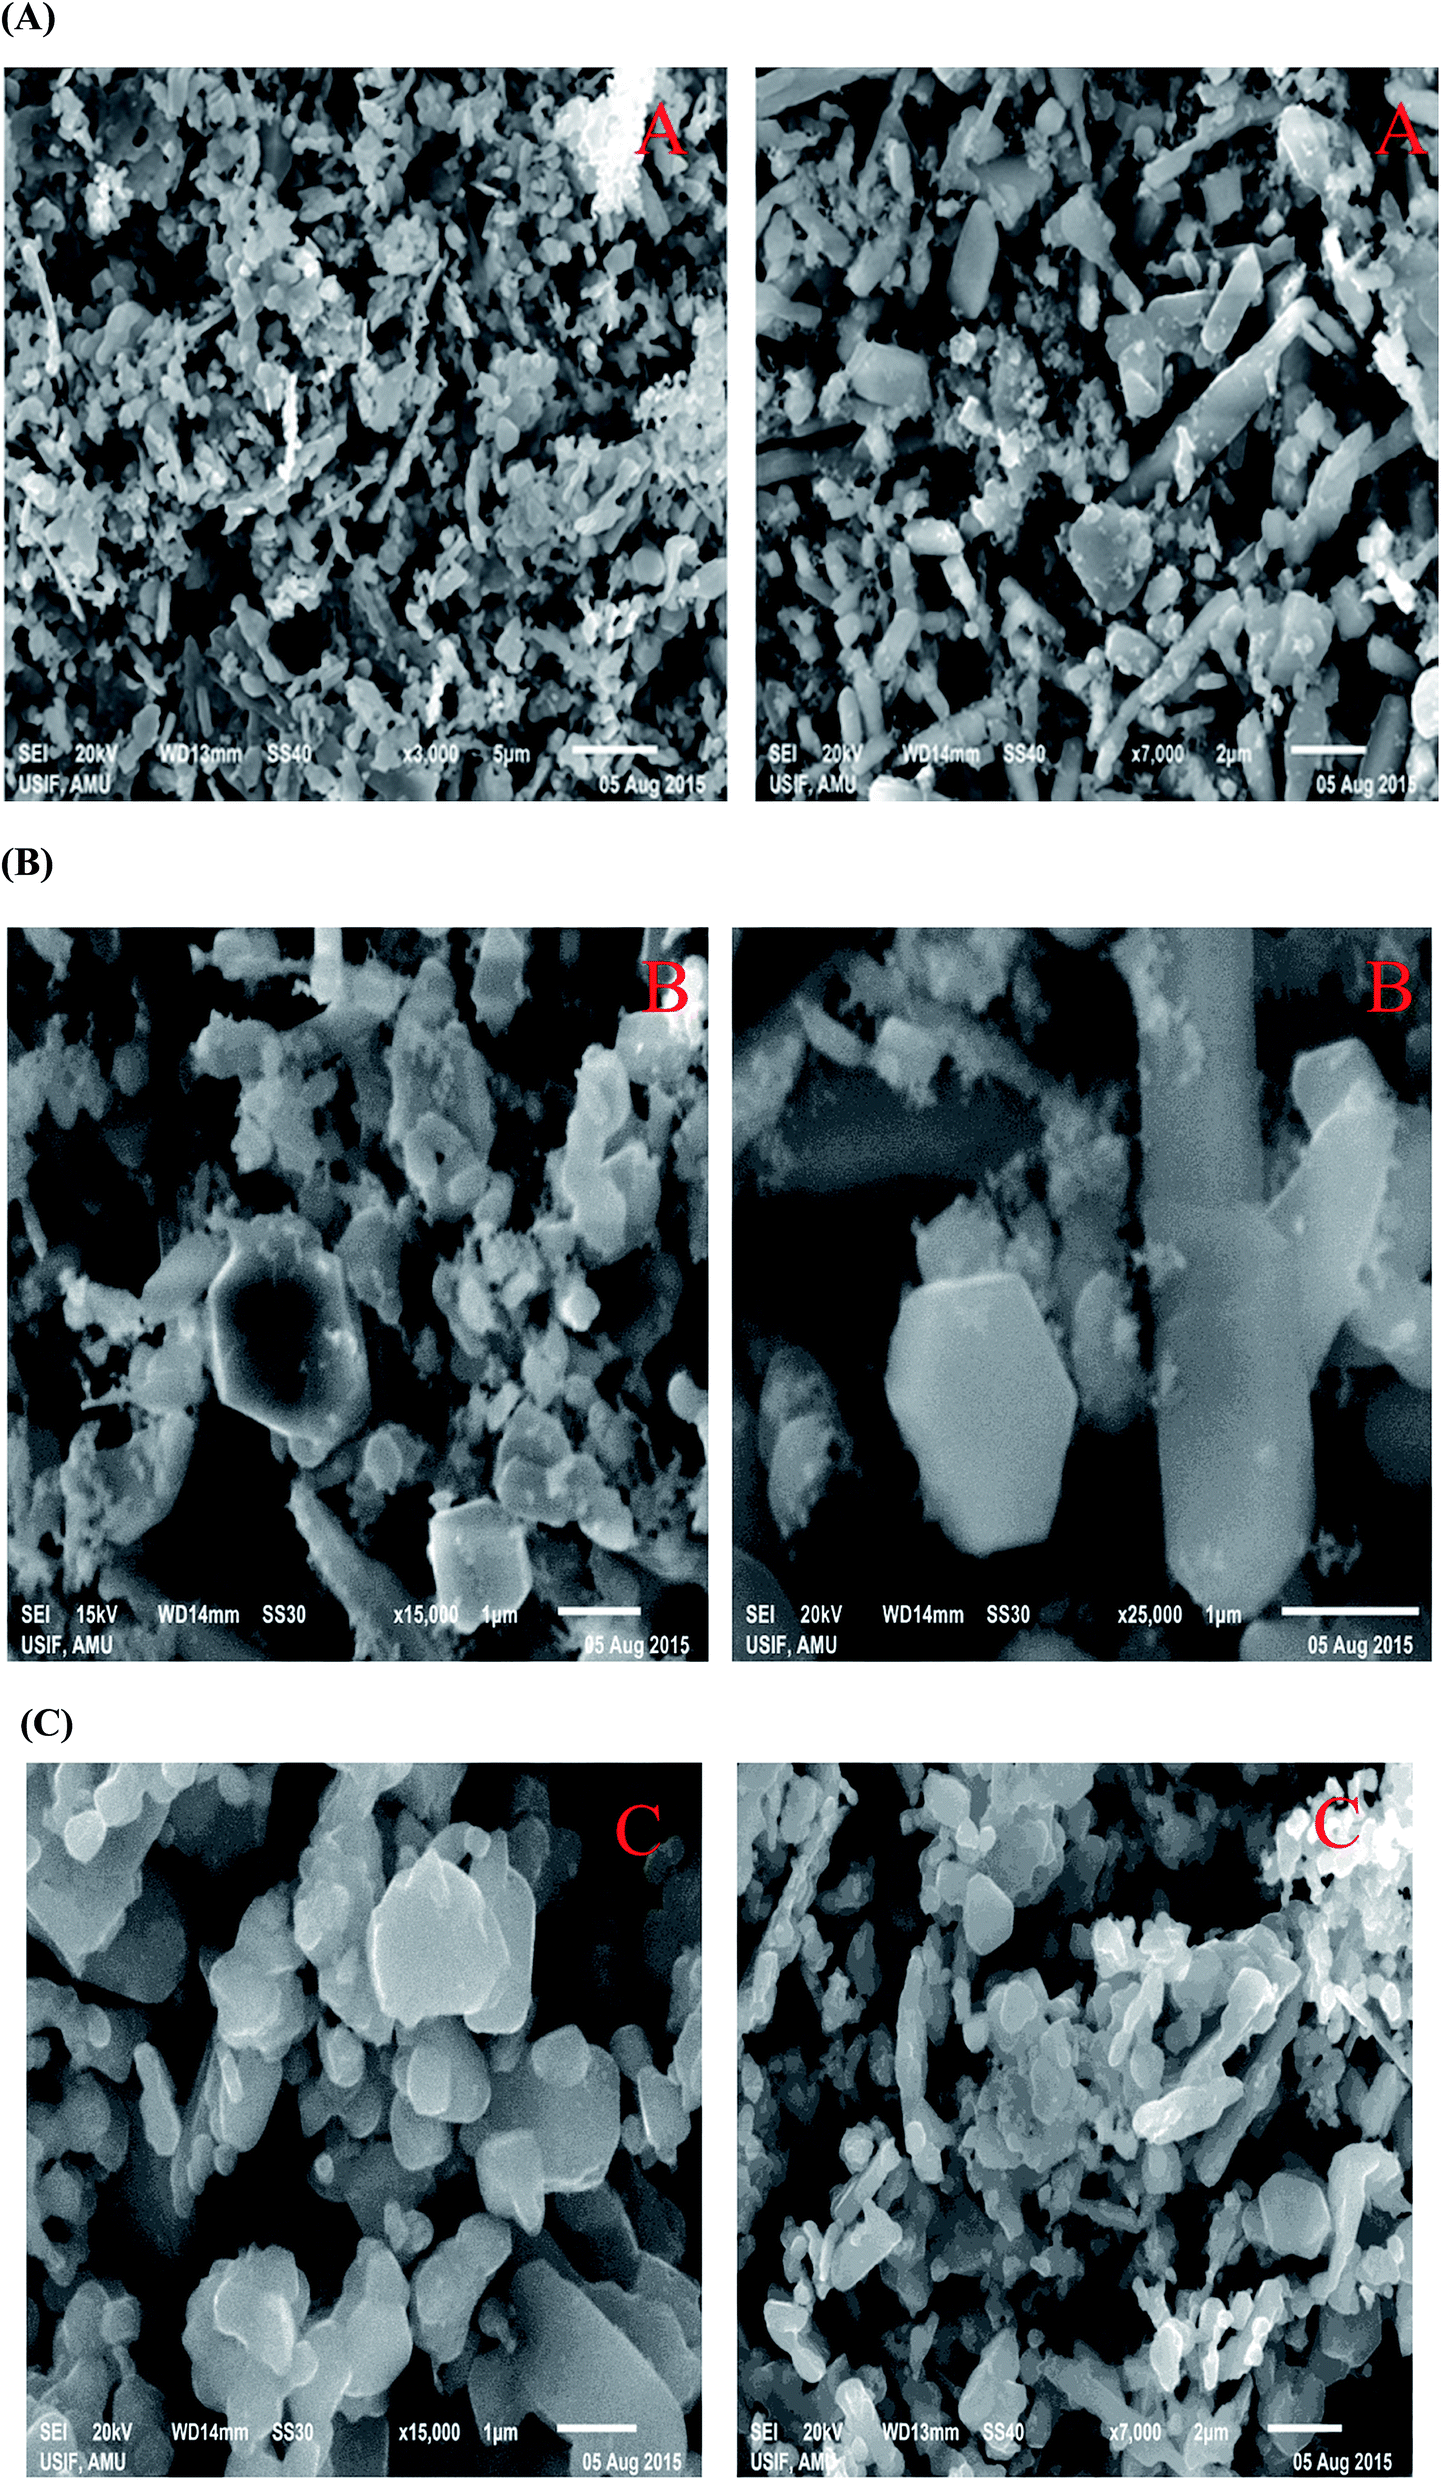
The morphology of pure and Er/Nd doped ZnO NPs calcinated at 600 °C for 4 h were investigated by SEM as shown in Fig. 4A–C. We could see that pure and Er/Nd doped ZnO form hexagonal rod-like structures with the aggregation of prepared ZnO NPs possessing non-uniform morphology lying on top of one another. After doping with different concentrations of Er and Nd the surface becomes rough, implying the deposition of Er and Nd on the surface of ZnO. Dopants also decrease the aggregation of NPs. The grain size of doped NPs was gradually decreased as the dopant concentration increased. As the crystallite size decreases upon doping, the aggregation of NPs also decreases which lead to an increase in surface area.
 |
| | Fig. 4 (A–C) SEM image of (A) pure ZnO, (B) Er-doped ZnO, and (C) Nd-doped ZnO NPs. | |
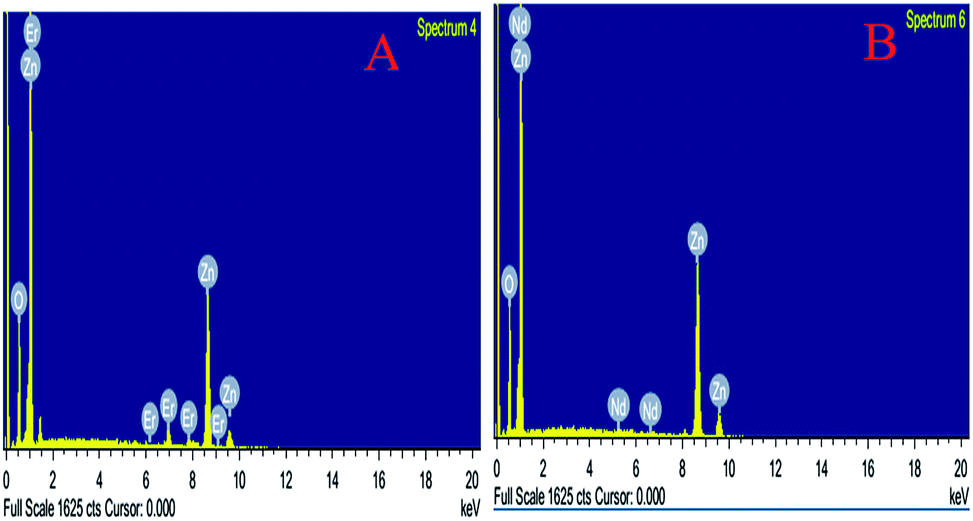
The percentage of doping in ZnO NPs was confirmed by EDS analysis, the results are illustrated in Fig. 5A and B which indicate the existence of Nd and Er metal ions in the ZnO lattice. The atomic ratio of Nd and Er in ZnO was measured from EDX and found to be 1.75% and 4.55%, respectively. The figures also show the presence of Zn, O, Er and Nd demonstrating that erbium and neodymium ions are successfully doped into the ZnO NPs.
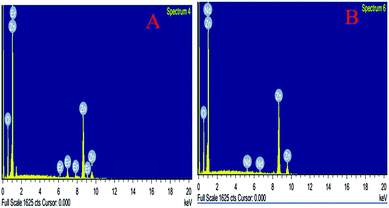 |
| | Fig. 5 (A and B) EDS image of (A) Er-doped ZnO, and (B) Nd-doped ZnO NPs. | |
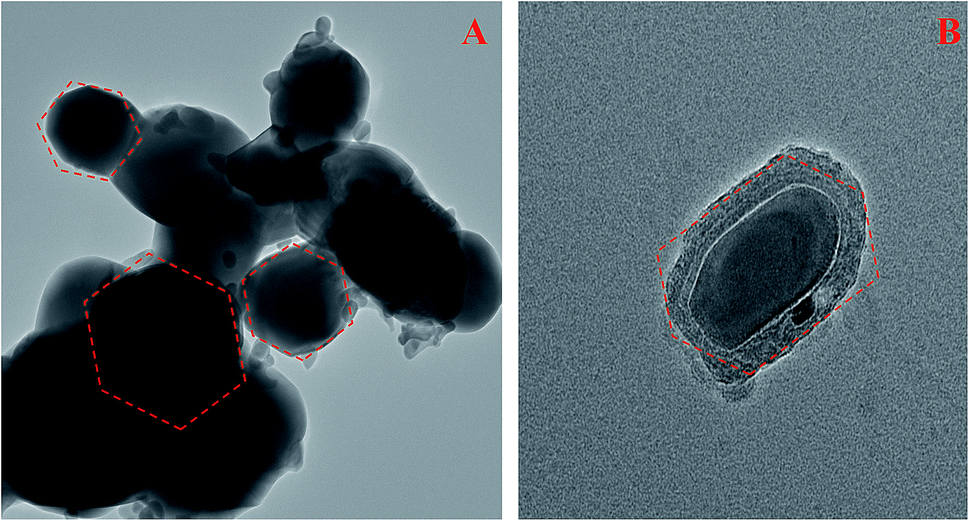
The surface morphology and particle size of pure and doped ZnO NPs were further analyzed by TEM as shown in Fig. 6A and B. TEM images of prepared ZnO NPs clearly indicate the hexagonal rod like structure. The average particle size of doped NPs was found to be in the range between 9 to 30 nm. Small particles on the surface may be due to the presence of dopants.
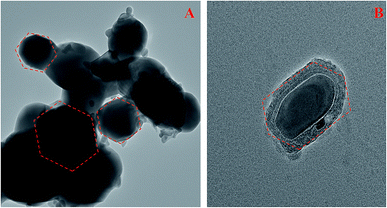 |
| | Fig. 6 (A and B) TEM image of (A) Er-doped ZnO, and (B) Nd-doped ZnO NPs. | |
3.5 X-ray photoenergy spectroscopy (XPS)
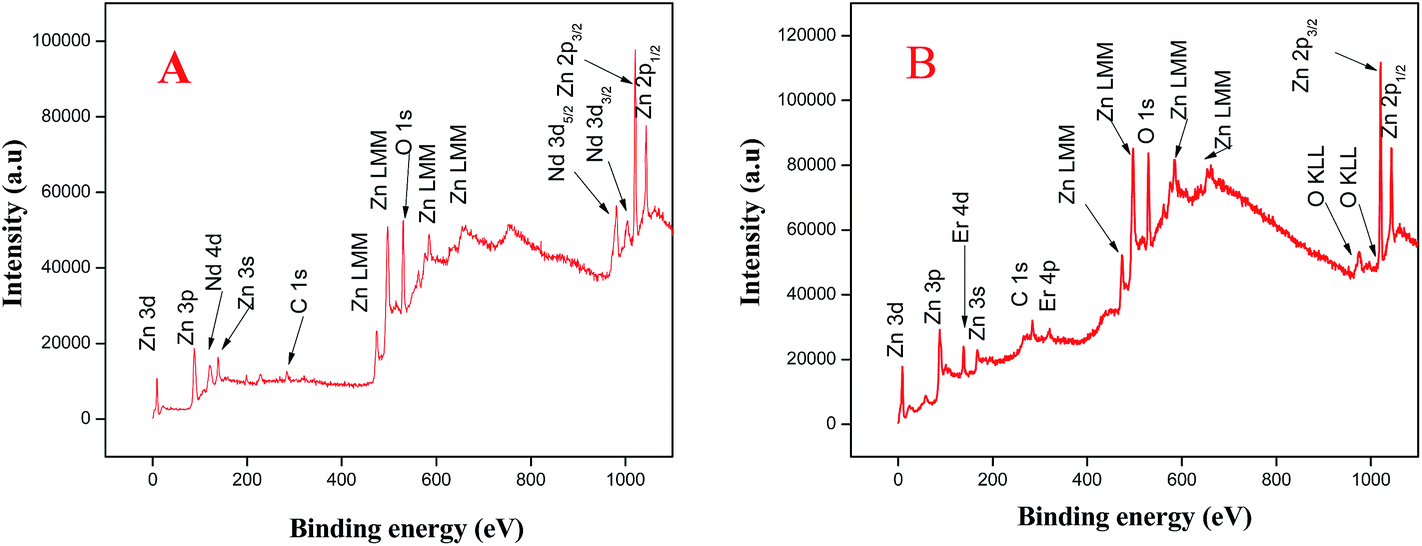
To further obtain more accurate information regarding doped ZnO, we employed X-ray photoenergy spectroscopy (XPS) analysis to examine the chemical composition and oxidation state of synthesized ZnO NPs. The wide survey scan spectra of Nd and Er doped ZnO NPs are presented in Fig. 7A and B, respectively, which indicate the presence of only Zn, O, C, Nd and Er elements. The obtained binding energies were corrected by using C 1s 282.8 eV as the reference. It could be seen from Fig. 1S(A) ESI†, that the peaks appearing at 1020 and 1042 eV, are in good agreement with the binding energy value of Zn 2p and ascribed to the core level of Zn 2p3/2 and 2p1/2, respectively. This indicate the formation of a Zn–O bond which reveals the oxidation of Zn2+ in bound ZnO.58–61 The energy difference between two peaks is 22 eV, which agreed well with the standard value, i.e., 22.97 eV.60 The absorptions at 530.6 and 532.4 eV are due to lattice oxygen and chemisorbed oxygen (OH) caused by the surface hydroxyl in wurtzite ZnO as shown in Fig. 1S(B) ESI†.61,62 Fig. 2S(A) ESI†displays peaks at 978.2 and 984.3 eV corresponding to Nd 3d5/2 and Nd3/2, respectively, which reveals that Nd exists as +3 oxidation state in Nd doped ZnO.62 The peaks position of Nd 3d are closely related to the value of Nd2O3 in literature data, which suggests that Nd substitutes the Zn.63,64 Fig. 2S(B) ESI†shows the two binding energy peaks at 184.3 and 188.1 eV corresponding to the 4d5/2 and 4d3/2, respectively, indicate the presence of Er3+ ions in Er doped ZnO.65–67 Based on both the XRD and XPS results, we conclude that the Nd and Er dopants are successfully incorporated into the ZnO lattice.
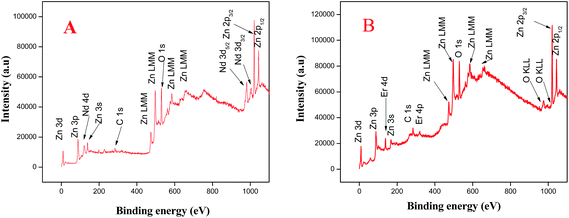 |
| | Fig. 7 XPS spectra of (A) Nd, and (B) Er-doped ZnO NPs. | |
3.6 BET analysis
The BET surface area, pore diameter and pore volume of synthesized pure and Er/Nd doped ZnO NPs were examined using nitrogen adsorption–desorption and Barrett–Joyner–Halenda (BJH) analysis in liquid nitrogen. The nitrogen adsorption–desorption isotherms (Fig. 3S, ESI†) showed a Type III hysteresis loop shape according to the IUPAC classification. The BET surface, pore diameter and pore volume of pure and 2.0% Nd and 5.0% Er doped ZnO NPs are given in Table 2. The BET surface area of 2% Nd was found to be higher than that of pure ZnO and 5.0% Er doped ZnO.
Table 2 BET surface area, pore volume and pore diameter of pure and Er/Nd doped ZnO NPs
| Parameter |
Pure ZnO |
5% Er-doped ZnO |
2% Nd-doped ZnO |
| BET surface area (m2 g−1) |
38.23 |
64.65 |
73.22 |
| Pore volume (cm3 g−1) |
0.312 |
0.332 |
0.381 |
| Pore diameter D (nm) |
12.67 |
15.78 |
19.34 |
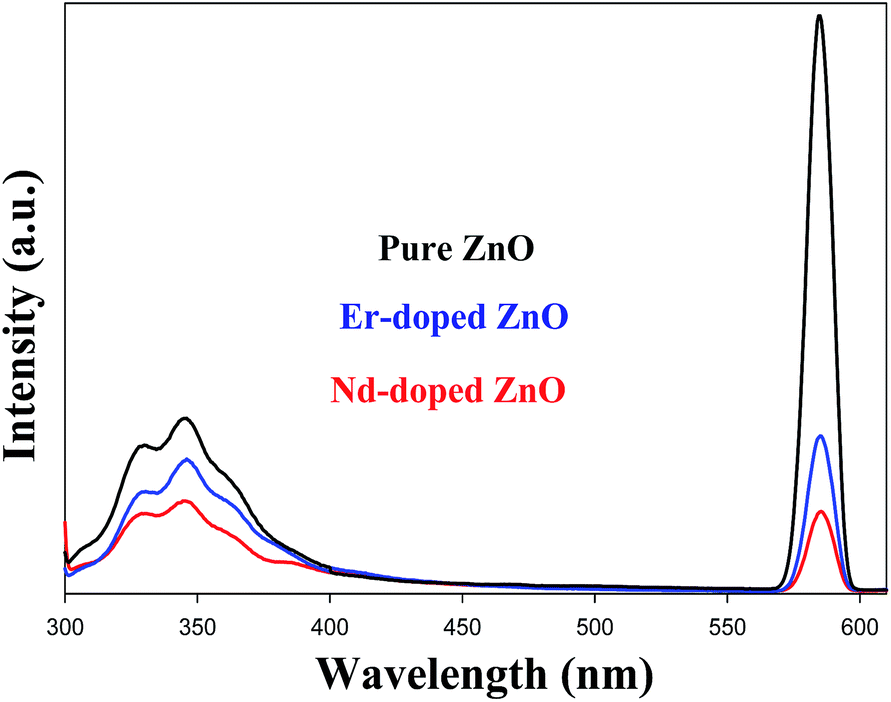
3.7 Photoluminescence spectroscopy
PL is a well-known powerful technique for investigating the effects of impurity, efficiency of charge carrier trapping and predicting the photocatalytic efficiency of semiconductor photocatalyst. The PL spectrum of ZnO NPs originates from irradiative recombination of excited or photoinduced charge carriers. The electron and hole play a great role in deciding the photocatalytic activity of a semiconductor photocatalyst. The photocatalytic activity decreases when an electron and hole recombine to emit a photon.68–70 Therefore, the photocatalytic activity of lower PL intensity would be higher. The PL intensity of ZnO decreases upon doping with Er and Nd as shown in Fig. 8. Hence, the recombination rate decreases by the efficient charge separation of photoinduced electron–hole pairs. The PL spectra of Nd doped ZnO NPs shows the lowest intensity peak among all. Therefore, photocatalytic performance of Nd-doped ZnO would be higher than pure and Er doped ZnO. It could be seen from the figure that pure and doped ZnO NPs reveal a UV emission band at approximately 329, 345, and a yellow emission band around 585 nm. Generally the UV emission band is due to the near band-edge emission (NBE), and the yellow emission in the visible region may be attributed by deep level emission (DLE). The UV emission was ascribed to the free recombination of photogenerated electrons in the conduction band and hole in the valence band.71 The DLE emission in the visible regions would arise due to the intrinsic or extrinsic defects in ZnO NPs.
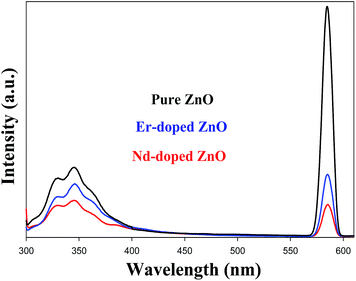 |
| | Fig. 8 The PL spectra of pure and Er/Nd doped ZnO NPs. | |
3.8 Thermal analysis (TGA, DTA and DSC)
To investigate the thermal stability of pure and Nd/Er doped ZnO, TGA, DTA and DSC were carried out under a nitrogen atmosphere. The total weight loss, i.e., 1.653% was observed for pure ZnO NPs in the temperature range from 100 to 800 °C (Fig. 4S, ESI†) and shows good thermal stability up to 100 °C. In contrast to this Er-doped ZnO NPs display the loss of 4.453% weight (Fig. 5S, ESI†) in the range of 100 to 800 °C. The Nd-doped ZnO NPs exhibit a total weight loss of approximately 1.476% in the range of 100 to 800 °C (Fig. 6S, ESI†). The initial weight loss for all NPs between 100 and 500 °C was caused by the evaporation of physically or chemically adsorbed water and hydroxide molecules.72 The weight loss above 500 °C might be due to conversion of ZnO into crystalized wurtzite ZnO.15
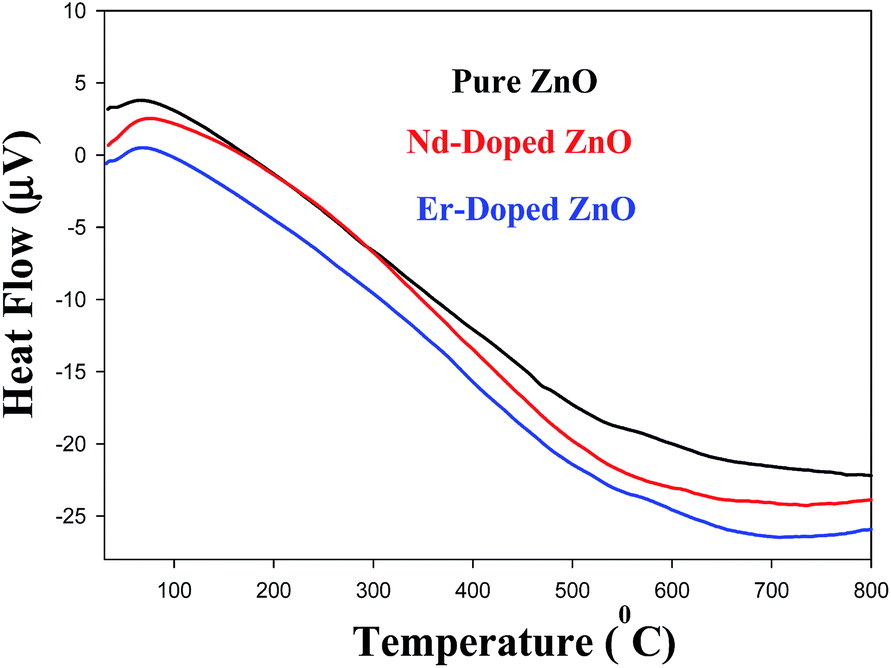
The DTA curve of pure and Nd/Er doped ZnO NPs are shown in Fig. 9. The DTA plot reveals three main steps of weight loss. The first step from 70 to 300 °C was ascribed to the removal of free water, and weight loss in the second step from 300 to 500 °C may be due to decomposition of bound water and a hydroxyl group. Finally, the weight loss above 500 °C was due to the crystallization of ZnO.73
 |
| | Fig. 9 DTA plot of pure and Er/Nd-doped ZnO NPs. | |
The DSC analysis of pure and doped ZnO NPs heated at 20 °C per minute from 30 to 550 °C is given in Fig. 7S–9S, ESI†. From the DSC curve, 4 endothermic peaks were found at 50, 428, 367 and 393 °C. The peak at 50 °C for all NPs indicates the evaporation of adsorbed water molecules. The peaks at 428, 367 and 393 °C are ascribed to crystal transformation from cubic to the wurtzite ZnO.74
3.9 Cytotoxicity and antibacterial activity
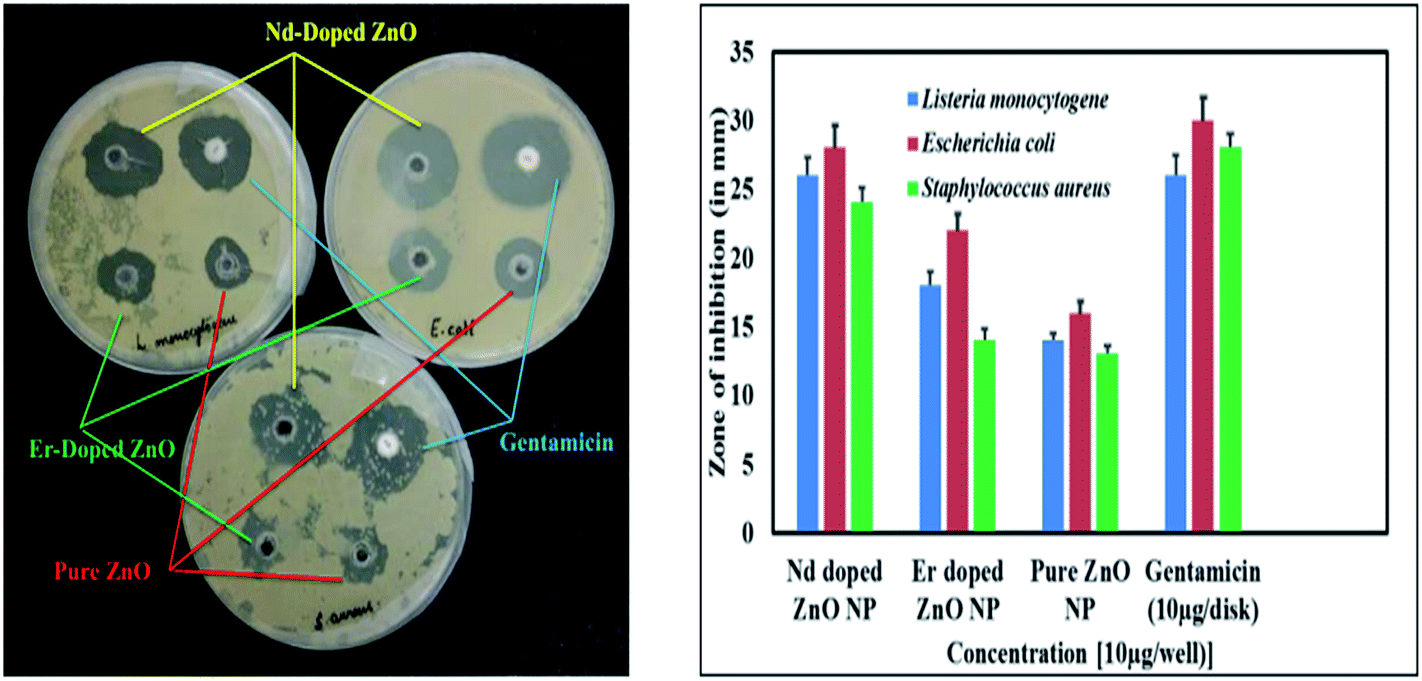
In vitro results of the agar well diffusion susceptibility test reveal that Nd-doped ZnO NPs show better antibacterial activity as compared to pure and Er-doped NPs. Moreover, it was observed that Nd-doped ZnO NPs show nearly equivalent bactericidal potential as compared to the standard drug gentamicin, while pure and Er-doped NPs have shown admirable bactericidal potential against Gram negative as well as Gram positive pathogenic strains. The presence of zone of inhibition by the various ZnO NPs against bacterial strains clearly indicates the bactericidal potential of the NPs. A bar graph and zone of inhibition are presented in Fig. 10.
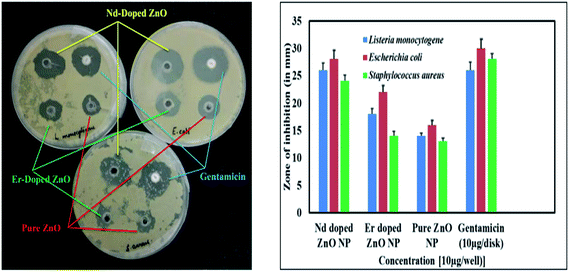 |
| | Fig. 10 Bar graph showing the diameter of the zone of inhibition (in mm) produced by pure and Nd/Er-doped ZnO NPs against E. coli, S. aureus and L. monocytogene. | |
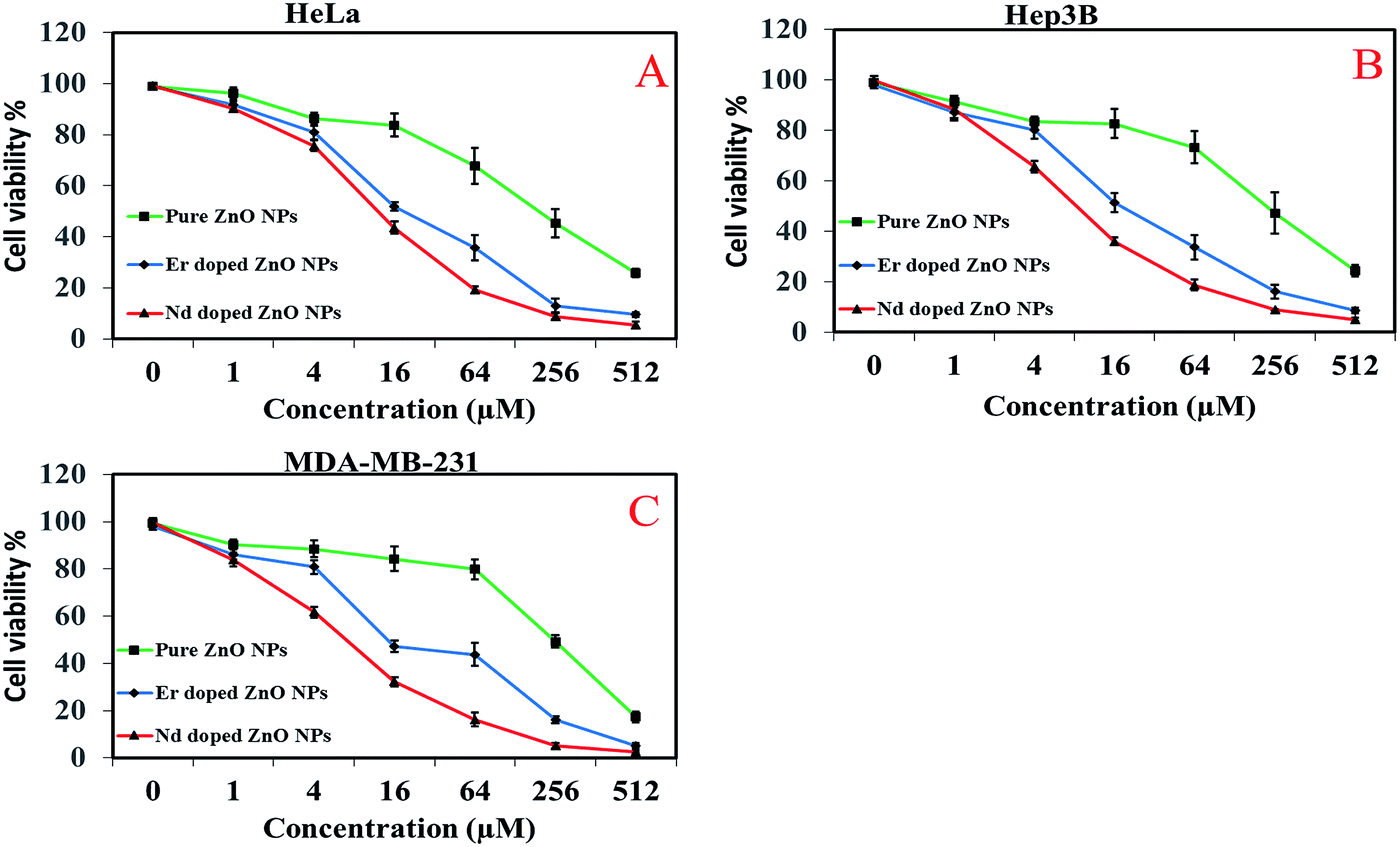
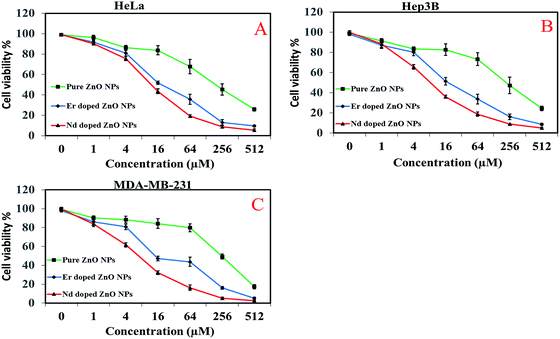
Cytotoxicity effects of pure and Nd/Er-doped ZnO NPs were examined in HeLa, hep3B and MDA-MB-231 cells using 3-(4,5-dimethylthiazol-2-y1)-2,5-diphenyltetrazolium bromide (MTT) assay. Cells were placed in a flat bottom 96-well plate at a density of 5 × 10³ cells per well and allowed to grow for 24 h at 37 °C. After incubation the culture medium was then replaced with the 100 μL fresh medium containing increasing concentrations of pure and Nd/Er doped ZnO NPs. The cells were incubated for 48 h and cell viability was measured by adding 20 μL of MTT dye (5 mg mL−1 in phosphate-buffered saline) per well. The plates were incubated for a further 4 h and thus formazan crystals formed due to the reduction of dye by viable cells in each well which were dissolved in 200 μL dimethyl sulfoxide (DMSO). The absorbance was recorded in an ELISA plate reader (iMARK Microplate Absorbance Reader, Bio Rad, California, USA) at 570 nm. The absorption values were expressed as percent cell viability compared with untreated control group considered as 100% viable. The results indicate that there is a decrease in cell metabolic activity of all targeted cells with increasing concentrations of ZnO NPs. It could be seen from Fig. 11 that MDA-MB-231 cells show higher damage compared to the other two cells. This showed that the MDA-MB-231 cell lines were more sensitive to the cytotoxic effects of ZnO NPs. At 512 μM concentration the toxicity of Nd-doped ZnO NPs was found to be higher than pure and Er-doped ZnO NPs.
 |
| | Fig. 11 Dose dependent anticancer potential of pure and Nd/Er-doped ZnO Nps against HeLa, Hep3B and MDA-MB-231 human cancer cell lines. | |
Several studies have been reported in the literature which suggest that an increase in in vitro cytotoxicity and antibacterial activity with increasing pure and doped hexagonal ZnO rods may be due to: (i) NPs gathering in the cytoplasm or accumulating on the bacterial surface which disturbed the cellular function and membrane function; (ii) generation of reactive oxygen species (ROS) such as hydroxyl radicals, hydrogen peroxide and super oxides which react with cell content such as protein lipid DNA to cause cell death.75–77
3.10 Photocatalytic activity
The photocatalytic degradation of two different chromophoric dyes such as MB and RR-241, two typical organic pollutants discharged by textile industries, were chosen to evaluate the photocatalytic efficiency of pure and doped ZnO NPs under visible light illumination. The characteristic absorption values of MB and RR-241 observed at 663 and 542 nm were used to monitor the photocatalytic performance of pure and doped ZnO NPs. The control experiments indicate that MB and RR-241 were resistant to degradation during irradiation without photocatalyst. However, little degradation of both dyes was observed in the presence of photocatalyst in the dark due to adsorption of dyes on the catalyst surface. Therefore, both catalyst and light are needed for effective decomposition. All prepared samples were able to degrade both dyes under investigation, as observed from the decrease in the characteristic absorbance and decolorization indicating the loss of chromophoric groups of dyes and conversion into small aromatic intermediates. Nd and Er doped ZnO NPs exhibit higher activity than pure ZnO under visible light illumination. The results indicate that photocatalytic activity of doped ZnO was improved by introducing Er and Nd metal ions into the lattice of ZnO.
In a typical experiment an aqueous solution of MB (10 ppm, 200 mL) or RR-241 (14 ppm, 200 mL) was illuminated in an immersion well photoreactor with a visible lamp in the presence of pure or desired amount of Er/Nd doped ZnO NPs under constant stirring and bubbling of atmospheric oxygen. Fig. 12A and B display that 100% and 78.6% decomposition of MB and RR-241 dyes take place after 10 min in the presence of 2.0% Nd and 5.0% Er doped ZnO NPs, respectively.
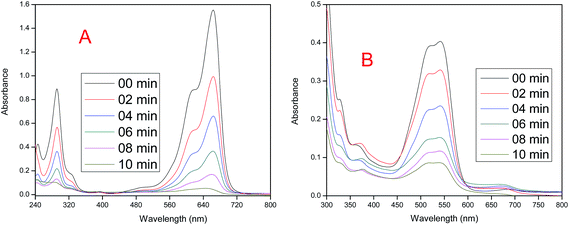 |
| | Fig. 12 (A) Change in the absorbance of an aqueous solution of MB (λmax = 663) in the presence of 2.0% Nd-doped ZnO NPs. (B) Change in the absorbance of an aqueous solution of RR-241 (λmax = 542) in the presence of 5.0% Er-doped ZnO NPs at different time intervals during irradiation under visible light. | |
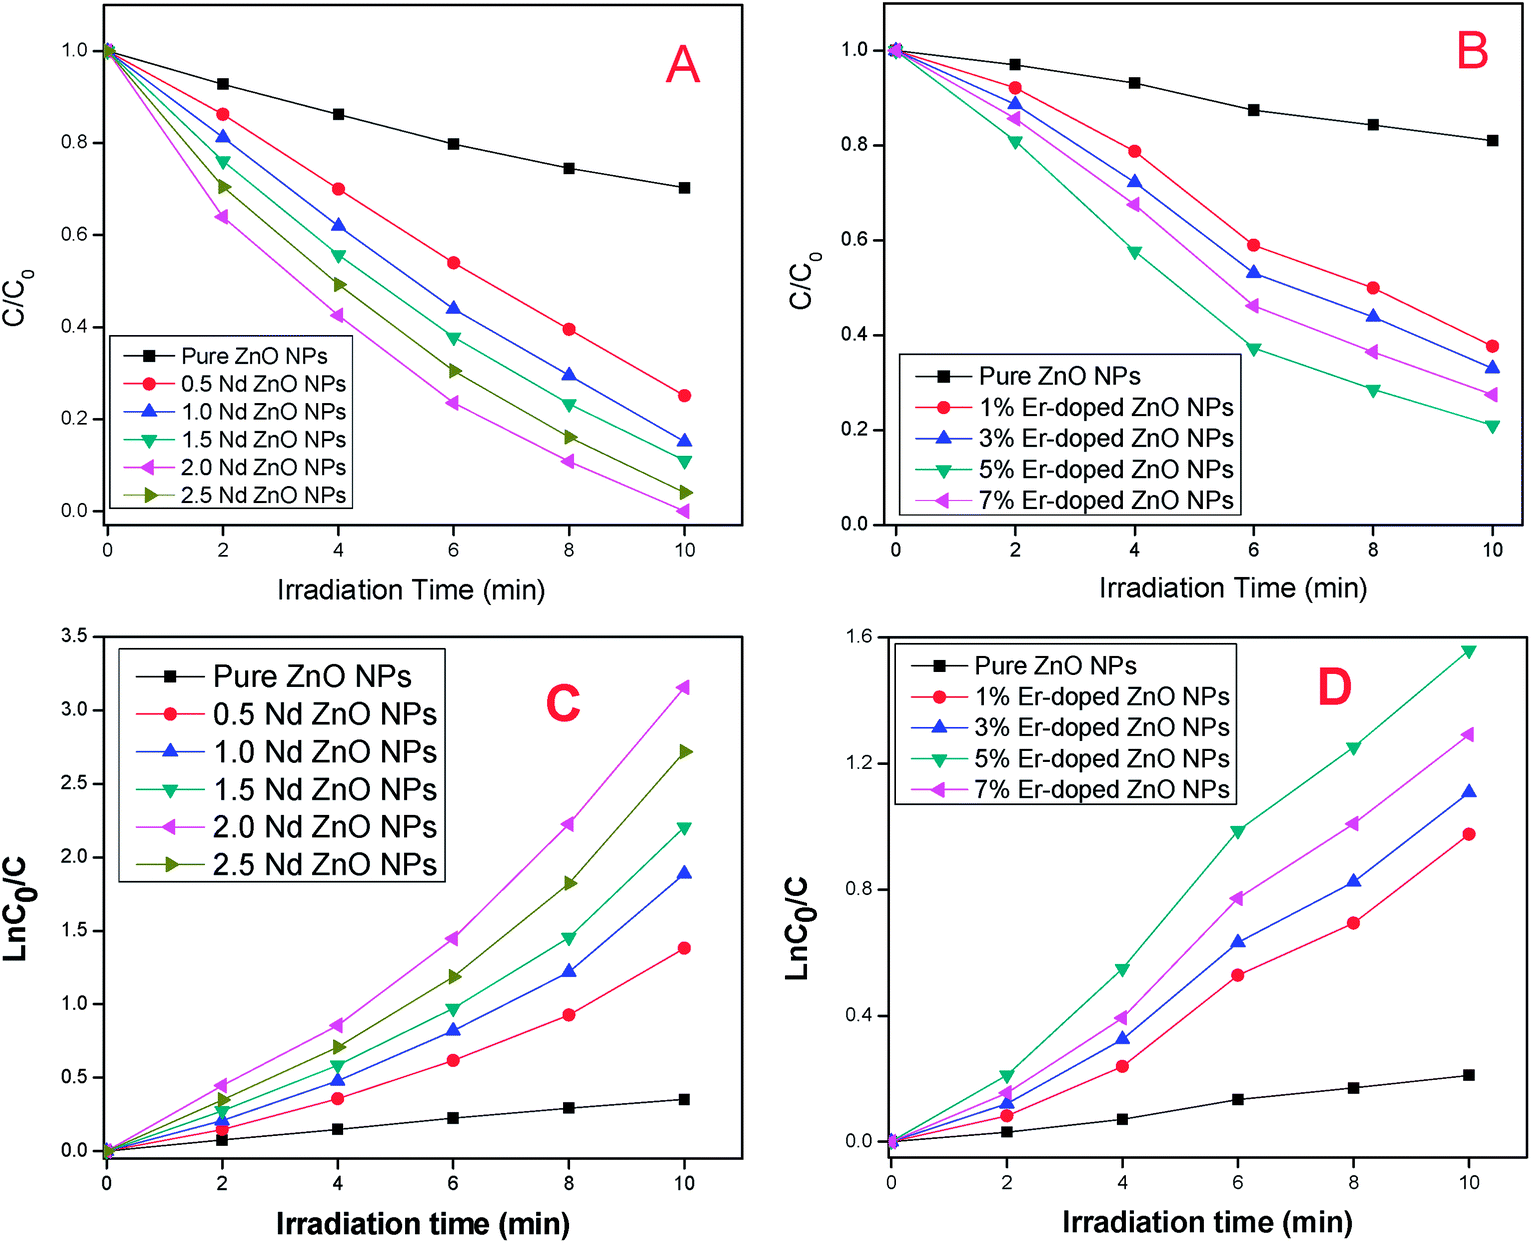
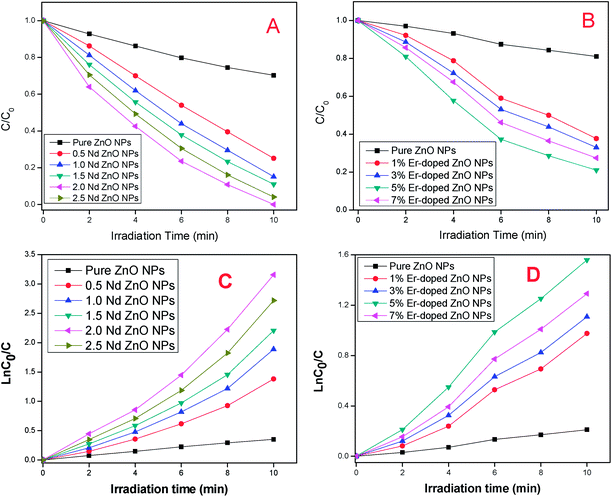
To compare the photocatalytic performance of pure and different mole% doped ZnO more precisely, we plotted (C)/(C0) vs. irradiation time for degradation of MB and RR-241, the results are depicted in Fig. 13A and B. The results indicate that the doped NPs provided enhanced photodecomposition of dyes as compared to bare ZnO, and the photocatalytic activity significantly increases with increasing dopant percentage up to 2.0% (Nd) and 5.0% (Er). Further, an increase in dopant percentage lead to a decrease in degradation of both dyes. However, 30.7% and 19.4% degradation of MB RR-241 dyes takes place over pure ZnO after 10 min due to a dye-sensitized mechanism.
 |
| | Fig. 13 (A and B) Change in concentration of MB and RR-241 in the presence of pure and different % of Nd and Er doped ZnO NPs, respectively, under visible light irradiation. (C and D) Kinetic study of degradation of Mb and RR-241 in the presence of pure and different % of Nd and Er doped ZnO NPs, respectively, under visible light irradiation. | |
To understand the photodegradation of dyes more accurately and quantitatively, we calculated the kinetics in the presence of pure and doped ZnO NPs. The plot of ln(C/C0) vs. irradiation time (t) (as shown in Fig. 10SA and B†), for MB (2.0% Nd) and RR-241 (5.0% Er doped ZnO NPs) indicate a good liner fit. All R2 (correlation coefficients) values were found to be higher than 0.9, which demonstrate that the photodegradation of MB and RR-241 by the NPs follow pseudo-first-order kinetics, and the slope of the linear curve could be considered as the rate constant kapparent. The ln![[thin space (1/6-em)]](https://www.rsc.org/images/entities/char_2009.gif) C0/C vs. irradiation time using all prepared ZnO NPs for degradation of MB and RR-241 under visible light illumination is given in Fig. 13C and D. The results indicate that the kinetic rate of MB and RR-241 catalyzed by Er and Nd doped ZnO enhanced with increasing Er and Nd concentration, and the Nd (2%) and Er (5%) doped ZnO display the highest photodegradation rate. Further, an increase in dopant percentage lead to a decrease in degradation of both dyes. The calculated kapparent values of the synthesized NPs are listed in Tables 1S and 2S†, respectively.
C0/C vs. irradiation time using all prepared ZnO NPs for degradation of MB and RR-241 under visible light illumination is given in Fig. 13C and D. The results indicate that the kinetic rate of MB and RR-241 catalyzed by Er and Nd doped ZnO enhanced with increasing Er and Nd concentration, and the Nd (2%) and Er (5%) doped ZnO display the highest photodegradation rate. Further, an increase in dopant percentage lead to a decrease in degradation of both dyes. The calculated kapparent values of the synthesized NPs are listed in Tables 1S and 2S†, respectively.
3.10.1 Effect of different operational parameters on the degradation of dyes. The efficiency of pure and doped catalysts were investigated by degradation of two different chromophoric dyes such as MB (cationic dye) and RR-241 (anionic dye) at other optimum conditions under visible light illumination with continuous purging of air.The percentage degradation (η) of dyes was calculated using the eqn (5),
| |
 | (5) |
where
C0 is the initial concentration and
C is the concentration at a particular time (
t).
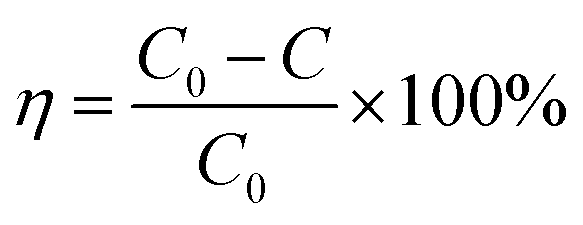
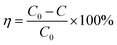
Fig. 14A and B shows the % degradation of MB and RR-241 over pure and different % of Nd and Er doped ZnO NPs, respectively, under 10 min illuminations. It was estimated from the results that the degradation of MB and RR-241 over Nd doped ZnO NPs follows the degradation order as Nd(2%)ZnO > Nd(2.5%)ZnO > Nd(1.5%)ZnO > Nd(1.0)ZnO > Nd(0.5)ZnO > ZnO. The degradation of MB and RR-241 over Er doped ZnO NPs follows the degradation order as Er(5%)ZnO > Er(7%)ZnO > Er(3%)ZnO > Er(1.0)ZnO > ZnO. The degradation efficiency of MB and RR-241 reaches 100% and 89.5% over (2%) Nd, and 87.2% and 78.6% over (5%) Er doped ZnO NPs after 10 min, respectively.
 |
| | Fig. 14 (A and B) Comparative study for the degradation of MB and RR-241 in the presence of Nd and Er (with varying dopant%) under visible light irradiation. | |
The photocatalytic activity of the prepared materials was found to increase as the molar ratio of dopants increased from 0 to 2.0% in the case of Nd, and 0–5% in the case of Er doped ZnO NPs. This may be because under visible light illumination dopants act as scavengers to trap the electron and prevent the electron hole recombination rate. The 4f electron transitions of dopants leads to the optical adsorption of ZnO and also supports the charge carrier separation. The degradation efficiency was found to increase as the dopant percentage increases up to 2% Nd and 5% Er doped ZnO NPs. It then decreases, suggesting that 2% Nd and 5% Er doped ZnO NPs could be more efficient for achieving high degradation efficiency due to an increased charge separation ability. Therefore, a precise amount of dopant could be critical for getting high photocatalytic activity.78 The presence of Nd3+ and Er3+ ions on the surface of ZnO may promote the following reactions:
| | |
Nd/Er3+ + e− → Nd/Er2+
| (6) |
| | |
Nd/Er2+ + O2 → Nd/Er3+ + O2˙−
| (7) |
Further increase in dopant percentage lead to a decrease in the efficiency of photocatalyst. This may be due the fact that at higher dopant concentrations, 7.0% (Er) and 2.5% (Nd), multiple trapping of charge carriers occurs, hence the recombination of photogenerated electron–hole pairs becomes easier and fewer charge carriers reach the surface to initiate the degradation of the dye. In addition, at high dopant percentages the blocking of light rays or shadowing effect was observed. The turbidity of powder takes place due to aggregation of the catalyst particles, which decreases the penetration depth of light. The aggregation of ZnO powder covers part of the photosensitive surface thereby decreasing the number of surface active sites, which leads to a decrease in the photocatalytic activity of the photocatalyst due to an increase in the number of electron–hole recombination centers.79 Similar results have also been reported in the literature.15,80–84
In order to optimize the photocatalyst dose, we performed the experiment at different loading levels of dopant (0.5 to 2.0 g L−1) to ensure the use of the minimum required amount of catalyst for highest degradation of dyes. As shown in Fig. 11SA and B,† the % degradation of RR-241 and MB increases with an increase in catalyst dose from 0.5 to 1.5 g L−1 (Nd), and 0.5 to 1.0 g L−1 (Er) doped ZnO NPs, and then the % degradation of dyes decreases. The initial increase in the % degradation may be due to an increase in total active surface area, the availability of active sites on the catalytic surface and the penetration of visible light. However, at a higher catalyst dose the decrease in % degradation may be due to less visible light penetration and a decrease in surface area because of agglomeration. Therefore, fewer photons may reach the active surface sites.85,86 Hence, all the experiments were carried out at optimal catalyst loading.
The pH of the reaction mixture plays an important role in the degradation of dyes because it determines the surface charge properties of the catalyst, adsorption/desorption of dyes on the surface of the catalyst, and charges on the dye molecules. Therefore, it is important to study the degradation of dyes at varying pH values of the reaction mixture. In order to see the role of pH on the decolorization of MB and RR-241, we performed experiments at different pH values varying from 4 to 10 using 5.0% Er and 2.0% Nd-doped ZnO NPs. The pH of the reaction mixture was maintained before irradiation by adding an aqueous solution of either HNO3 or NaOH. The effect of pH on degradation of MB and RR-241 was studied in analogous experimental conditions. Fig. 12S(A)† shows the change in % degradation vs. pH (4.0 to 10) for the degradation of MB in the presence of 2.0% Nd doped ZnO, whereas, Fig. 12S(B)† shows the change in % degradation vs. pH value (4.0 to 10) for the degradation of RR-241 in the presence of 5.0% Er doped ZnO. It could be seen from Fig. 12S(A)† that the decomposition of MB dye increases upon increases in pH from 4 to 7.8 and a further increase in pH leads to a decrease in MB degradation. The degradation of RR-241 increases with increasing pH from 4 to 8.6, further increases lead to decreased degradation of RR-241 dye as shown in Fig. 12S(B).† The rate of decomposition of dyes depends on the adsorption of dyes on the surface of ZnO NPs. However, adsorption of dyes depends upon the ionic structure of dyes and point charge value of ZnO. Since the zero point charge for doped ZnO (pHzpc) is about 8.3.23 The surface of the catalyst remains positively charged below pHzpc whereas the catalyst surface is negatively charged above pHzpc, according to eqn (8) and (9), respectively.
| | |
ZnO–OH + H+ → ZnO–OH2+ (+ve at pH < pHzpc)
| (8) |
| | |
ZnO–OH + OH− → ZnO–O− + H2O (−ve at pH > pHzpc)
| (9) |
The results indicate that the degradation of both dyes increases with increasing pH from 4 to 7.8 in the case of MB, and from 4 to 8.6 in the case of RR-241. A further increase in pH leads to decreased degradation of both dyes. The highest efficiency is observed at pH 7.8 (in the case of MB), and 8.6 (in the case of RR-241), which may be due to the fact that the dye molecules have a good interaction with the surface of the catalyst at these pH values. The low degradation rate under highly acidic and highly alkaline pH may due to the fact that ZnO NPs may undergo photocorrosion through self-oxidation at pH lower than 4. Moreover, in a strongly alkaline environment, ZnO may also undergo dissolution as given in eqn (10)–(12), respectively.87
| | |
ZnO + 2h+ → Zn2+ + 1/2O2
| (10) |
| | |
ZnO + 2H+ → Zn2+ + H2O
| (11) |
| | |
ZnO + H2O + 2OH− → Zn(OH)42−
| (12) |
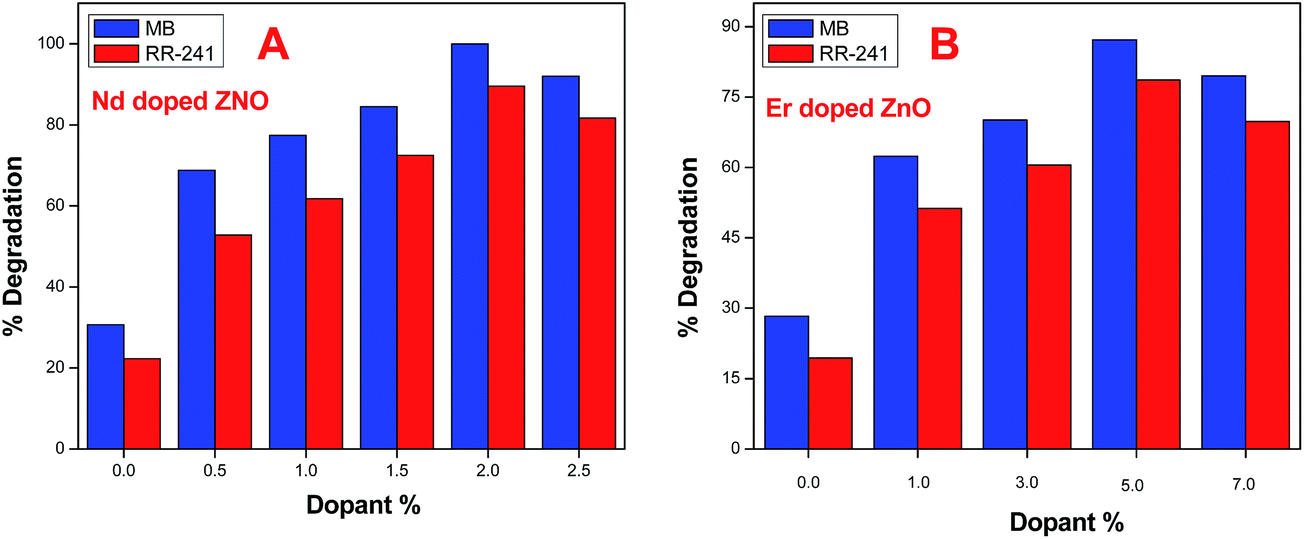
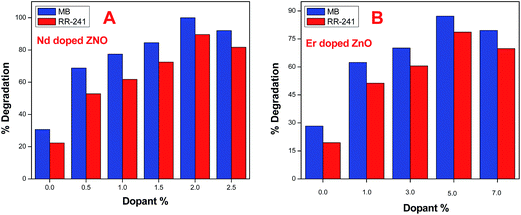
3.10.2 Trapping experiment. To find out the role of dopants on the degradation of dyes, we performed experiments to examine the main reactive species – hydroxyl radical, superoxide radical anion and hole – using different scavengers. Therefore, different scavengers were added to the aqueous solution of dyes to investigate the inhibitory effects of scavengers. It is clearly seen from Fig. 15 that the maximum decomposition of MB dye takes place without any scavenger. However, potassium iodide (KI) caused the highest negative effect on degradation efficiency of dye, indicating that hydroxyl radicals and holes are the major reactive species for the decolorization of MB in the presence of Nd-doped ZnO NPs. In addition, the role of hydroxyl radicals was investigated by the addition of isopropyl alcohol (IPA) and the results indicate that the degradation of MB was found to be inhibited significantly. Furthermore, a very small change in degradation of MB is observed after the addition of benzoquinone (quencher for superoxide radical anion). The mechanism for trapping reactive species is given below.| | |
IPOH + ˙OH → IPO˙ + H2O
| (18) |
| | |
BQ + O2˙− → BQ˙− + O2
| (19) |
 |
| | Fig. 15 Decolorization efficiency of MB in the presence of different radical scavengers over 2% Nd-doped ZnO under visible light illumination. | |
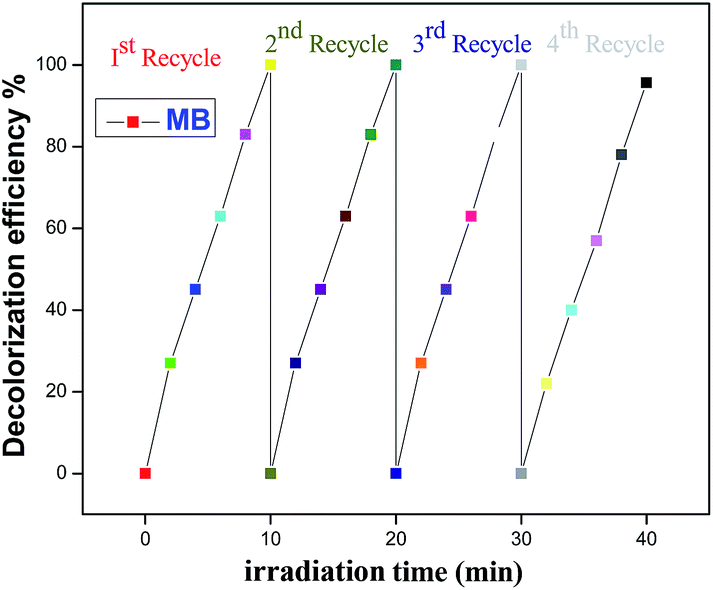
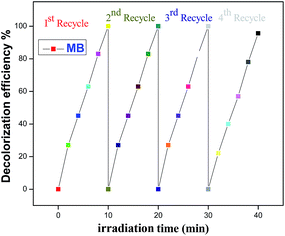
3.10.3 Photostability and reusability of doped ZnO NPs. In addition to photocatalytic performance, the reusability of the fabricated photocatalyst is also very important. To investigate the stability of a hexagonal nanorod, we conduct four successive photocatalytic experiments for degradation of MB under visible light irradiation in the presence of recycled 2% Nd-doped ZnO NPs, by keeping all other parameters unchanged. Fig. 16 shows that 2% Nd-doped ZnO NPs exhibited effective stability under visible light illumination, however, a slight reduction in efficiency from 100% to 95.6% was observed after the third cycle. Therefore, synthesized doped ZnO NPs could be an efficient photocatalyst for photoxidation of pollutants with higher reusability potential. Hence, doping semiconductors with suitable metal ions enhances the stability of photocatalysts.78,83
 |
| | Fig. 16 Photostability of 2% Nd-doped ZnO NPs within four consecutive cycles for degradation of MB under visible light illumination. | |
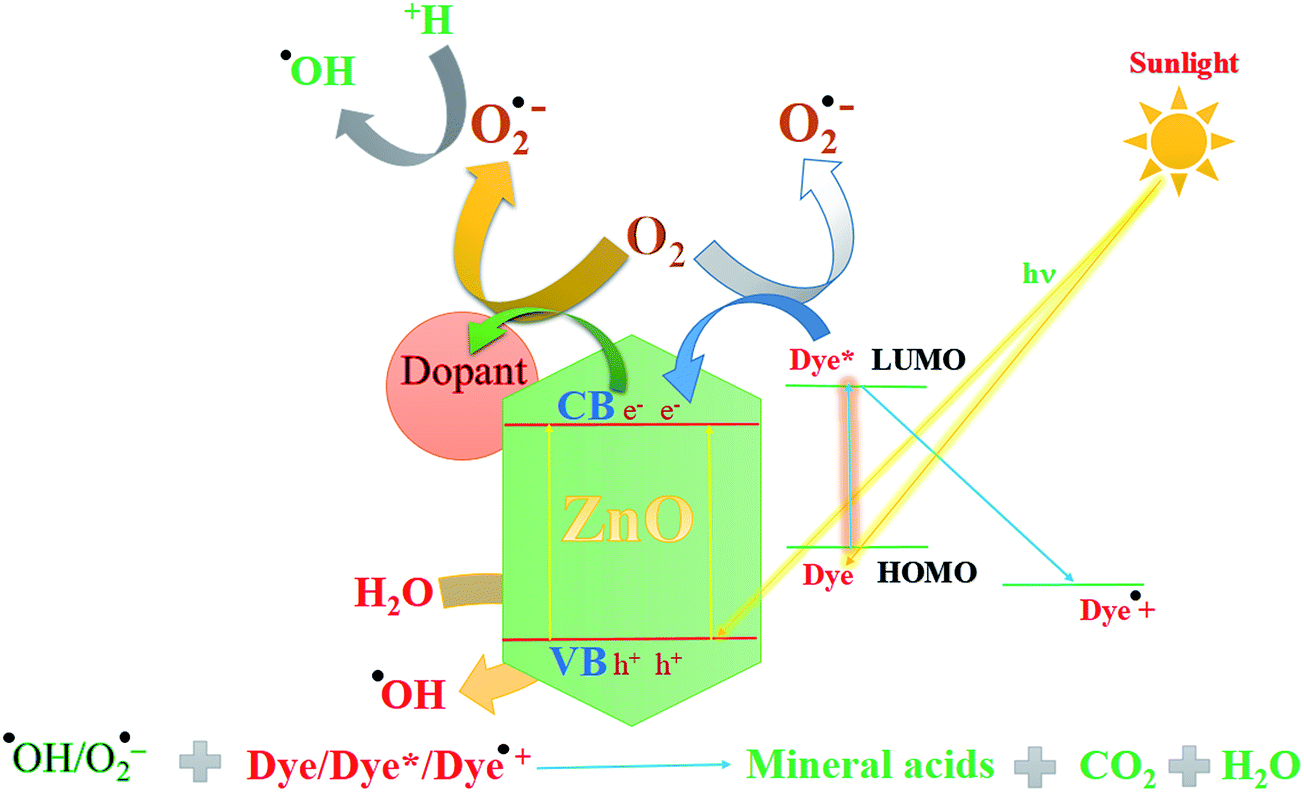
3.10.4 Mechanism of degradation of dyes. On the basis of the above experimental results and previous studies,88 a possible mechanism for degradation of dyes over doped ZnO NPs is shown in Scheme 1. The mechanism involving degradation of dyes using irradiation of ZnO could be visualized as follows. On absorption of photons of energy equal to or greater than the band gap of the prepared ZnO NPs, an electron may be promoted from the valence band to the conduction band leaving behind an electron vacancy or “hole”. Generally, the photocatalytic degradation of dyes in the presence of bare ZnO was found to be lower than doped materials due to the recombination of electron and hole pairs. The enhanced photocatalytic activity of doped ZnO NPs is not only due to the fact that dopants can improve the absorption efficiency of the NPs to solar light, but they also suppress the recombination rate of e/h+ pairs by trapping the electron, which improved the separation of the charge carrier. Furthermore, the higher separation of charge carried by doped ZnO NPs was confirmed by PL spectra. The trapped electron is picked up by oxygen to generate superoxide radical anions. At the same time the hole generated at the valence band (hvb+) may react with surface bound H2O to produce the highly reactive hydroxyl radical. The superoxide radical anions (˙O2−) and hydroxyl radicals (˙OH) produced under visible light irradiation are responsible for the degradation of dyes.89,90
 |
| | Scheme 1 A plausible mechanism for the degradation of dyes using hexagonal nanorod ZnO under visible light irradiation. | |
In addition, doped ZnO NPs have a small crystallite size and therefore possess a large surface area as inferred from BET, TEM and XRD. Photocatalytic activity also depends upon surface area; a larger surface area provides higher activity due to increased adsorption area. Hence, the hexagonal rod like doped ZnO NPs provide efficient photocatalytic activity.91
On the other hand a dye-sensitized mechanism may also be possible as indicated in experiments carried out for degradation of both dyes over pure ZnO NPs under a visible light source. Dyes such as MB and RR-241 are also visible light-absorbing and get excited in visible light. The excited dye* can transfer the electron to the conduction band of ZnO NPs.92–94 The electron can be trapped by the dopant at the surface or by the impurity band preventing the recombination rate of the charge carrier. The trapped electrons may subsequently be transferred to adsorbed oxygen to generate the superoxide radical anion (O2˙−) which may act as a strong reducing agent and may form hydrogen peroxide as indicated in the following equations. The hydroxyl radical (˙OH) formed in the reaction mixture may act as a strong oxidizing agent. These ROS are responsible for the degradation of dyes and killing of bacterial and cancer cells.
| | |
Dye + visible light → dye*
| (20) |
| | |
Doped ZnO + visible light → ecb− + hvb+
| (21) |
| | |
Dye* + doped ZnO → dye˙+ + ecb−
| (22) |
| | |
Nd/Er3+ + e− → Nd/Er2+
| (23) |
| | |
Nd/Er2+ + O2 → Nd/Er3+ + O2˙−
| (24) |
| | |
hvb+ + H2O → ˙OH + H+
| (26) |
| | |
O2˙− + H2O + 2H+ → H2O2 + O2
| (27) |
| | |
H2O2 + e− → −OH + ˙OH
| (28) |
| | |
˙OH/O2˙− + absorbed dye/dye˙+ → degradation products
| (29) |
4. Conclusion
In summary, we have successfully synthesized the hexagonal pure and Er/Nd doped ZnO nanorods by a simple and facile sol gel method using zinc acetate dihydrate as a precursor. All doped ZnO NPs exhibit smaller crystallite size, red shift in absorbance spectra, which allow utilization of visible light, greater separation of e/h+ pairs and more adsorption of dyes on the surface of doped ZnO as compared to bare ZnO NPs. The fabricated doped ZnO NPs show better photocatalytic activity for the degradation of MB and RR-241 dyes under visible light. The enhanced photocatalytic activity of doped ZnO NPs may be due to the smaller crystalline size and higher surface area. The dopants on the surface may act as electron wells to enhance the charge carrier inferred from EDX, PL, XPS and FTIR. In addition to superb photocatalytic activity and higher photostability, doped ZnO also exhibits better anticancer and antibacterial activity than pure ZnO NPs.
Acknowledgements
Financial support from the Research Project from the Ministry of Mines, Government of India, New Delhi, Alexander von Humboldt foundation, Germany, under research group linkage programme and DRS, FIST and PURSE support to the Department of Chemistry, Aligarh Muslim University, Aligarh, is gratefully acknowledged. We thank the Department of Physics, A. M. U, Aligarh, for conducting the XRD analysis of the synthesized materials.
References
- P. M. Martins, V. Gomez, A. C. Lopes, C. J. Tavares, G. Botelho, S. Irusta and S. Lanceros-Mendez, J. Phys. Chem. C, 2014, 118, 27944–27953 CAS.
- S. Singh, V. Srivastava and I. Mall, J. Phys. Chem. C, 2013, 117, 15229–15240 CAS.
- R. Ahlawat and V. Srivastava, Clean: Soil, Air, Water, 2008, 36, 863–869 CrossRef CAS.
- A. Khataee, R. Darvishi Cheshmeh Soltani, Y. Hanifehpour, M. Safarpour, H. Gholipour Ranjbar and S. W. Joo, Ind. Eng. Chem. Res., 2014, 53, 1924–1932 CrossRef CAS.
- A. Rezaee, H. Masoumbaigi, R. Darvishi, A. R. Khataee and S. Hashemiyand, Desalin. Water Treat., 2012, 44(1), 174–179 CrossRef CAS.
- X. Guo, W. Song, C. Chen, W. Di and W. Qin, Phys. Chem. Chem. Phys., 2013, 15, 14681–14688 RSC.
- E. Casbeer, V. Sharma and X. Li, Sep. Purif. Technol., 2012, 87, 1–14 CrossRef CAS.
- J. Zhang, K. Yu, Y. Yu, L.-L. Lou, Z. Yang, J. Yang and S. Liu, J. Mol. Catal. A: Chem., 2014, 391, 12–18 CrossRef CAS.
- X. Chen and S. Mao, Chem. Rev., 2007, 107, 2891–2959 CrossRef CAS PubMed.
- R. Kozhummal, Y. Yang, F. Güder, A. Hartel, X. Lu, U. M. Küçükbayrak, A. Mateo-Alonso, M. Elwenspoek and M. Zacharias, ACS Nano, 2012, 6, 7133–7141 CrossRef CAS PubMed.
- J. Mu, C. Shao, Z. Guo, Z. Zhang, M. Zhang, P. Zhang, B. Chen and Y. Liu, ACS Appl. Mater. Interfaces, 2011, 3, 590–596 CAS.
- P. V. Korake, R. S. Dhabbe, A. N. Kadam, Y. B. Gaikwad and K. M. Garadkar, J. Photochem. Photobiol., B, 2014, 130, 11–19 CrossRef CAS PubMed.
- P. Gomathisankar, K. Hachisuka, H. Katsumata, T. Suzuki, K. Funasaka and S. Kaneco, ACS Sustainable Chem. Eng., 2013, 1, 982–988 CrossRef CAS.
- B. Cao and W. Cai, J. Phys. Chem. C, 2008, 112, 680–685 CAS.
- W. Raza, M. M. Haque and M. Muneer, Appl. Surf. Sci., 2014, 322, 215–224 CrossRef CAS.
- W. Han, L. Ren, X. Qi, Y. Liu, X. Wei, Z. Huang and J. Zhong, Appl. Surf. Sci., 2014, 299, 12–18 CrossRef CAS.
- T. Xu, L. Zhang, H. Cheng and Y. Zhu, Appl. Catal., B, 2011, 101, 382–387 CrossRef CAS.
- B. Li and H. Cao, J. Mater. Chem., 2011, 21, 3346–3349 RSC.
- L. Zhang, L. Du, X. Yu, S. Tan, X. Cai, P. Yang, Y. Gu and W. Mai, ACS Appl. Mater. Interfaces, 2014, 6, 3623–3629 CAS.
- Z. Liu, C. Liu, J. Ya and E. Lei, Renewable Energy, 2011, 36, 1177–1181 CrossRef CAS.
- L. Arun Jose, J. Mary Linet, V. Sivasubramanian, A. K. Arora, C. Justin Raj, T. Maiyalagan and S. Jerome Das, Mater. Sci. Semicond. Process., 2012, 15, 308–313 CrossRef CAS.
- J.-W. Lo, W.-C. Lien, C.-A. Lin and J.-H. He, ACS Appl. Mater. Interfaces, 2011, 3, 1009–1014 CAS.
- B. Subash, B. Krishnakumar, M. Swaminathan and M. Shanthi, Langmuir, 2013, 29, 939–949 CrossRef CAS PubMed.
- G. H. Mhlongo, O. M. Ntwaeaborwa, H. C. Swart, R. E. Kroon, P. Solarz, W. Ryba-Romanowski and K. T. Hillie, J. Phys. Chem. C, 2011, 115, 17625–17632 CAS.
- H. Serier, M. Gaudon and M. Ménétrier, Solid State Sci., 2009, 11, 1192–1197 CrossRef CAS.
- F. Meng, J. Yin, Y.-Q. Duan, Z.-H. Yuan and L.-J. Bie, Sens. Actuators, B, 2011, 156, 703–708 CrossRef CAS.
- W.-H. Zhang, W.-D. Zhang and J.-F. Zhou, J. Mater. Sci., 2009, 45, 209–215 CrossRef.
- S. Du, Y. Tian, H. Liu, J. Liu and Y. Chen, J. Am. Ceram. Soc., 2006, 89, 2440–2443 CrossRef CAS.
- S. Suwanboon, P. Amornpitoksuk and P. Bangrak, Ceram. Int., 2011, 37, 333–340 CrossRef CAS.
- H. Wang, C. Li, H. Zhao, R. Li and J. Liu, Powder Technol., 2013, 239, 266–271 CrossRef CAS.
- R. Saleh and N. F. Djaja, Superlattices Microstruct., 2014, 74, 217–233 CrossRef CAS.
- C. Pérez, A. M. Agnese and J. L. Cabrera, J. Ethnopharmacol., 1999, 66, 91–96 CrossRef.
- T. Mosmann, J. Immunol. Methods, 1983, 65, 55–63 CrossRef CAS PubMed.
- F.-X. Xiao, ACS Appl. Mater. Interfaces, 2012, 4, 7055–7063 CAS.
- P. Zhang, B. Li, Z. Zhao, C. Yu, C. Hu, S. Wu and J. Qiu, ACS Appl. Mater. Interfaces, 2014, 6, 8560–8566 CAS.
- R. Kumar, S. Anandan, K. Hembram and T. N. Rao, ACS Appl. Mater. Interfaces, 2014, 6, 13138–13148 CAS.
- Z. Zhang, C. Shao, X. Li, C. Wang, M. Zhang and Y. Liu, ACS Appl. Mater. Interfaces, 2010, 2, 2915–2923 CAS.
- L. Zhu, M. Zhi, Z. Ye and B. Zhao, Appl. Phys. Lett., 2006, 88, 113106 CrossRef.
- J. Rao, A. Yu, C. Shao and X. Zhou, ACS Appl. Mater. Interfaces, 2012, 4, 5346–5352 CAS.
- H. Kleinwechter, C. Janzen, J. Knipping, H. Wiggers and P. Roth, J. Mater. Sci., 2002, 37, 4349–4360 CrossRef CAS.
- X. Q. Wei, Z. G. Zhang, M. Liu, C. S. Chen, G. Sun, C. S. Xue, H. Z. Zhuang and B. Y. Man, Mater. Chem. Phys., 2007, 101, 285–290 CrossRef CAS.
- L. Loh, J. Briscoe and S. Dunn, ACS Appl. Mater. Interfaces, 2015, 7, 152–157 CAS.
- N. Rajeswari Yogamalar and A. Chandra Bose, J. Solid State Chem., 2011, 184, 12–20 CrossRef CAS.
- C. K. Ghosh, S. R. Popuri, T.
U. Mahesh and K. K. Chattopadhyay, J. Sol-Gel Sci. Technol., 2009, 52, 75–81 CrossRef CAS.
- S. K. Chaturvedi, E. Ahmad, J. M. Khan, P. Alam, M. Ishtikhar and R. H. Khan, Mol. Biosyst., 2015, 11, 307–316 RSC.
- D. Barpuzary and M. Qureshi, ACS Appl. Mater. Interfaces, 2013, 5, 11673–11682 CAS.
- H. Qin, W. Li, Y. Xia and T. He, ACS Appl. Mater. Interfaces, 2011, 3, 3152–3156 CAS.
- N. Udawatte, M. Lee, J. Kim and D. Lee, ACS Appl. Mater. Interfaces, 2011, 3, 4531–4538 CAS.
- M. A. Butler, J. Appl. Phys., 1977, 48, 1914 CrossRef CAS.
- R. K. Gupta, K. Ghosh and P. K. Kahol, Phys. E, 2009, 41, 617–620 CrossRef CAS.
- M. Khatamian, A. A. Khandar, B. Divband, M. Haghighi and S. Ebrahimiasl, J. Mol. Catal. A: Chem., 2012, 365, 120–127 CrossRef CAS.
- Y. Zhou, S. X. Lu and W. G. Xu, Environ. Prog. Sustainable Energy, 2009, 28, 226–233 CrossRef CAS.
- B. Shahmoradi, K. Soga, S. Ananda, R. Somashekar and K. Byrappa, Nanoscale, 2010, 2, 1160–1164 RSC.
- R. John and R. Rajakumari, Nano-Micro Lett., 2012, 4, 65–72 CrossRef CAS.
- A. S. H. Hameed, C. Karthikeyan, A. P. Ahamed, N. Thajuddin, N. S. Alharbi, S. A. Alharbi and G. Ravi, Sci. Rep., 2016, 6, 24312 CrossRef CAS PubMed.
- R. John and R. Rajakumari, Nano-Micro Lett., 2012, 4, 65–72 CrossRef CAS.
- S. D. Senol, J. Mater. Sci.: Mater. Electron., 2016, 27(8), 7767–7775 CrossRef CAS.
- Q. Deng, X. Duan, D. H. L. Ng, H. Tang, Y. Yang, M. Kong, Z. Wu, W. Cai and G. Wang, ACS Appl. Mater. Interfaces, 2012, 4, 6030–6037 CAS.
- M. Caglar and F. Yakuphanoglu, Appl. Surf. Sci., 2012, 258, 3039–3044 CrossRef CAS.
- Z. L. Wang, X. Y. Kong, Y. Ding, P. Gao, W. L. Hughes, R. Yang and Y. Zhang, Adv. Funct. Mater., 2004, 14, 943–956 CrossRef CAS.
- J. H. Zheng, J. L. Song, Z. Zhao, Q. Jiang and J. S. Lian, Cryst. Res. Technol., 2012, 47, 713–718 CrossRef CAS.
- C. Ren, B. Yang, M. Wu, J. Xu, Z. Fu, Y. Lv, T. Guo, Y. Zhao and C. Zhu, J. Hazard. Mater., 2010, 182, 123–129 CrossRef CAS PubMed.
- L. Armelao, G. Bottaro, M. Pascolini, M. Sessolo, E. Tondello, M. Bettinelli and A. Speghini, J. Phys. Chem. C, 2008, 112, 4049–4054 CAS.
- Y. Z. Z. Zhang, X. L. Zhong, H. Liao, F. Wang and J. B. Wang, Appl. Surf. Sci., 2011, 257, 7461–7465 CrossRef.
- S. Huang, L. Gu, C. Miao, Z. Lou, N. Zhu, H. Yuan and A. Shan, J. Mater. Chem. A, 2013, 1, 7874 CAS.
- L. Armelao, D. Barreca, G. Bottaro, A. Gasparotto, D. Leonarduzzi, C. Maragno, E. Tondello and C. Sada, J. Vac. Sci. Technol., A, 2006, 24, 1941–1947 CAS.
- W. C. Lang, B. D. Padalia, L. M. Watson, D. J. Fabian and P. R. Norris, Faraday Discuss. Chem. Soc., 1975, 60, 37–43 RSC.
- L. Chen, D. Jiang, T. He, Z. Wu and M. Chen, CrystEngComm, 2013, 15, 7556 RSC.
- D. Zhang, M. Wen, B. Jiang, G. Li and J. C. Yu, J. Hazard. Mater., 2012, 211–212, 104–111 CrossRef CAS PubMed.
- J. Cao, B. Xu, H. Lin, B. Luo and S. Chen, Chem. Eng. J., 2012, 185–186, 91–99 CrossRef CAS.
- B. Panigrahy, M. Aslam, D. S. Misra and D. Bahadur, CrystEngComm, 2009, 11, 1920 RSC.
- D. E. Motaung, G. F. Malgas, C. J. Arendse and S. E. Mavundla, Mater. Chem. Phys., 2012, 135, 401–410 CrossRef CAS.
- K. J. Chen, T. H. Fang, F. Y. Hung, L. W. Ji, S. J. Chang, S. J. Young and Y. J. Hsiao, Appl. Surf. Sci., 2008, 254, 5791–5795 CrossRef CAS.
- P. S. Sokolov, A. N. Baranov, Z. V. Dobrokhotov and V. L. Solozhenko, Russ. Chem. Bull., 2010, 59, 325–328 CrossRef CAS.
- R. Brayner, R. Ferrari-Iliou, N. Brivois, S. Djediat, M. F. Benedetti and F. Fiévet, Nano Lett., 2006, 6, 866–870 CrossRef CAS PubMed.
- L. Zhang, Y. Jiang, Y. Ding, M. Povey and D. York, J. Nanopart. Res., 2006, 9, 479–489 CrossRef.
- A. Lipovsky, Z. Tzitrinovich, H. Friedmann, G. Applerot, A. Gedanken and R. Lubart, J. Phys. Chem. C, 2009, 113, 15997–16001 CAS.
- P. K. Sanoop, S. Anas, S. Ananthakumar, V. Gunasekar, R. Saravanan and V. Ponnusami, Arabian J. Chem., 2012 DOI:10.1016/j.arabjc.2012.04.023.
- A. R. Khataee, Y. Hanifehpour, M. Safarpour, M. Hosseini and S. W. Joo, Sci. Adv. Mater., 2013, 5, 1074–1082 CrossRef CAS.
- W. Raza, M. M. Haque, M. Muneer, M. Fleisch, A. Hakki and D. Bahnemann, J. Alloys Compd., 2015, 632, 837–844 CrossRef CAS.
- W. Raza, M. M. Haque, M. Muneer, T. Harada and M. Matsumura, J. Alloys Compd., 2015, 648, 641–650 CrossRef CAS.
- M. M. Haque, W. Raza, A. Khan and M. Muneer, J. Nanoeng. Nanomanuf., 2014, 4, 135–139 CrossRef CAS.
- W. Raza, M. M. Haque, M. Muneer and D. Bahnemann, Arabian J. Chem., 2015 DOI:10.1016/j.arabjc.2015.09.002.
- W. Raza, A. Khan, U. Alam, M. Muneer and D. Bahnemann, J. Mol. Struct., 2016, 1107, 39–46 CrossRef CAS.
- S. Kansal, N. Kaur and S. Singh, Nanoscale Res. Lett., 2009, 4, 709–716 CrossRef CAS PubMed.
- B. Krishnakumar, B. Subash and M. Swaminathan, Sep. Purif. Technol., 2012, 85, 35–44 CrossRef CAS.
- R. Comparelli, E. Fanizza, M. L. Curri, P. D. Cozzoli, G. Mascolo and A. Agostiano, Appl. Catal., B, 2005, 60, 1–11 CrossRef CAS.
- H. Qin, W. Li, Y. Xia and T. He, ACS Appl. Mater. Interfaces, 2011, 3, 3152–3156 CAS.
- S. A. Ansari, M. M. Khan, J. Lee and M. H. Cho, J. Ind. Eng. Chem., 2014, 20, 1602–1607 CrossRef CAS.
- C. Chen, Y. Zheng, Y. Zhan, X. Lin, Q. Zheng and K. Wei, Dalton Trans., 2011, 40, 9566–9570 RSC.
- L. Zhang, L. Yin, C. Wang, N. Lun and Y. Qi, ACS Appl. Mater. Interfaces, 2010, 2, 1769–1773 CAS.
- T. Wu, G. Liu, J. Zhao, H. Hidaka and N. Serpone, J. Phys. Chem. B, 1998, 102, 5845–5851 CrossRef CAS.
- A. Hagfeldt and M. Graetzel, Chem. Rev., 1995, 95, 49–68 CrossRef CAS.
- S. Rehman, R. Ullah, A. M. Butt and N. D. Gohar, J. Hazard. Mater., 2009, 170, 560–569 CrossRef CAS PubMed.
Footnote |
| † Electronic supplementary information (ESI) available: The supporting information contains the following results: X-ray photoelectron spectroscopy, Brunauer–Emmett–Teller, thermal analysis measurement (TGA and DSC), the plot of lnC/C0 vs. irradiation time, effect of catalyst loading, effect of pH, apparent rate constant and R2 value for degradation of dyes in the presence of doped ZnO NPs. See DOI: 10.1039/c6ra06774c |
|
| This journal is © The Royal Society of Chemistry 2016 |
Click here to see how this site uses Cookies. View our privacy policy here. 
 Open Access Article
 This Open Access Article is licensed under a