Cathepsin B, H and L inhibitors as cell proliferating agents: design, synthesis, computational and pharmacological studies of some novel 2-(2-naphthoyl)-6,6-dimethyl-3-aryl-2,3,6,7-tetrahydrobenzofuran-4(5H)-ones†
Neera Raghav*a,
Suman Jangraa,
Ajay Kumarb,
Shalmoli Bhattacharyyab,
Deepak Wadhwac and
Jayant Sindhud
aDepartment of Chemistry, Kurukshetra University, Kurukshetra-136118, Haryana, India. E-mail: nraghav.chem@gmail.com
bPGIMER, Chandigarh, India
cIsharjyot Degree College, Pehowa, Haryana, India
dS.D. (P. G.) College Panipat, Haryana, India
First published on 30th March 2016
Abstract
Elevated levels of cathepsins B, H and L in disease conditions such as inflammation and cancer accentuate the need for design, synthesis and pharmacological evaluation of new compounds, keeping in view target-specific therapy. The present work describes the one pot multicomponent synthesis of some novel 2-(2-naphthoyl)-6,6-dimethyl-3-aryl-2,3,6,7-tetrahydrobenzofuran-4(5H)-ones in good yields. The synthesized compounds were analysed by spectral and X-crystallographic studies and have been found to be potential inhibitors to cathepsins B, H and L. The extent of inhibition varied with the substitution. Among the synthesized compounds, nitro-substituted compound 1d has been evaluated as most inhibitory to cathepsin H, however fluoro-substituted compound 1f was the best inhibitor of cathepsin B and cathepsin L. The compounds have been found more selective towards cathepsin L. In vitro inhibition studies correlate well when tested using MTT assay on HepG2 cells, a hepatocellular carcinoma cell line. The results validated by in silico studies performed with iGemDock predicted that among the synthesized compounds, 1d experiences the highest affinity for cathepsin B and H sites, whereas 1f has the highest affinity to cathepsin L.
1. Introduction
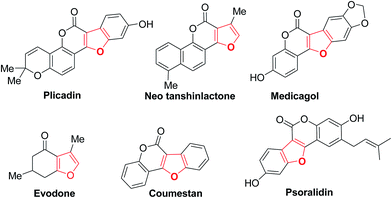
Cathepsins B, H and L along with other cysteine proteases have emerged as possible molecular targets. These enzymes have been found to be involved in various disease conditions such as rheumatoid arthritis,1 osteoarthritis,2,3 periodontitis,4 bone and joint disorders5 and pancreatitis6 etc. Cathepsins have also been found responsible as tumour-promoting function in cancer progression by actively participating in tumour invasion processes,7 metastasis and progression of cancer to an extent that has lead to revelation of anti-cathepsin therapy as a novel concept in cancer treatment. Elevated levels of these cathepsins and decreased levels of their cytosolic inhibitors at the site of inflammation emphasize the significance of designing and synthesis of potential inhibitors. Role of cathepsins in regulating the process of apoptosis8 and in tumour cell death through mediation of apoptosis9 has been precisely stated. More efficient cancer treatment can be achieved by certain molecular mechanisms that control and execute apoptotic cell death in cancer growth.10Exhaustive work has been carried out on the development of peptidyl inhibitors11 of cathepsins but now focus has been shifted on non-peptidyl inhibitors due to oral instability and immunogenic problems related to peptide based inhibitors. To advance our search for non-peptidyl cathepsins' inhibitors,12 the present work is focussed on development of some novel tetrahydrobenzofuran derivatives and to explore their effect on cathepsins B, H and L. The moiety has been selected based on wide range of associated biological activities such as anti-inflammatory,13 antiviral14 and anti-Alzheimer15 where involvement of cathepsins has already been established. Annulated dihydrofuran motifs such as furopyranone, furochromenone and tetrahydrobenzofuran have already yielded versatile therapeutic agents such as plicadin,16 neotanshinlactone,17 medicagol,18 psoralidin,19 evodone20 and coumestan21 (Fig. 1).
2. Result and discussion
2.1. Chemistry
The development of new and efficient methods for benzofuran derivatives' synthesis remains an area of current interest and thus versatile efficient synthetic methods have appeared in the literature.22a–c The present manuscript reports a multicomponent approach for the synthesis of novel 2-(2-naphthoyl)-6,6-dimethyl-3-aryl-2,3,6,7-tetrahydrobenzofuran-4(5H)-one via one-pot four-component condensation reaction in acetonitrile. In order to achieve the synthesis of our desired product 2-α-bromoacetylnaphthalene (a), dimedone (b), 4-methylbenzaldehyde (c) and pyridine (d) are chosen as model substrates (Scheme 1). | ||
| Scheme 1 One-pot four-component synthesis of 2-(2-naphthoyl)-6,6-dimethyl-3-(4-methylphenyl)-2,3,6,7-tetrahydrobenzofuran-4(5H)-one. | ||
A reaction of 2-α-bromoacetylnaphthalene (a) (1.0 mmol), dimedone (b) (1.0 mmol), 4-methylbenzaldehyde and (c) (1.0 mmol) pyridine was attempted in acetonitrile using (d) Et3N (2.5 mmol) as catalyst under reflux for 12 h. The reaction was quenched using ice cold water and the solid so obtained was subjected to column chromatography. The product thus obtained was identified as 2-(2-naphthoyl)-6,6-dimethyl-3-(4-methylphenyl)-2,3,6,7-tetrahydrobenzofuran-4(5H)-one (1a) (85% yield) by 1H NMR, 13C and IR spectroscopy.
The structure of 1a was elucidated by 1H NMR and 13C spectroscopy. 1H spectra of 1a revealed two doublets at δ 5.99–5.98 ppm and δ 4.40–4.39 ppm with the vicinal coupling constant of 4 Hz due to two protons at 2,3-position of dihydrofuran ring which suggest trans relationship between these two protons. A singlet at δ 2.35 due to three protons of the methyl group attached to the phenyl ring. Two multiplets are observed at δ 2.66–2.51 and δ 2.26–2.14 due to four protons of the dimedone ring. Proton decoupled 13C spectra shows peak at δ 49.1 and 51.2 due to 2nd and 3rd carbon of the furan ring.
This protocol was further extended by carrying out reactions of 2-α-bromoacetylnaphthalene (a) (1.0 mmol), dimedone (b) (1.0 mmol) and pyridine (d) (2.5 mmol) with differently substituted aryl aldehydes in acetonitrile using Et3N (2.5 mmol) as catalyst. The reactions proceeded smoothly and resulted in 2-(2-naphthoyl)-6,6-dimethyl-3-aryl-2,3,6,7-tetrahydrobenzofuran-4(5H)-one (1a–f) in good yield (Scheme 2) (Table 1). All the novel compounds are characterised using 1H NMR, 13C and IR spectroscopy and the peaks were consistent with the above discussed data.
 | ||
| Scheme 2 One-pot four-component synthesis of 2-(2-naphthoyl)-6,6-dimethyl-3-aryl-2,3,6,7-tetrahydrobenzofuran-4(5H)-one. | ||
| S. No. | Compound code | Ar | Yield (%) | Mp (°C) |
|---|---|---|---|---|
| a % yield and melting points of synthesized compounds (1a–f). | ||||
| 1 | 1a | 4-CH3C6H4 | 85 | 146–148 |
| 2 | 1b | 4-OCH3C6H4 | 90 | 161–162 |
| 3 | 1c | C6H5 | 92 | 140–142 |
| 4 | 1d | 4-NO2C6H4 | 88 | 120–121 |
| 5 | 1e | 4-BrC6H4 | 86 | 142–143 |
| 6 | 1f | 4-FC6H4 | 84 | 124–125 |
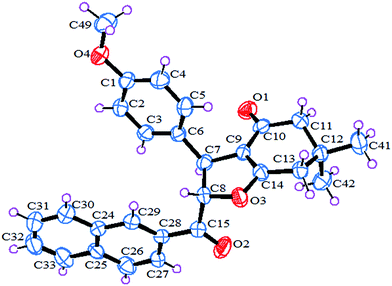
The structure of the synthesized novel 2-(2-naphthoyl)-6,6-dimethyl-3-(4-methoxyphenyl)-2,3,6,7-tetrahydrobenzofuran-4(5H)-one (1b) has also been confirmed by the single crystal X-ray diffraction analysis (Fig. 2). Single crystal of 1b suitable for X-ray diffraction was obtained by solvent diffusion method of CHCl3/petroleum ether at room temperature. The crystal packing shows 4 molecules in a single unit cell. The crystal refinement data is listed in Table 2.
| a Crystal structure detail of compound 1b. | |
|---|---|
| Empirical formula | C28H28O4 |
| Formula weight | 428.50 |
| Temperature | 293(2) K |
| Wavelength | 0.71073 Å |
| Unit cell dimensions | a = 5.5906(6) Å |
| b = 18.9078(19) Å | |
| c = 21.3233(17) Å | |
| Volume | 2254.0(4) Å3 |
| Z | 4 |
| Density (calculated) | 1.263 Mg m−3 |
| Absorption coefficient | 0.083 mm−1 |
| F(000) | 912 |
| Crystal size | 20 × 10 × 15 mm3 |
| Theta range for data collection | 2.88 to 25.00° |
| Index ranges | −6 ≤ h ≤ 6, −22 ≤ k ≤ 20, −25 ≤ l ≤ 25 |
| Reflections collected | 15![[thin space (1/6-em)]](https://www.rsc.org/images/entities/char_2009.gif) 713 713 |
| Independent reflections | 3982 [R(int) = 0.0569] |
| Completeness to theta = 25.00° | 99.8% |
The crystal packing of compound 1b shows the presence of two molecules in a unit cell (Fig. 3a). The crystal structure of 1b also revealed two types of interactions namely, intermolecular and intramolecular hydrogen bonding. The intermolecular H-bonding stabilized the molecule by bonding between C(15)–O(2)⋯H(27), C(8)–H(8)⋯H(29) and C(4)–H(4)⋯H(49) with a bond distance of 2.530, 2.064 and 2.298 Å respectively (Fig. 3b). The structure also involves intramolecular hydrogen bonding interactions between C(10)–O(1)⋯H(13b) and C(1)–O(4)⋯H(13a) with a bond distance of 2.545 and 2.505 respectively (Fig. 3c).
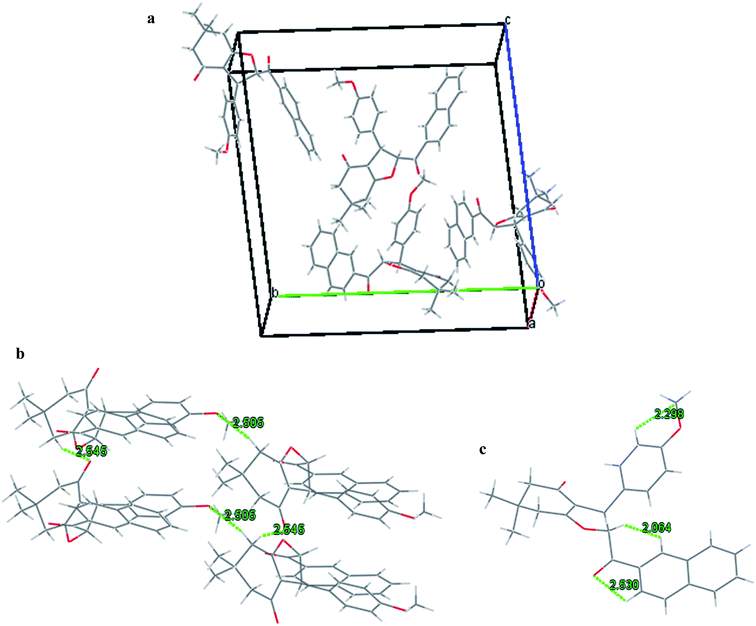 | ||
| Fig. 3 (a) Crystal packing for 1b; (b) specific intermolecular hydrogen-bonding interactions in the crystal of 1b; (c) specific intramolecular hydrogen-bonding in the crystal 1b. | ||
2.2. Biological evaluation
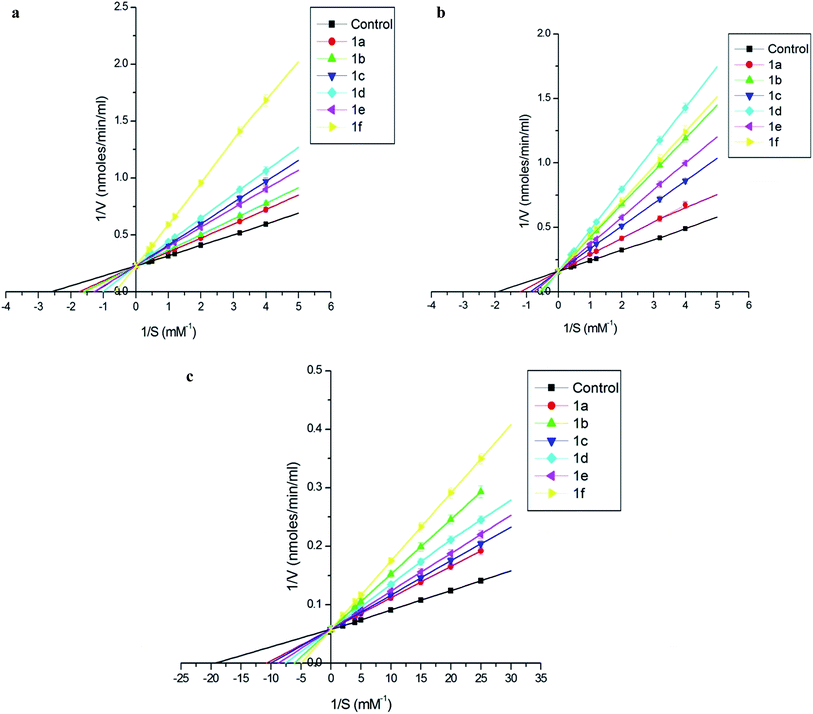
Effect of dihydrofuran derivatives on the activity of cathepsins B, H and L. Table 3 display the results of cathepsins B, H and L inhibition by synthesized compounds. It can be observed that the extent of inhibition varied with different substitution. Fluoro substituted, compound 1f, has been evaluated as the best inhibitor among the synthesized compound and appreciable inhibition can be observed for cathepsin B and cathepsin L at concentrations 10−6 and 10−9 M, respectively. However, for cathepsin H nitro substituted, compound 1d, was most inhibitory and ∼64% activity was lost at 1 × 10⁻⁷ M concentration. The results were validated in the respective effective range 10−5, 10−6 and 10−8 at varying concentrations of each compound for cathepsins B, H and L (Fig. 4a–c).
| Code No. | Cathepsin B | Cathepsin H | Cathepsin L |
|---|---|---|---|
| a The values represent the % residual activities and are calculated w.r.t. control where no compound was added but an equivalent amount of solvent was added to nullify the effect of solvent on enzyme. The cathepsins B, H and L activities were estimated at 1 × 10⁻⁶ M, 1 × 10⁻⁷ M and 1 × 10⁻⁹ M concentrations of compounds, respectively. | |||
| Control | 100 ± 0.000 | 100 ± 0.000 | 100 ± 0.000 |
| 1a | 83.60 ± 0.034 | 85.34 ± 0.027 | 77.52 ± 0.031 |
| 1b | 77.54 ± 0.026 | 43.60 ± 0.021 | 54.25 ± 0.024 |
| 1c | 62.98 ± 0.023 | 59.41 ± 0.016 | 73.98 ± 0.026 |
| 1d | 57.69 ± 0.018 | 36.44 ± 0.009 | 62.16 ± 0.007 |
| 1e | 67.25 ± 0.008 | 51.23 ± 0.012 | 69.23 ± 0.020 |
| 1f | 36.68 ± 0.011 | 41.84 ± 0.020 | 04.11 ± 0.007 |
| K′m = Km(1 + [I]/Ki) |
The results have been summarised in Table 4. The Ki values show that 1f exhibits highest affinity to cathepsin B and cathepsin L, whereas 1d for cathepsin H.
| S. No. | Code of compound | Cathepsin B | Cathepsin H | Cathepsin L |
|---|---|---|---|---|
| a The experiments were conducted in triplicate using different concentrations of BANA, Leu-βNA and Z-Phe-Arg-4m-βNA as substrate for cathepsins B, H and L respectively. The results are calculated using Lineweaver–Burk equation for competitive inhibitors. | ||||
| 1 | 1a | 3.167 ± 0.091 | 2.275 ± 0.103 | 1.497 ± 0.083 |
| 2 | 1b | 2.030 ± 0.086 | 0.520 ± 0.037 | 0.525 ± 0.062 |
| 3 | 1c | 0.968 ± 0.034 | 0.979 ± 0.074 | 1.243 ± 0.099 |
| 4 | 1d | 0.799 ± 0.032 | 0.381 ± 0.041 | 0.724 ± 0.067 |
| 5 | 1e | 1.155 ± 0.045 | 0.706 ± 0.064 | 0.982 ± 0.059 |
| 6 | 1f | 0.329 ± 0.029 | 0.484 ± 0.053 | 0.386 ± 0.048 |
Structure activity relationship studies were carried out to evaluate the effect of substitution pattern on inhibition by considering the electronic effects. It was observed that for cathepsin B and L compound, 1f, having –F substitution at 4th position with Ki value 0.329 × 10⁻⁶ M and 0.386 × 10⁻⁹ M, respectively was most inhibitory. However, in case of cathepsin H the compound 1d having –NO2 substitution at 4th position was the best inhibitor with Ki value 0.381 × 10⁻⁷ M. Both the compounds carry electron withdrawing group.
The compounds with electron withdrawing groups have been found to be better inhibitors. The difference between inhibitory potential of 1a (–CH3) and 1b (–OCH3) also elucidate that inductive effects are dominant than resonance effect. So in SAR studies we found that the groups capable for hydrogen bonding contribute more to the enzyme inhibitor interactions.
| #Ligand | Total energy | VDW | H-Bond | Elec |
|---|---|---|---|---|
| a The results are one of the docking experiments run using iGemdock under drug screening settings. The ligands were loaded as MDL mol file. The active site was extracted from the structure of cathepsin B retrieved from Protein Data Bank (http://www.rcsb.org/) as cav2IPP, B_PYS.pdb. | ||||
| BANA | −120.58 | −94.29 | −23.32 | −2.96 |
| Leupeptin | −121.41 | −87.58 | −33.82 | 0 |
| 1a | −99.01 | −87.74 | −11.27 | 0 |
| 1b | −100.33 | −87.33 | −13 | 0 |
| 1c | −99.46 | −87.55 | −11.91 | 0 |
| 1d | −102.76 | −86.15 | −15.63 | −0.99 |
| 1e | −100.13 | −88.30 | −11.83 | 0 |
| 1f | −99.67 | −94.92 | −4.75 | 0 |
The binding energies (kcal mol−1) of the six dihydrofuran derivatives (1a–f) varies in range −99.01 to −102.76 and the binding energies of the most inhibitory compound 1d in this series shows maximum decreases in total energy i.e., −102.76. From the interaction data of the docking experiments, it was indicated that all the compounds showed less interaction than the reference compound leupeptin, a peptidyl inhibitor. The maximum decrease in total energy due to interaction of leupeptin–cathepsin B came out to be −121.41, of which the contributions of the vander Waals interactions was greatest with a score of −87.58 as compared to the H-bond with a score of −33.82. The decrease in energy by the interaction of BANA with a score of −120.58. The leupeptin–cathepsin B binding energy is large due to peptide–protein interaction. Leupeptin is peptidyl in nature, and therefore due to flexible nature, it binds more effectively with the active site of enzyme and resulted in a higher binding energy. Due to flexibility, ligands like leupeptin will show a larger decrease in total energy as compared to the molecules under study. The compounds under the study are smaller in structure, so possess lower flexibility as compared to leupeptin which results in the lesser binding energy of the titled compounds than leupeptin. But in vitro analysis reveals that the compounds are very good inhibitors to cathepsin B upto μM concentration. The designed compounds showed competitive inhibition similar to leupeptin, which has been reported as a competitive inhibitor to cathepsin B,25 Fig. 6 shows the results of the best docking pose of 1a–f respectively, in the active site of cathepsin B. It can be observed that Cys-29 and Trp-30 have been found to interact with the substrate as well as the compound under consideration. This supports the results obtained during the in vitro studies, because the compounds are evaluated to be competitive inhibitors and these compete with the binding site of the substrate.
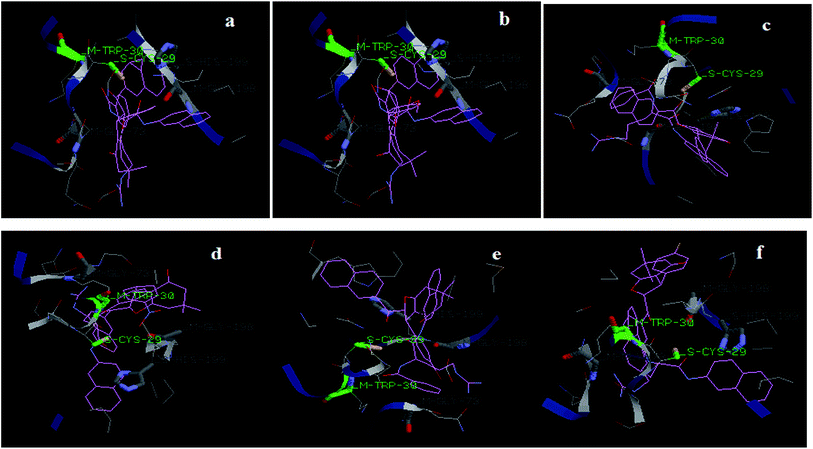 | ||
| Fig. 6 Docking results showing the alignment of (1a–f) compounds with BANA in the active site of cathepsin B (cav2IPP B_PYS.pdb). | ||
Docking of compounds has been carried out in cathepsin H site available as cav8 PCH-NAB.pdb.26 The decrease in total energy for the reference inhibitor Leu-CH2Cl was less as compared to all of the designed compounds (Table 6). The reason may be that it possesses only one amino acid residue in contrast to leupeptin for cathepsin B. Although Leu-CH2Cl is a specific inhibitor for cathepsin H27 but the resulting binding energy is lesser due to small surface area of the inhibitor. So due to smaller size and lesser flexibility, the Leu-CH2Cl–cathepsin H interaction causes a lesser decrease in energy i.e., −62.59, of which −46.16 is the vander Waals interaction and −16.43 is due to H-bonds. As listed in Table 6, all the designed compounds have been found to show a greater decrease in energy by the interaction of ligand–cathepsin H than Leu-CH2Cl–cathepsin H. From docking studies, the compound 1d was found to be the most inhibitory to cathepsin H among the synthesized compounds, showing a total decrease in energy of −100.30 out of which −86.97 is due to vander Waals interactions whereas −13.06 is from H-bonding and −0.26 is due to the electronic interactions.
| #Ligand | Total energy kcal mol−1 | VDW kcal mol−1 | H-Bond kcal mol−1 | Elec kcal mol−1 |
|---|---|---|---|---|
| a The results are one of the docking experiments run using iGemdock under drug screening settings. The ligands were loaded as MDL mol file. The active site was extracted from the structure of cathepsin H retrieved from Protein Data Bank (http://www.rcsb.org/) as cav8PCHH_NAG.pdb. | ||||
| Leu-βna | −76.03 | −62.03 | −14 | 0 |
| Leu-CH2Cl | −62.59 | −46.16 | −16.43 | 0 |
| 1a | −93.11 | −82.61 | −10.5 | 0 |
| 1b | −94.91 | −86.36 | −8.54 | 0 |
| 1c | −88.68 | −86.11 | −2.56 | 0 |
| 1d | −100.30 | −86.97 | −13.06 | −0.26 |
| 1e | −89.39 | −81.21 | −8.19 | 0 |
| 1f | −96.01 | −86.51 | −9.5 | 0 |
It can be seen that the designed compounds and the substrate Leu-βNA have been found to interact with Asn-112 amino acid of the enzyme cathepsin. The docked poses and interactions clearly suggest that a competitive type of inhibition is exerted by the compounds on cathepsin H. In vitro inhibition studies also suggest that all the compounds (1a–f) exerted a competitive inhibition on cathepsin H. Best docking poses of all compounds in the active cathepsin H have been shown in Fig. 7.
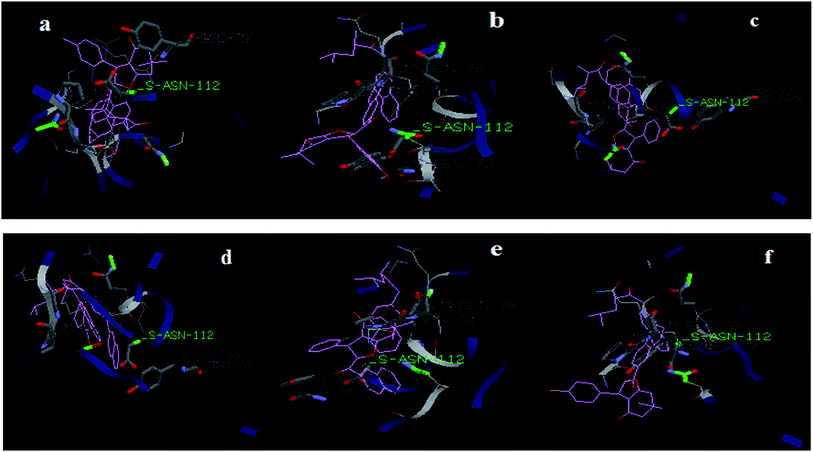 | ||
| Fig. 7 Docking results showing the alignment of (1a–f) compounds with Leu-βNA in the active site of cathepsin H (cav8PCH H_NAG.pdb). | ||
When molecular docking experiments were carried on cathepsin L binding site available as PDB file cav3BC3L_CSWp,28 it was found that in the case of cathepsin L the binding energies varies in range of −82.87 to −92.98 kcal mol−1 (Table 7) and from the docking studies 1f is evaluated as the most inhibitory compounds which is in accordance to the in vitro studies. Compound 1f shows total decrease in energy −92.98 kcal mol−1 out of which −89.48 is due to the vander walls interactions and −3.50 is due to the H-bonding. When these docking energies were compared with those of the substrate Z-Phe-Arg-4mβNA it was found that they are very low. For Z-Phe-Arg-4mβNA it was −111.20 kcal mol−1, possessing a peptidyl chain, exhibits a larger decrease in energy however, the extent of the inhibition caused by all the compounds is of the order of 10−9 M, and for the most inhibitory compound 1f the Ki value is reported as 0.386 × 10⁻⁹ M.
| #Ligand | Total energy | VDW | H-Bond | Elec |
|---|---|---|---|---|
| a The results are one of the docking experiments run using iGemdock under drug screening settings. The ligands were loaded as MDL mol file. The active site was extracted from the structure of cathepsin L retrieved from Protein Data Bank (http://www.rcsb.org/) as cav3BC3L_CSW. | ||||
| Z-Phe-Arg-4mβNA | −111.20 | −82.85 | −29.18 | 0.83 |
| 1a | −82.87 | −79.43 | −3.44 | 0 |
| 1b | −91.73 | −89.57 | −2.16 | 0 |
| 1c | −85.90 | −83.17 | −2.73 | 0 |
| 1d | −91.37 | −73.02 | −18.35 | 0 |
| 1e | −90.95 | −85.30 | −5.65 | 0 |
| 1f | −92.98 | −89.48 | −3.5 | 0 |
| Leupeptin | −116.82 | −91.84 | −24.98 | 0 |
The best docking pose of all compounds (1a–f) in the active site of cathepsin L have been shown in Fig. 8. The amino acids Trp-28, Gly-68 and Gly-164 have been found to interact with the compounds, as well as with substrate Z-Phe-Arg-4mβNA, thus indicating a competitive type of inhibition.
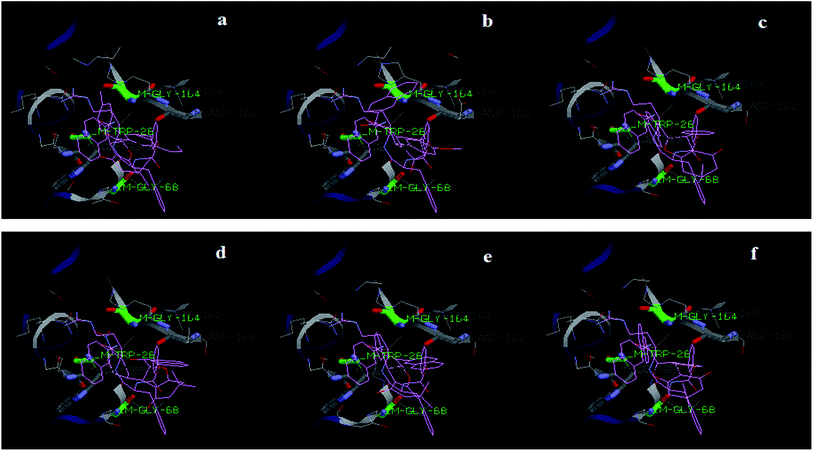 | ||
| Fig. 8 Docking results showing the alignment of (1a–f) compounds with Z-Phe-Arg-4mβNA in the active site of cathepsin L (cav3BC3L_CSW). | ||
The correlation between the total energy vs. log![[thin space (1/6-em)]](https://www.rsc.org/images/entities/char_2009.gif) Ki of the all compounds (1a–f) for cathepsin B, H and L respectively have been shown in Fig. 9.
Ki of the all compounds (1a–f) for cathepsin B, H and L respectively have been shown in Fig. 9.
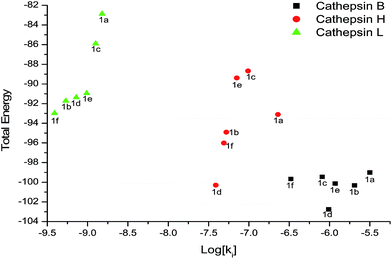 | ||
Fig. 9 Correlation between the total energy vs. log![[thin space (1/6-em)]](https://www.rsc.org/images/entities/char_2009.gif) Ki of the all compounds (1a–f) for cathepsin B, H and L respectively. Ki of the all compounds (1a–f) for cathepsin B, H and L respectively. | ||
In the present work, we have used the decrease in total energy of the enzyme–ligand complex as a measure of the binding affinity of the ligand within the active site of the enzyme. However, Zhang et al. used a free energy based approach in understanding such interactions.29 It may be worth mentioning here that the in silico studies have been used only as supporting tool for enzyme inhibition studies, therefore the advanced details of the docking studies are not included here. The in silico predicted behaviour of the enzyme–ligand interaction can give an idea about the interaction between these two, but cannot substitute for the in vitro studies. In the present study we found that different effects have been exerted by the related classes of compounds on cathepsin B, H and L activities. Compound 1d with electron withdrawing group i.e., –NO2 substituted at 4th position proved to be a good inhibitor of cathepsins H and compound 1f with fluoro as substituent at 4th position was more inhibitory to cathepsin B and L.
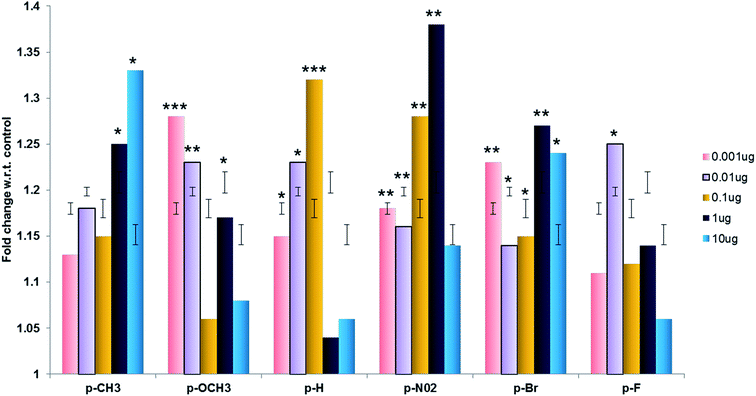 | ||
| Fig. 10 Proliferation index of cells in the presence of different compounds (1a–f). Cell proliferation in absence of the compounds was taken as 1 and fold change was calculated accordingly. | ||
Study of inhibitors of cathepsins B, H and L can be beneficial in the field of medicinal chemistry. For example the present study illustrate the role of dihydrofuran derivatives as potential inhibitors to cathepsin B, H and L add to the existing knowledge of non peptidyl inhibitors of these enzymes. Further these compounds did not show any cytotoxicity and promoted cell proliferation so these anti catheptic agents might be beneficial in treatment of inflammatory diseases where high cathepsins levels lead to cell death.
3. Conclusion
In the present work we have synthesized six novel 2-(2-naphthoyl)-6,6-dimethyl-3-aryl-2,3,6,7-tetrahydrobenzofuran-4(5H)-one (1a–f) and evaluated their effect on important proteolytic enzymes cathepsins B, H and L. The synthesized compounds were found to be potent inhibitors to the enzymes cathepsins B, H and L. Kinetic studies revealed that all compounds showed reversible competitive inhibition on cathepsin B, H and L with affinities upto sub nanomolar range. The compounds exhibited selective inhibition for cathepsin L. Cathepsin H is more susceptible as compared to cathepsin B. None of the synthesised compounds showed any cytotoxicity at different concentrations used. Compound 1d showed about 1.4 fold increase in cell proliferation at 1 μg concentration which is maximum among all compounds. These results can add to the existing knowledge of cathepsins B, H and L inhibitors not reported earlier and their possible role in conditions where elevated cathepsins levels cause cell damage.4. Experimental
4.1. Chemistry
Structures of all of the compounds were identified by their spectral data. Silica gel 60 F254 (precoated aluminium plates) from Merck were used to monitor reaction progress. Melting points were determined on melting point apparatus in open capillary and are uncorrected. IR (KBr) spectra were recorded on Perkin Elmer FTIR spectrophotometer and the values are expressed as νmax cm−1. The 1H and 13C spectra were recorded on Bruker 300 MHz NMR spectrometer at 300 MHz and 700 MHz respectively. The chemical shift values are recorded on δ scale and the coupling constants (J) are in Hertz. ELISA plate reader was used for measuring absorbance in the visible range.2-(2-Naphthoyl)-6,6-dimethyl-3-(4-methylphenyl)-2,3,6,7-tetrahydrobenzofuran-4(5H)-one (1a). Light yellow solid; mp: 146–148 °C; IR (KBr) νmax cm−1: 2962, 2878, 1690, 1636, 1512, 1396, 1211, 1173, 1034, 972; 1H NMR (CDCl3, 300 MHz) δ (ppm): 8.22 (s, 1H, Ar), 7.94–7.86 (m, 2H, Ar), 7.78–7.76 (d, 2H, Ar), 7.63–7.51 (m, 2H, Ar), 7.18–7.12 (m, 4H, Ar), 5.99–5.98 (d, J = 4.5 Hz, 1H, –CH), 4.40–4.39 (d, J = 4.5 Hz, 1H, CH), 2.66–2.51 (m, 2H, –CH2), 2.35 (s, 3H, –CH3), 2.26–2.14 (m, 2H, –CH2), 1.63–1.59 (m, 6H, –CH3); 13C NMR (CDCl3, 75 Hz) δ (ppm): 193.50, 192.90, 176.22, 138.35, 137.31, 135.98, 132.28, 131.13, 130.47, 129.76, 129.60, 129.10, 128.90, 127.88, 127.30, 127.08, 124.05, 115.16, 92.20, 51.20, 49.10, 37.71, 34.32, 29.09, 28.40, 21.15.
2-(2-Naphthoyl)-6,6-dimethyl-3-(4-methoxyphenyl)-2,3,6,7-tetrahydrobenzofuran-4(5H)-one (1b). Light yellow solid; mp: 161–162 °C; IR (KBr) νmax cm−1: 3842, 3742, 2962, 1697, 1628, 1551, 1512, 1458, 1427, 1281, 1242, 1119, 1026, 964; 1H NMR (CDCl3, 300 MHz) δ (ppm): 8.25 (s, 1H, Ar), 7.99–7.90 (m, 2H, Ar), 7.82–7.80 (d, 2H, J = 8.1 Hz, Ar), 7.68–7.55 (m, 2H, Ar), 7.22–7.20 (d, 2H, J = 7.4 Hz, Ar-H), 6.95–6.92 (d, J = 7.4 Hz, 2H, Ar-H), 6.03–6.01 (d, J = 4.8 Hz, 1H, CH), 4.44–4.43 (d, J = 4.5 Hz, 1H, –CH), 3.85 (s, 3H, –OCH3), 2.71–2.60 (m, 2H, –CH2), 2.26–2.23 (m, 2H, –CH2), 1.29–1.20 (m, 6H, –CH3); 13C NMR (CDCl3, 75 Hz) δ (ppm): 193.57, 192.91, 176.18, 159.09, 135.98, 133.44, 132.27, 131.14, 130.48, 129.61, 129.12, 128.92, 128.49, 127.89, 127.10, 124.04, 115.14, 114.49, 92.24, 55.34, 51.20, 48.81, 37.72, 34.32, 29.09, 28.40.
2-(2-Naphthoyl)-6,6-dimethyl-3-phenyl-2,3,6,7-tetrahydrobenzofuran-4(5H)-one (1c). Light yellow solid; mp: 140–142 °C; IR (KBr) νmax cm−1: 2916, 1690, 1628, 1497, 1396, 1219, 1188, 1142, 1088, 1026, 964; 1H NMR (CDCl3, 300 MHz) δ (ppm): 8.24 (s, 1H, Ar), 8.00–7.90 (m, 1H, Ar), 7.80–7.78 (d, J = 8.1 Hz, 2H, Ar), 7.68–7.55 (m, 2H, C10H7), 7.44–7.30 (m, 5H, C6H5), 6.07–6.05 (d, J = 4.8 Hz, 1H, –CH), 4.50–4.48 (d, J = 4.5 Hz, 1H, –CH); 2.72–2.56 (m, 2H, –CH2), 2.24–2.19 (m, 2H, –CH2), 1.21–1.20 (m, 6H, –CH3); 13C NMR (CDCl3, 75 Hz) δ (ppm): 193.49, 192.81, 176.36, 141.35, 135.99, 132.26, 131.17, 130.48–129.59, 129.13, 129.08, 128.92, 127.89, 127.67, 127.46, 127.11, 124.04, 115.04, 92.11, 51.19, 49.39, 37.72, 34.32, 29.07, 28.42.
2-(2-Naphthoyl)-6,6-dimethyl-3-(4-nitrophenyl)-2,3,6,7-tetrahydrobenzofuran-4(5H)-one (1d). Dark yellow solid; mp: 120–121 °C; IR (KBr) νmax cm−1: 2918, 1690, 1620, 1550, 1495, 1394, 1350, 1219, 1188, 1136, 1082, 1024, 960; 1H NMR (CDCl3, 300 MHz) δ (ppm): 8.25 (s, 1H, Ar), 7.95–7.90 (m, 2H, Ar), 7.84–7.82 (d, J = 8.1 Hz, 2H, Ar), 7.69–7.56 (m, 2H, Ar), 7.54–7.51 (d, J = 8.4 Hz, 2H, Ar), 7.18–7.16 (d, J = 8.4 Hz, 2H, Ar), 6.01–5.99 (d, J = 4.8 Hz, 1H, –CH), 4.49–4.47 (d, J = 4.5 Hz, 1H, –CH), 2.70–2.69 (m, 2H, –CH2), 2.31–2.18 (m, 2H, –CH2), 1.28–1.20 (m, 6H, –CH3); 13C NMR (CDCl3, 75 Hz) δ (ppm): 193.42, 192.47, 176.42, 140.38, 136.02, 132.20, 131.09, 130.45, 129.59, 129.24, 129.17, 129.02, 127.91, 127.24, 123.99, 121.62, 114.75, 91.68, 51.14, 48.70, 37.70, 34.35, 29.03, 28.41.
2-(2-Naphthoyl)-6,6-dimethyl-3-(4-bromophenyl)-2,3,6,7-tetrahydrobenzofuran-4(5H)-one (1e). Dark yellow solid; mp: 142–143 °C; IR (KBr) νmax cm−1: 3742, 2962, 2916, 2847, 1697, 1636, 1512, 1466, 1396, 1342, 1219, 1188, 1034, 972; 1H NMR (CDCl3, 300 MHz) δ (ppm): 8.28 (s, 1H, Ar), 8.26–8.27 (d, J = 1.8 Hz, 1H, Ar), 7.96–7.95 (d, J = 0.9 Hz, 1H, Ar), 7.94–7.91 (d, J = 8.4 Hz, 2H, Ar), 7.71–7.65 (m, 2H, Ar), 7.46–7.45 (d, 2H, Ar), 6.03–6.02 (d, J = 4.8 Hz, 1H, –CH), 4.73–4.71 (d, J = 4.5 Hz, 1H, –CH), 2.70–2.69 (m, 2H, –CH2), 2.27–2.25 (m, 1H, –CH2), 1.27–1.20 (m, 6H, –CH3); 13C NMR (CDCl3, 75 Hz) δ (ppm): 193.39, 192.01, 176.69, 148.58, 147.45, 136.08, 131.17, 130.47, 129.56, 129.41, 129.13, 128.47, 127.96, 127.38, 124.36, 123.96, 114.44, 91.16, 51.05, 48.45, 37.71, 34.43, 28.99, 28.42.
2-(2-Naphthoyl)-6,6-dimethyl-3-(4-fluorophenyl)-2,3,6,7-tetrahydrobenzofuran-4(5H)-one (1f). Creamish white solid; mp: 124–125 °C; IR (KBr) νmax cm−1: 3738, 2958, 2914, 2850, 1694, 1634, 1510, 1466, 1396, 1342, 1210, 1185; 1H NMR (CDCl3, 300 MHz) δ (ppm): 8.24 (s, 1H, Ar), 7.99–7.90 (m, 2H, Ar), 7.82–7.80 (d, J = 7.8 Hz, 2H, Ar), 7.69–7.56 (m, 2H, Ar), 7.28–7.24 (m, 2H, Ar), 7.12–7.06 (m, 2H, Ar), 6.02–6.00 (d, J = 4.8 Hz, 1H, –CH), 4.57–4.45 (d, J = 4.5 Hz, 1H, –CH); 2.64–2.60 (m, 2H, –CH2); 2.26–2.24 (m, 2H, –CH2); 1.28 (m, 6H, –CH3); 13C NMR (CDCl3, 75 Hz) δ (ppm): 192.56, 192.45, 176.07, 162.60, 160.18, 137.27, 135.35, 131.80, 129.32, 129.09, 129.01, 128.92, 128.47, 127.59, 126.96, 123.74, 115.38, 115.17, 113.95, 90.96, 78.63, 50.66, 47.37, 40.18, 39.76, 36.88, 28.32, 27.94.
4.2. Materials and methods
All the chemicals were of analytical grade. Fast Garnet GBC (o-aminoazotoluenediazonium salt), α-N-benzoyl-D,L-arginine-2-naphthylamide (BANA) and Leu-βNA were purchased from BachemFeinchemikalien AG, Switzerland. Sephadex G-100, CM-Sephadex C-50 and DEAE Sephadex A-50 were obtained from Pharmacia Fine Chemicals, Uppsala, Sweden. The protein sample was concentrated using Amicon stirred cells with YM 10 membrane under nitrogen pressure of 4–5 psi. The source of enzyme was fresh goat liver obtained from local slaughter house.4.3. Enzymatic studies
For MTT assay, HepG2 cells were seeded at a density of 5 × 10³ cells per well in a 96-well plate. After 24 h, cells were treated with different doses of compounds for a total duration of 48 h and incubated at 37 °C, 5% CO2 atmosphere. MTT reagent (5 mg ml−1) was added 4 h before the end of 48 h incubation period. At the end of 48 h cells were lysed by addition of 100 μl DMSO per well to lyse the cells and optical density was read at a wavelength of 565 nm (Tecan, M7500 pro). Proper solvent control and media control were considered during experimental design.
4.4. Structure determination of compound by X-ray crystallography
Authors contribution
Neera Raghav, Suman Jangra; designing, synthesis, anticatheptic activities and molecular docking: Shalmoli Bhattacharyya, Ajay Kumar; cytotoxicity assays, Deepak Wadhwa; synthesis: Jayant Sindhu; X-ray crystallographic studies.Acknowledgements
Among the authors, Suman Jangra thanks Kurukshetra University, Kurukshetra for providing necessary research laboratory facilities. Ajay kumar and Suman Jangra received fellowship from council of scientific and Industrial research, India.References
- Y. Ikeda, T. Ikata, T. Mishiro, S. Nakano, M. Ikebe and S. Yasuoka, J. Med. Investig., 2000, 47, 61–75 CAS.
- A. Baici, D. Horler, A. Lang, C. Merlin and R. Kissling, Ann. Rheum. Dis., 1995, 54, 281–288 CrossRef CAS PubMed.
- A. Baici, A. Lang, D. Horler, R. Kissling and C. Merlin, Ann. Rheum. Dis., 1995, 54, 289–297 CrossRef CAS PubMed.
- K. Kunimatsu, K. Yamamoto, E. Ichimaru, Y. Kato and I. Kato, J. Periodontal Res., 1990, 25, 69–73 CrossRef CAS PubMed.
- B. Lenarcic, D. Gabrijelcic, B. Rozman, M. Drobnic-Kosorok and V. Turk, Biol. Chem. Hoppe-Seyler, 1988, 369, 257–261 CrossRef CAS PubMed.
- T. Shikimi, D. Yamamoto and M. Hanada, J. Pharmacobio-Dyn., 1987, 10, 750–751 CrossRef CAS PubMed.
- M. M. Mohamed and B. F. Sloane, Nat. Rev. Cancer, 2006, 6, 764–775 CrossRef CAS PubMed.
- P. Fuentes-Prior and G. S. Salvesen, J. Biochem., 2004, 384, 201–232 CrossRef CAS PubMed.
- B. Turk, V. Stoka, J. Rozman-Pungercar, T. Cirman, G. Droga-Mazovec, K. Oresic and V. Turk, Biol. Chem., 2002, 383, 1035–1044 CAS.
- J. C. Reed, Cancer Cell, 2003, 3, 17–22 CrossRef CAS PubMed.
- M. Frizler, M. Stirnberg, M. T. Sisay and M. Gütschow, Curr. Top. Med. Chem., 2010, 10, 294–322 CrossRef CAS PubMed.
- (a) N. Raghav and M. Singh, Eur. J. Med. Chem., 2014, 77, 231–242 CrossRef CAS PubMed; (b) S. Garg and N. Raghav, RSC Adv., 2015, 5, 72937–72949 RSC; (c) I. Ravish and N. Raghav, RSC Adv., 2015, 5, 50440–50453 RSC; (d) N. Raghav and S. Garg, Eur. J. Pharm. Sci., 2014, 60, 55–63 CrossRef CAS PubMed; (e) N. Raghav and M. Singh, Eur. J. Pharm. Sci., 2014, 54, 28–39 CrossRef CAS PubMed.
- A. Closse, W. Haefliger, D. Hauser, H. U. Gubler, B. Dewaldand and M. J. Baggiolini, Med. Chem., 1981, 12, 1465–1471 CrossRef.
- Y. Malpani, R. Achary, S. Y. Kim, H. C. Jeong, P. Kim and S. B. Han, Eur. J. Med. Chem., 2013, 62, 534–544 CrossRef CAS PubMed.
- M. Ono, M. P. Kung, C. Hou and H. F. Kung, Nucl. Med. Biol., 2002, 29, 633–642 CrossRef CAS PubMed.
- B. A. Chauder, A. V. Kalinin, N. J. Taylor and V. Snieckus, Angew. Chem., Int. Ed., 1999, 38, 1435–1438 CrossRef CAS.
- (a) X. Wang, K. F. Bastow, C.-M. Sun, Y.-L. Lin, H.-J. Yu, M.-J. Don, T.-S. Wu, S. Nakamura and K.-K. Lee, J. Med. Chem., 2004, 47, 5816–5819 CrossRef CAS PubMed; (b) X. Wang, K. Nakagawa-Goto, K. F. Bastow, M.-J. Don, Y.-L. Lin, T.-S. Wu and K.-H. Lee, J. Med. Chem., 2006, 49, 5631–5634 CrossRef CAS PubMed.
- (a) R. T. Scannell and R. Stevenson, J. Heterocycl. Chem., 1980, 17, 1727–1728 CrossRef CAS; (b) A. L. Livingston, S. C. Witt, R. E. Lundin and E. M. Bickoff, J. Org. Chem., 1965, 30, 2353–2355 CrossRef CAS.
- P. Pahari and J. Rohr, J. Org. Chem., 2009, 74, 2750–2754 CrossRef CAS PubMed.
- (a) R. R. Juo and W. Herz, J. Org. Chem., 1985, 50, 700–703 CrossRef CAS; (b) P. A. Jacobi, D. G. Walker and I. M. A. Odeh, J. Org. Chem., 1981, 46, 2065–2069 CrossRef CAS; (c) M. Aso, A. Ojida, G. Yang, O. J. Cha, E. Osawaand and K. Kanematsu, J. Org. Chem., 1993, 58, 3960–3968 CrossRef CAS.
- (a) G. A. Kraus and N. Zhang, J. Org. Chem., 2000, 65, 5644–5646 CrossRef CAS PubMed; (b) T. Yao, D. Yue and R. C. Larock, J. Org. Chem., 2005, 70, 9985–9989 CrossRef CAS PubMed.
- (a) V. Singh and S. Batra, Tetrahedron, 2008, 64, 4511–4574 CrossRef CAS; (b) J. Iqbal, B. Bhatia and N. K. Nayyar, Chem. Rev., 1994, 94, 519–564 CrossRef CAS; (c) B. B. Snider, Chem. Rev., 1996, 96, 339–363 CrossRef CAS PubMed.
- D. L. Nelson, A. L. Lehninger and M. M. Cox, Principles of Biochemistry, W. H. Freeman, New York, 4th edn, 2008 Search PubMed.
- C. P. Huber, R. L. Campbell, S. Hasnain, T. Hirama and R. To, Crystal structure of the tetragonal form of human liver cathepsin B, 2013, http://www.ebi.ac.uk/pdbe-srv/view/entry/2ipp/citation.html Search PubMed.
- C. G. Knight, Biochem. J., 1980, 189, 447–453 CrossRef CAS PubMed.
- G. Guncar, M. Podobnik, J. Pungercar, B. Strukelj, V. Turk and D. Turk, Structure, 1998, 6, 51–61 CrossRef CAS PubMed.
- (a) N. Raghav, R. C. Kamboj, S. Parnami and H. Singh, Indian J. Biochem. Biophys., 1995, 32, 279–285 CAS; (b) J. M. Yang, Y. F. Chen, T. W. Shen, B. S. Kristal and D. F. Hsu, J. Chem. Inf. Model., 2005, 45, 1134–1146 CrossRef CAS PubMed.
- S. F. Chowdhary, L. Joseph, S. Kumar, S. R. Tulsidas, S. Bhat, E. Ziomek, R. M. Menard, J. Sivaraman and E. O. Purisima, J. Med. Chem., 2008, 51, 1361–1368 CrossRef PubMed.
- Z. Zhang, V. Martiny, D. Lagorce, Y. Ikeguchi, E. Alexov and M. A. Miteva, PLoS One, 2014, 9, 1108884 Search PubMed.
- N. Raghav, M. Singh, S. Garg, I. Ravish, R. Kaur and Suman, Int. J. Pharma Sci. Res., 2015, 6, 2944–2949 CAS.
- R. C. Kamboj, S. Pal, N. Raghav and H. Singh, Biochimie, 1993, 75, 873–878 CrossRef CAS PubMed.
- T. Mosmann, J. Immunol. Methods, 1983, 65, 55–63 CrossRef CAS PubMed.
- M. K. Houseweart, A. Vilaythong, X. M. Yin, B. Turk, J. L. Noebels and R. M. Myers, Cell Death Differ., 2003, 10, 1329–1335 CrossRef CAS PubMed.
- C. M. Moorhoff, Tetrahedron Lett., 1996, 37, 9349–9352 CrossRef CAS.
- L. A. Pennacchio, D. M. Bouley, K. M. Higgins, M. P. Scott, J. L. Noebels and R. M. Myers, Nat. Genet., 1998, 20, 251–258 CrossRef CAS PubMed.
Footnote |
| † Electronic supplementary information (ESI) available. CCDC 978246. For ESI and crystallographic data in CIF or other electronic format see DOI: 10.1039/c6ra06480a |
| This journal is © The Royal Society of Chemistry 2016 |

