A ruthenium derivative of quercetin with enhanced cholesterol-lowering activity

M. Cuccioloni*a, L. Bonfilia, M. Mozzicafreddoa, V. Cecarinia, R. Pettinarib, F. Condellob, C. Pettinarib, F. Marchettic, M. Angelettia and A. M. Eleuteria
aSchool of Biosciences and Veterinary Medicine, University of Camerino, Via Gentile III da Varano, 62032 Camerino, MC, Italy. E-mail: massimiliano.cuccioloni@unicam.it
bSchool of Pharmacy, University of Camerino, Italy
cSchool of Science and Technology, University of Camerino, Italy

Received 10th March 2016 , Accepted 13th April 2016

First published on 14th April 2016


Abstract

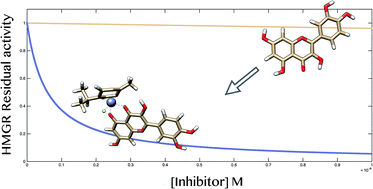
A ruthenium(II) p-cymene derivative of quercetin was synthesized and functionally tested for cholesterol-lowering ability via direct 3-hydroxy-3-methyl-glutaryl-CoA reductase (HMGR) inhibition. Ruthenium complexation dramatically increased the inhibition potency of the parent quercetin toward HMGR, with a consequent enhancement of the cholesterol-lowering effect in hepatic cells.

Introduction

Natural polyphenols are an important part of the human diet, and their routine consumption has been associated with a lower risk of developing pathological conditions, among these cancer1,2 and cardiovascular disorders.3 Specifically, these molecules exert a broad range of biological activities, which have been reported to regulate ROS,4 cell proliferation,5 apoptosis,6 angiogenesis,7 and cholesterol homeostasis.8,9 In particular, some polyphenols have been shown to exert their cholesterol-lowering action by directly blocking the activity of 3-hydroxy-3-methyglutaryl coenzyme A reductase (HMGR),10 an endoplasmic reticulum-bound enzyme that rate-regulates early stages of cholesterol biosynthesis, thus representing a possible non-toxic alternative to statin-based treatments11,12 in non-life threatening conditions, as confirmed by studies on regular vegetables (and/or vegetable derivatives) consumers.13 Herein, in the light of the promising evidences supporting the use of metals in the potentiation of bioactive compounds,14,15 we synthesized a ruthenium(II) p-cymene derivative of quercetin, one of the most abundant polyphenol in human diet, and we tested its ability to decrease cholesterol levels via HMG-CoA reductase inhibition according to a concerted approach based on computational, cell-free and cell-based studies.

Results and discussion

Synthesis of [(p-cymene)Ru(que)Cl]

A methanol solution (5 mL) of KOH (9 mg, 0.165 mmol) was added to quercetin (queH, 50 mg, 0.165 mmol) dissolved in acetonitrile (20 mL). The mixture was stirred for 30 min at room temperature in inert N2 atmosphere and then [Ru(p-cym)Cl2]2 (50 mg, 0.0825 mmol) was added. The resulting solution was stirred at room temperature for 1 h. The solvent was removed under reduced pressure, dichloromethane (10 mL) was added and the mixture was filtered to remove potassium chloride. N-Hexane (10 mL) was added and upon solvent removal, the brown precipitate was analysed and shown to be the title compound (32 mg, 0.055 mmol, yield 33%). It is soluble in DMSO, alcohols, acetone, acetonitrile and slightly soluble in chlorinated solvents. Mp 168–170 °C. Anal. calcd for C25H24ClO7Ru: C, 52.40; H, 4.22. Found: C, 52.21; H, 4.12. IR (cm−1): 3275br, 2960m ν(Carom-H), 1645m, 1603s ν(C[double bond, length as m-dash]O), 1510s ν(C[double bond, length as m-dash]C), 1427m, 1360s, 1315s, 1247s, 1200s, 1171vs, 1091m, 1055m, 999m, 931m, 877m, 788m, 704m, 689m. 1H NMR (CD3OD, 298 K): δ, 1.29 (d, 6H, CH3C6H4CH(CH3)2), 2.19 (s, 3H, CH3C6H4CH(CH3)2), 2.78 (m, 1H, CH3C6H4CH(CH3)2), 5.64d, 5.87d (4H, CH3C6H4CH(CH3)2), 6.17 (s, 1H, C(6)H of que), 6.38 (s, 1H, C(8)H of que), 6.88 (d, 1H, C(5′)H of que), 7.62 (d, 1H, C(6′)H of que), 7.73 (s, 1H, C(2′)H of que). 13C NMR (DMSO, 298 K): δ, 18.5 (s, CH3C6H4CH(CH3)2), 22.2 (s, CH3C6H4CH(CH3)2), 30.6 (s, CH3C6H4CH(CH3)2), 86.2, 87.1, 100.7, 107.0 (s, CH3C6H4CH(CH3)2), 94.0 (s, C(8) of que), 98.8 (s, C(6) of que), 103.6 (s, C(10) of que), 115.7 (s, C(2′) of que), 116.2 (s, C(5′) of que), 120.6 (s, C(6′) of que), 122.6 (s, C(1′) of que), 136.4 (s, C(3) of que), 145.7 (s, C(3′) of que), 147.4 (s, C(2) of que), 148.3 (s, C(4′) of que), 156.8 (s, C(9) of que), 161.4 (s, C(5) of que), 164.5 (s, C(7) of que), 176.5 (s, C(4) of que). ESI-MS(+) CH3OH (m/z, relative intensity%): 537 [100] [(p-cymene)Ru(que)]+, 573 [70] [Na((p-cymene)Ru(que))2(μ-OH)(CH3OH)]2+.

Finally, [(p-cymene)Ru(que)] (Fig. 1) was isolated by RP-HPLC.


image file: c6ra06403e-f1.tif
Fig. 1 Chemical structure of [(p-cym)Ru(que)Cl] derivative.

Molecular docking study

Computational analyses were performed using Autodock Vina software.16 Docking studies on the X-ray crystal structure of the human HMGR predicted potential differences in the binding behaviour between Que/HMGR and Ru-Que/HMGR both in terms of interaction strength and binding geometry. Specifically, quercetin was calculated to selectively target the cofactor-binding portion of the catalytic site of the reductase (Fig. 2).
image file: c6ra06403e-f2.tif
Fig. 2 Molecular docking of Ru-Que (Box A) and Que (Box B) within the catalytic region of HMG-CoA reductase. Surface, and cartoon and stick representations with H-bonds formed are shown in left and right panels, respectively. Carbon atoms of catalytic residues are highlighted in pink.

Conversely, Ru-Que accommodated within the substrate cleft with the p-cymene ring pointing outside of the active site. According to this predictive model, the polyphenol and the arene part of the derivative were in close proximity of Glu559, Lys691, and Asp767, three of the catalytic residues involved in substrate recognition17 (Fig. 2, panel A). Additionally, a nearly 3-fold increase in binding affinity was predicted for Ru-Que (KD,Ru-Que,p = 0.49 μM), with respect to quercetin (KD,Que,p = 1.3 μM). The analysis of energy components (Table 1), revealed a major contribution of the steric interactions (with higher Gauss contribution) and of the hydrophobic interaction in the higher stability of Ru-Que/HMGR complex.

Table 1 Energy contributions to total free energy of binding (kcal mol−1)
  Gauss 1 Gauss 2 Repulsion Hydrophobic Hydrogen
Quercetin 82.67 1101.73 2.82 8.41 5.22
Ru-Que 75.67 1409.18 3.39 19.71 4.60


SPR binding study

A comparative analysis of the kinetics of the binding between quercetin and Ru-Que to human HMGR was performed on an optical biosensor. HMGR was surface anchored as described in the methods section to an optimal surface density that minimized possible hindering effects during recognition events. Next, either quercetin or Ru-Que was added at increasing concentrations in the range 81 nM–3.6 μM and 81 nM–2.1 μM, respectively. Kinetic raw data were globally-fit to standard single- and double-exponential binding models as previously reported (Fig. 3).18
image file: c6ra06403e-f3.tif
Fig. 3 Representative overlay of association and dissociation kinetics of soluble Que (Box A) and Ru-Que (Box B) to surface-bound HMG-CoA reductase.

Monophasic kinetics were always observed upon the addition of both soluble compounds (the biphasic model was always statistically non-significant at 95% confidence as checked by a standard F-test procedure). This experimental approach confirmed the predicted increase in the binding affinity for HMGR of quercetin upon ruthenium complexation (KD,Q = [2.85 ± 0.26] μM, KD,RuQ = [91 ± 19] nM), with association (kass,Q = [19[thin space (1/6-em)]000 ± 2000] M−1 s−1; kass,RuQ = [46[thin space (1/6-em)]000 ± 9000] M−1 s−1), and more evidently dissociation events (kdiss,Q = [0.0541 ± 0.005] s−1; kdiss,RuQ = [0.0041 ± 0.0009] s−1) significantly contributing to enhance the stability of the complex.

Additionally, in line with computational predictions the pre-saturation of HMGR layer with either HMG-CoA or NADPH prevented the binding of Ru-Que and quercetin, respectively.

Inhibition study

The modulatory effect of quercetin and Ru-Que on HMGR was evaluated by measuring the enzymatic activity of both isolated and microsomal HMGR from human liver carcinoma HepG2 cells according to a chromatography-based method.19 In detail, the enzymatic residual activity was monitored upon 60 min pre-incubation of the HMGR with increasing levels of Que (0–2 mM), Ru-Que (0–0.5 mM), pravastatin (0–5 μM) and simvastatin (0–100 μM).

The pre-formed enzyme–inhibitor complex was added to 1.55 μM HMG-CoA and 2.68 mM NADPH dissolved in the activity buffer (100 mM phosphate, 1 mM EDTA, 10 mM DTT, and 2% DMSO at pH 6.8), and stored for 60 min at 37 °C. The resulting mixture was separated by RP-HPLC. Residual activities, expressed as the ratio of mevalonate levels in the presence and in the absence of a given inhibitor concentration, were derived from raw data using a standard model for reversible competitive inhibition.20 Hydrophilic pravastatin and hydrophobic simvastatin were used as reference inhibitors of HMGR.

Isolated HMGR activity was clearly dependent on each treatment, as shown in Fig. 4, panel A. The superimposition of inhibitions curves and the comparison of inhibition constants showed that the complexation with ruthenium induced a nearly 200-fold increase in the inhibition potency of Que (Table 2). The observed inhibitory potency was retained also against microsomal HMGR from HepG2 cells (Fig. 4, panel B), although to a generally lower extent with respect to cell-free assay. With respect to Ki values obtained from the analysis on isolated enzymes, minor changes were observed (Table 2), but the overall inhibition trend was maintained (again, Ru-complexation enhanced quercetin inhibitory potency by more than 200-fold).


image file: c6ra06403e-f4.tif
Fig. 4 Residual activity plot of isolated (Box A) and microsomal HMGR (Box B) in the presence of quercetin (●), Ru-Quercetin (▲), simvastatin (◆) and pravastatin (■). Raw data for the HMGR inhibition were fitted to eqn (1).
Table 2 Experimentally obtained Ki values for isolated and microsomal HMGR activity calculated from the fit of raw data to eqn (1)
  Ki,isolated (M) Ki,microsomal (M)
Quercetin (2.03 ± 0.21) × 10−5 (3.88 ± 1.32) × 10−5
Ru-Que (9.23 ± 1.13) × 10−8 (1.69 ± 0.33) × 10−7
Pravastatin (5.90 ± 2.18) × 10−10 (8.43 ± 0.98) × 10−9
Simvastatin (4.82 ± 1.65) × 10−8 (1.28 ± 0.54) × 10−7


Effect on cholesterol levels

Finally, cytoplasmic cholesterol levels in HepG2 cells upon treatment were measured to assess the effective cholesterol-lowering capacity of Ru-Que, in comparison with both the parent compound and two commercial statins. After 4 h incubation at 37 °C in the presence of 5 and 50 μM of each compound, cytoplasmic cholesterol concentration was measured using AmplexRed Cholesterol Assay kit. After 4 h, fluorescence measurements were recorded (λexc = 540 nm, λem = 590 nm).

Our results indicated a dose-dependent diminution of cytoplasmic cholesterol for all four tested compounds (Fig. 5). Remarkably, Ru-Que showed a cholesterol cytoplasmic lowering ability significantly higher than the parent compound and comparable to those observed for both pravastatin and (in particular) simvastatin.


image file: c6ra06403e-f5.tif
Fig. 5 Cholesterol cytoplasmic concentration upon 4 h treatment with 5–50 μM Que, Ru-Que, simvastatin and pravastatin.

Evaluation of cytotoxicity

Interestingly, Ru-Que had a negligible cytotoxicity (lower than Que) on HepG2 cells in the range of concentration tested in the cholesterol assay, the only significant effect being evident at 100 μM (Fig. 6).
image file: c6ra06403e-f6.tif
Fig. 6 Results of MTT viability assay on HepG2 after treatment with 0–100 μM of Que, Ru-Que, simvastatin and pravastatin for 24 h.

Most importantly, simvastatin, which is known to induce more evident side effects, showed higher toxicity with respect to Ru-Que (remanding to its use as potential anticancer agent), although presenting similar cholesterol-lowering potency.

Experimental

Materials

Carboxylate cuvettes, ethanolamine, 1-ethyl-3-(3-dimethylaminopropyl)-carbodiimide (EDC), and N-hydroxysuccinimide (NHS) were obtained from Farfield Group (Cheshire, UK). [(p-Cymene)RuCl2]2 dimer, quercetin, Na2HPO4, CH3COONa, KCl, NaCl, Tween-20, EDTA, DTT, DMSO, quercetin, HMG-CoA, NADPH, Tris, sucrose, PMSF, TPCK, simvastatin and pravastatin were all obtained from Sigma-Aldrich (Milan, Italy). HepG2 epithelial hepatic carcinoma cells were obtained from American Type Culture Collection (ATCC, Manassas, VA). All chemicals were of the highest grade available. All other materials were obtained from commercial sources and were used as received. The Cary 1E UV-vis spectrophotometer was obtained from Varian (Palo Alto, CA). The IAsys plus biosensor came from Thermo Fisher Scientific (Milan, Italy). The HPLC system Gold equipped with a UV-vis detector, and HPLC column heater were obtained from Beckman Coulter S.p.A. (Milan, Italy). The Luna C18 column (5 μm particle size, 250 × 4.6 mm, equipped with a 5 mm guard column) was purchased from Phenomenex Italia (Bologna, Italy). IR spectra were recorded from 4000 to 600 cm−1 on a Perkin-Elmer Spectrum FT/IR-FIR Frontier instrument. 1H and 13C NMR spectra were recorded on a 400 Mercury Plus Varian instrument operating at room temperature (400 MHz for 1H and 100 MHz for 13C) relative to TMS. Positive and negative ion electrospray ionization mass spectra (ESI-MS) were obtained on a Series 1100 MSI detector HP spectrometer using methanol as the mobile phase. Solutions (3 mg mL−1) were prepared using reagent-grade methanol. Masses and intensities were compared to those calculated using IsoPro Isotopic Abundance Simulator, version 2.1.28. Melting points were recorded on a STMP3 Stuart scientific instrument and on a capillary apparatus. Samples for microanalysis were dried in vacuo to constant weight (20 °C, ca. 0.1 Torr) and analysed on a Fisons Instruments 1108 CHNS-O elemental analyser.

Bioinformatics

Molecular docking analyses were performed on an Intel core I7/Mac OS X 10.11-based platform using Autodock Vina software.16 The X-ray crystal structure of human HMGR (pdb entry: 3CCT21) was obtained from the Protein Data Bank,22 while the three-dimensional structures of quercetin and of ruthenium(II) p-cymene derivative thereof (Ru-Que) were built and minimized using the Avogadro software (version 1.1.0).23 Polar hydrogen atoms were added to the protein prior to any analysis. Autodock, a software performing a Lamarckian genetic algorithm to explore the binding possibilities of a ligand in a binding pocket,24 was used setting a grid of 30 × 27 × 23 points around both HMG-CoA and NADPH binding sites with a grid spacing of 1 Å, a root-mean-square (rms) tolerance of 0.8 Å, and a maximum of 2[thin space (1/6-em)]500[thin space (1/6-em)]000 energy evaluations. Other parameters were set to default values.25 Autodock output files were rendered with PyMOL (Python Molecular Graphics – 2006; DeLano Scientific LLC, San Carlos, CA). PyMOL was also used to calculate the length of theoretical hydrogen bonds, measured between the hydrogen and predicted binding atom.

SPR binding study

HMGR was covalently anchored onto a carboxylate surface as described elsewhere.10 Briefly, the sensing surface was set at 37 °C, and sequentially rinsed with PBS-T (10 mM Na2HPO4, 2.7 mM KCl, 138 mM NaCl, 0.05% (v/v) Tween-20, pH 7.4), and detergent-free PBS, prior to the activation of carboxylic groups with an equimolar EDC/NHS solution.26 HMGR (dissolved 10 mM CH3COONa, pH 5.5 to a final concentration of 0.2 mg mL−1) was incubated over the surface for 20 min, and inefficiently bound enzyme was removed by PBS wash. Non-reacted carboxylic groups of the biosensor surface were deactivated with 1 M ethanolamine. Next, either quercetin or Ru-Que was added at increasing concentrations (81 nM–3.6 μM and 81 nM–2.1 μM, respectively), each time assessing baseline recovery prior to any further addition of the soluble ligands. If necessary, surface regeneration rate was increased without affecting its stability by CH3COONa washes at pH 5.5, the affinity of the interaction being significantly diminished at lower pH conditions. Raw data were analysed with Fast Fit software V.2.03 (Fison Applied Sensor Technology – Affinity Sensors).

Inhibition studies

Inhibition of isolated HMGR. The effect of quercetin and Ru-Que on the enzymatic activity of HMGR was tested according to a chromatography-based method.19 In detail, the enzymatic residual activity was monitored upon 60 min pre-incubation of isolated HMGR (0.4 μM) with increasing levels of single compounds. The pre-formed complex was added to 1.55 μM HMG-CoA and 2.68 mM NADPH dissolved in the activity buffer (100 mM phosphate, 1 mM EDTA, 10 mM DTT, and 2% DMSO at pH 6.8), and stored for 60 min at 37 °C. The resulting mixture (10 μL) was separated with a Phenomenex Luna C18 reverse-phase (RP)-HPLC column thermostatted at 26 ± 0.1 °C, monitoring both the decrease in HMG-CoA/NADPH consumption and mevalonate/NADP+ production rates. Residual activities, expressed as the ratio of mevalonate levels in the presence and in the absence of a given inhibitor concentration, were derived from raw data using a standard model for reversible competitive inhibition:20
 
image file: c6ra06403e-t1.tif(1)
where [HMGRt] is the total concentration of HMGR, [I] is the concentration of either quercetin or Ru-Que, [S0] is the saturating concentration of used substrate and Km is the substrate concentration for half maximal velocity. Hydrophilic pravastatin and hydrophobic simvastatin were used as reference inhibitors of HMGR.
Inhibition of cellular HMGR. The effects of Que, Ru-Que, simvastatin and pravastatin were tested also on microsomal HMGR from human liver carcinoma HepG2 cell lines. Cells were grown in a 5% CO2 atmosphere at 37 °C in 100 mm tissue culture dishes. Growth medium was MEM supplemented with 10% FBS, 1% sodium pyruvate, antibiotic and antimycotic. Upon confluence, cells contained in two flasks were harvested and centrifuged at 8000 × g for 5 min. Pellet was suspended in 2 mL of PBS and centrifuged at 10[thin space (1/6-em)]000 × g for 5 min. The obtained pellet was re-suspended in inhibition buffer (HEPES 5 mM, sucrose 0.25 mM, PMSF 100 μM and leupeptin 100 μM, pH 7.4). The cell suspension was lysed using a syringe with a 29-gauge needle. The lysate was centrifuged at 20[thin space (1/6-em)]000 × g for 15 min at 4 °C. The supernatant was collected and centrifuged at 100[thin space (1/6-em)]000 × g for 60 min at 4 °C. Microsomal pellet was suspended in the activity buffer. Total protein content was determined according to the method of Lowry et al.27 HMGR activity was tested in the microsomal fraction in the presence of increasing concentrations of Que (0–2 mM) Ru-Que (0–0.5 mM) pravastatin (0–5 μM) and simvastatin (0–100 μM), using the same protocol used for the isolated enzyme. Prior to injection, a centrifugation step at 10[thin space (1/6-em)]000 × g for 10 min was necessary to precipitate cell membranes. HMGR residual activity and inhibition constant for each inhibitory compound were calculated.

Effect on cholesterol levels

Cytoplasmic cholesterol levels in HepG2 cells upon treatment were measured to assess the effective cholesterol-lowering capacity of Ru-Que, in comparison with both the parent compound and pravastatin and simvastatin. After 4 h incubation at 37 °C in the presence of 5 and 50 μM of each compound, cells were trypsinized, washed with PBS, and centrifuged at 8000 × g for 5 min. For each sample, cytoplasmic cholesterol concentration was measured using AmplexRed Cholesterol Assay kit. Briefly, the pellets were suspended in 40 μL of 1× reaction buffer and lysed with a 29G syringe. The working solution, containing Amplex® Red reagent (300 μM), horseradish peroxidase (2 U mL−1), cholesterol oxidase (2 U mL−1), and cholesterol esterase (0.2 U mL−1) in 1× reaction buffer was freshly prepared before each experiment. Cholesterol reference standard curve was prepared diluting cholesterol reference standard (5.17 mM) in 1× reaction buffer. 50 μL of working solution, 40 μL of 1× reaction buffer and 40 μL of cell lysates were placed in a 96-well plate and incubated at 37 °C for 30 min. After 4 h, fluorescence measurements were recorded (λexc = 540 nm, λem = 590 nm) using a SpectraMax Gemini XPS microplate reader (Molecular Device, Milan – Italy).

Cell viability

Tetrazolium salt MTT (3-(4,5-dimethylthiazol-2-yl)-2,5-diphenyltetrazolium bromide) assay is based on the conversion of soluble tetrazolium into insoluble blue formazan crystals. The tetrazolium ring is cleaved only in active mitochondria, thus only in living cells. MTT concentration can be read at 570 nm on a scanning multiwell spectrophotometer (ELISA reader).28 MTT assay was performed on HepG2 cells treated for 24 h with increasing concentrations of Ru-Que (0–100 μM), Que (0–100 μM), pravastatin (0–100 μM) and simvastatin (0–100 μM) to test their toxicity (concentrations were chosen based on HMGR activity tests). An adequate number of cells were plated in a 96-well plate (5 five replicates each). Compounds were added and cells were incubated for 24 h at 37 °C. Culture medium containing MTT (0.5 mg mL−1) was added and left for 2 h. After removing MTT, DMSO was added for 10 min and finally optical density was measured at 570 nm with a multiwell scanning spectrophotometer. Viability was calculated following the equation: % viability = [(OD 570 nm) sample/(OD 570 nm) negative control] × 100.

Statistical analysis

Results are expressed throughout as mean values ± standard deviation of data obtained from five separate experiments. Statistical analysis was performed with one-way ANOVA, followed by the Bonferroni test using MatLab R2015b. p values < 0.05 were considered statistically significant.

Conclusions

Natural products and synthetic compounds share a critical role in the development of novel pharmaceuticals. Constant improvements in synthetic methodology have provided practical access to a vast array of synthetic and semi-synthetic substances, these latter being regarded as intermediate between natural and synthetic substances.

On such a basis, we synthesized an organometallic derivative of quercetin in the effort of improving its biological activity. Computational docking analysis suggested that (differently from parent counterpart) Ru-Que derivative could accommodate within the substrate-binding portion of HMGR active site. A significant difference in the predicted binding affinity, likely attributable to the higher structural rigidity and a more favourable conformation conferred by arene-Ru complexation (and capable of preventing the access of HMG-CoA to the catalytic region) was observed.

These theoretical differences were experimentally validated both in cell-free and in cell-based assays. In detail, the inhibition of isolated HMGR by quercetin, as well as the calculated binding affinity, were strongly enhanced upon functionalization to reach a statin-like potency (Ki was in the same nanomolar range of the hydrophobic simvastatin), the kinetic dissection of binding revealing a major contribution of dissociation events in the stabilization of the complex. A fully comparable behaviour was observed on microsomal HMGR, even if with a general 2-fold decrease in inhibitory potencies for all compound tested with respect to cell-free assay. Finally and most interestingly, non-cytotoxic level of the Ru-Que were highly effective in lowering cytoplasmic cholesterol levels in HepG2 human hepatocarcinoma cells at 4 h, again with an efficacy fully comparable to more cytotoxic simvastatin. Globally, the relevant enhancement to bioactive properties of quercetin induced by Ru(II) complexation represents a stimulating starting point for the development of new semi-synthetic pharmaceutical agents to be used in the treatment of hypercholesterolemia.

Acknowledgements

The authors thank the University of Camerino for financial support.

References

  1. L. Bonfili, V. Cecarini, M. Amici, M. Cuccioloni, M. Angeletti, J. N. Keller and A. M. Eleuteri, FEBS J., 2008, 275, 5512–5526 CrossRef CAS PubMed.
  2. C. Spatafora and C. Tringali, Anti-Cancer Agents Med. Chem., 2012, 12, 902–918 CrossRef CAS PubMed.
  3. A. Tresserra-Rimbau, E. B. Rimm, A. Medina-Remon, M. A. Martinez-Gonzalez, R. de la Torre, D. Corella, J. Salas-Salvado, E. Gomez-Gracia, J. Lapetra, F. Aros, M. Fiol, E. Ros, L. Serra-Majem, X. Pinto, G. T. Saez, J. Basora, J. V. Sorli, J. A. Martinez, E. Vinyoles, V. Ruiz-Gutierrez, R. Estruch, R. M. Lamuela-Raventos and P. S. Investigators, Nutr., Metab. Cardiovasc. Dis., 2014, 24, 639–647 CrossRef CAS PubMed.
  4. N. Saint-Cricq De Gaulejac, C. Provost and N. Vivas, J. Agric. Food Chem., 1999, 47, 425–431 CrossRef CAS PubMed.
  5. M. Kampa, A. Hatzoglou, G. Notas, A. Damianaki, E. Bakogeorgou, C. Gemetzi, E. Kouroumalis, P. M. Martin and E. Castanas, Nutr. Cancer, 2000, 37, 223–233 CrossRef CAS PubMed.
  6. H. C. Li, S. Yashiki, J. Sonoda, H. Lou, S. K. Ghosh, J. J. Byrnes, C. Lema, T. Fujiyoshi, M. Karasuyama and S. Sonoda, Jpn. J. Cancer Res., 2000, 91, 34–40 CrossRef CAS PubMed.
  7. L. Duluc, C. Jacques, R. Soleti, F. Iacobazzi, G. Simard and R. Andriantsitohaina, Int. J. Biochem. Cell Biol., 2013, 45, 783–791 CrossRef CAS PubMed.
  8. S. Meguro, T. Hasumura and T. Hase, Nutr. Metab., 2013, 10, 61 Search PubMed.
  9. T. Tamura, N. Inoue, M. Ozawa, A. Shimizu-Ibuka, S. Arai, N. Abe, H. Koshino and K. Mura, Biosci., Biotechnol., Biochem., 2013, 77, 1306–1309 CrossRef CAS PubMed.
  10. M. Cuccioloni, M. Mozzicafreddo, M. Spina, C. N. Tran, M. Falconi, A. M. Eleuteri and M. Angeletti, J. Lipid Res., 2011, 52, 897–907 CrossRef CAS PubMed.
  11. T. Carbonell and E. Freire, Biochemistry, 2005, 44, 11741–11748 CrossRef CAS PubMed.
  12. A. Corsini, F. M. Maggi and A. L. Catapano, Pharmacol. Res., 1995, 31, 9–27 CrossRef CAS PubMed.
  13. C. Koebnick, A. L. Garcia, P. C. Dagnelie, C. Strassner, J. Lindemans, N. Katz, C. Leitzmann and I. Hoffmann, J. Nutr., 2005, 135, 2372–2378 CAS.
  14. R. Pettinari, C. Pettinari, F. Marchetti, B. W. Skelton, A. H. White, L. Bonfili, M. Cuccioloni, M. Mozzicafreddo, V. Cecarini, M. Angeletti, M. Nabissi and A. M. Eleuteri, J. Med. Chem., 2014, 57, 4532–4542 CrossRef CAS PubMed.
  15. L. Bonfili, R. Pettinari, M. Cuccioloni, V. Cecarini, M. Mozzicafreddo, M. Angeletti, G. Lupidi, F. Marchetti, C. Pettinari and A. M. Eleuteri, ChemMedChem, 2012, 7, 2010–2020 CrossRef CAS PubMed.
  16. O. Trott and A. J. Olson, J. Comput. Chem., 2010, 31, 455–461 CAS.
  17. L. Tabernero, D. A. Bochar, V. W. Rodwell and C. V. Stauffacher, Proc. Natl. Acad. Sci. U. S. A., 1999, 96, 7167–7171 CrossRef CAS.
  18. M. Mozzicafreddo, M. Cuccioloni, L. Bonfili, A. M. Eleuteri, E. Fioretti and M. Angeletti, Biochim. Biophys. Acta, 2008, 1784, 995–1001 CrossRef CAS PubMed.
  19. M. Mozzicafreddo, M. Cuccioloni, A. M. Eleuteri and M. Angeletti, J. Lipid Res., 2010, 51, 2460–2463 CrossRef CAS PubMed.
  20. J. G. Bieth, Some Kinetic Consequences of the Tight Binding of Protein-Proteinase-Inhibitors to Proteolytic Enzymes and Their Application to the Determination of Dissociation Constants, Springer-Verlag, Berlin, 1974 Search PubMed.
  21. R. W. Sarver, E. Bills, G. Bolton, L. D. Bratton, N. L. Caspers, J. B. Dunbar, M. S. Harris, R. H. Hutchings, R. M. Kennedy, S. D. Larsen, A. Pavlovsky, J. A. Pfefferkorn and G. Bainbridge, J. Med. Chem., 2008, 51, 3804–3813 CrossRef CAS PubMed.
  22. H. M. Berman, J. Westbrook, Z. Feng, G. Gilliland, T. N. Bhat, H. Weissig, I. N. Shindyalov and P. E. Bourne, Nucleic Acids Res., 2000, 28, 235–242 CrossRef CAS PubMed.
  23. M. D. Hanwell, D. E. Curtis, D. C. Lonie, T. Vandermeersch, E. Zurek and G. R. Hutchison, J. Cheminf., 2012, 4, 17 CAS.
  24. G. M. Morris, R. Huey, W. Lindstrom, M. F. Sanner, R. K. Belew, D. S. Goodsell and A. J. Olson, J. Comput. Chem., 2009, 30, 2785–2791 CrossRef CAS PubMed.
  25. M. Mozzicafreddo, M. Cuccioloni, V. Cecarini, A. M. Eleuteri and M. Angeletti, J. Chem. Inf. Model., 2009, 49, 401–409 CrossRef CAS PubMed.
  26. P. R. Edwards, P. A. Lowe and R. J. Leatherbarrow, J. Mol. Recognit., 1997, 10, 128–134 CrossRef CAS PubMed.
  27. O. H. Lowry, N. J. Rosebrough, A. L. Farr and R. J. Randall, J. Biol. Chem., 1951, 193, 265–275 CAS.
  28. T. Mosmann, J. Immunol. Methods, 1983, 65, 55–63 CrossRef CAS PubMed.

This journal is © The Royal Society of Chemistry 2016