DOI:
10.1039/C6RA06365A
(Paper)
RSC Adv., 2016,
6, 57108-57116
Coupling catalytic hydrolysis and oxidation on metal-modified activated carbon for HCN removal
Received
10th March 2016
, Accepted 26th May 2016
First published on 27th May 2016
Abstract
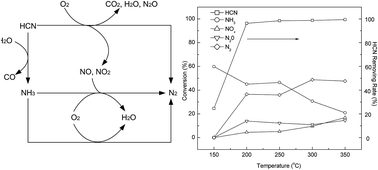
A method of coupling catalytic hydrolysis and oxidation for HCN removal by metal-modified activated carbon (denoted as AC-M) was studied using a dynamic method in a fixed bed reactor. The results showed that impregnation of metal oxides on the activated carbon significantly enhanced the removal capacity for HCN. Among the different types of metal-modified catalysts, AC-Cu exhibited the highest catalytic activity. The AC-Cu catalyst showed >96% conversion of HCN at 200–350 °C. The selectivity of N2 in the conversion of HCN reached 48.8% at 300 °C. Oxygen concentration, relative humidity and calcination temperature can greatly influence the catalytic activity. In particular, the reaction temperature was determined to be a crucial factor. The detailed characterization of the catalyst was performed using X-ray diffraction (XRD), Brunauer–Emmett–Teller (BET), X-ray photoelectron spectroscopy (XPS), temperature-programmed reduction (TPR), and temperature programmed desorption (TPD). The Cu 2p XPS spectra and XRD patterns indicated that CuO was formed as an active species for the catalytic removal of HCN. We concluded that AC-Cu could be used as a catalyst for the removal of HCN by coupling catalytic hydrolysis and oxidation.
1. Introduction
Hydrogen cyanide (HCN), which is produced from automobile exhaust emissions, coal gasification processes, chemical processing, industrial manufacture etc., is an unconventional component of air pollution.1–4 HCN is a precursor of N2O, which is one of the main greenhouse gases and one of the reasons of acid rain formation.4,5 In addition, HCN can enter into the human body by respiration, and is extremely dangerous because it inhibits oxygen delivery in the body. In short, HCN is harmful to health and an environmental hazard. Therefore, many research groups are developing efficient catalysts to remove HCN from the atmosphere.
To date, several strategies have been developed to remove HCN from gas. Zhao et al. carried out a detailed investigation of the HCN oxidation reaction over a 0.5% Pt/Al2O3 catalyst.6 They found N2, N2O, NO, NO2, CO2 and H2O as reaction products, but no NH3 and CO due to the strongly oxidizing conditions. The maximum selectivity for N2 was ca. 25% for the HCN + O2 reaction at 250 °C. However, co-feeding H2O has no effect on the HCN conversion or the selectivity for N2. O. Kröcher and co-workers7 tested a TiO2 hydrolysis catalyst, which enabled quantitative conversion of HCN to CO and NH3. Al2O3 has also been used as a hydrolysis catalyst, but the removal rate of HCN was about 50% lower. HCN was oxidized highly selectively to N2 over a Cu-ZSM-5 catalyst, particularly in the presence of NO. In the presence of O2 and H2O, the maximum selectivity of N2 was about 40% using Cu-ZSM-5 at 400 °C. When additional NO was added, HCN selectively reacted to yield N2 over a large temperature range. Tan et al. investigated the removal of HCN using calcium oxide at temperatures ranging from 27 to 900 °C.8 The adsorption method is widely used for HCN removal because of its ease of operation and flexible design. Specially, activated carbon (AC) was used as the adsorbent for HCN removal because of its high specific surface area and high sorption capacity.9–13 However, HCN was not degraded or converted during adsorption process, and the problem of secondary pollution may exist. Various carbon materials have been widely used as supports in heterogeneous catalysis.14–17 Gao et al. reported a preparation method of carbon materials to support catalyst, which is superior to the conventional carbon-supported catalysts in oxidation reactions.14 Bobbink and co-workers15 studied a series of carbon supported noble metal catalysts for the conversion of chitin or NAG to N-containing C2–6 polyols in the presence of hydrogen.
In this study, we present a method of coupling catalytic hydrolysis and oxidation for HCN removal utilizing AC-M catalyst under micro-oxygen conditions. Activated carbon has been used as a carrier for catalysts in a variety of gas purification processes.18–20 As activated carbon is impregnated with transition metal salts such as Fe(NO3)3, Cu(NO3)2, Co(NO3)2, its activity for HCN removal is increased greatly because of the coupled catalytic hydrolysis and oxidation. Furthermore, we studied the effects of reaction conditions on HCN conversion and selective conversion to N2 over a modified catalyst. Finally, mechanisms of HCN removal by the AC-M were explored.
The performances of the modified activated carbon were evaluated with HCN removal tests. The experimental conditions, such as the active component, reacting temperature, relative humidity, and oxygen content, were studied to optimize the catalytic removal of HCN. For the assessment of the catalytic materials, a careful characterization of the catalyst was accomplished by means of various physical and spectroscopic techniques, including X-ray diffraction (XRD), inductively coupled plasma-atomic emission spectroscopy (ICP-AES), Brunauer–Emmett–Teller (BET), X-ray photoelectron spectroscopy (XPS), temperature-programmed reduction (TPR), and temperature programmed desorption (TPD).
2. Materials and methods
2.1. Experimental materials
Commercial virgin activated carbon (AC) was used as catalyst support. To compare the effects of different transition metals, the AC was impregnated with 0.1 mol L−1 Mn(NO3)2, Fe(NO3)3, Co(NO3)2, Ni(NO3)2, and Cu(NO3)2, respectively. The volume ratio of the solution and the AC was 5
:
1. The impregnation procedure was carried out at room temperature for 24 h. The mixture was filtrated and the solid was dried at 105 °C for 12 h, followed by calcinations in a tube furnace for 5 h under N2 atmosphere. The reacted sample was denoted as AC-M (M representing Fe, Co, Cu, Mn, and Ni, respectively).
2.2. Purification process
The experiments were carried out in a fixed bed quartz reactor with a temperature range of 100–350 °C. The apparatus consists of three sections: the gas dosing and mixing section, the reactor section, and the analysis section. The quartz tube has an inner diameter of 8 mm and a length of 150 mm and is heated by means of an electric furnace. The gas space velocity (GHSV) was 32
000 h−1 at STP and the heating rate was 5 °C min−1. In order to carry out catalytic coupling experiments, the model gas flow was composed of nitrogen with 0–1% O2, 0–20% H2O and 100 ppm HCN.
2.3. Sample analysis
In order to obtain more precise experimental data, the effluent gas was analyzed after a continuous reaction for 10 min at each temperature. A gas chromatography (FULI, 9790II) was used to detect NOx (NO and NO2), and N2O. HCN was measured through the iso-nicotinic-acid-3-methy-1-phenyl-5-pyrazolone spectrophotometric method. NH3 was determined by sodium hypochlorite-salicylic acid spectrophotometry. Although N2 is not detectable by existing experimental conditions, N2 formation can be calculated from the N-balances due to the high measuring accuracy of the remaining N-containing reaction products of ±3%.7 |
 | (1) |
The performance of the catalysts is presented in terms of conversion of HCN and, the selective generation of nitrogen-containing products is defined by the following equations:
|
 | (2) |
|
 | (3) |
|
 | (4) |
|
 | (5) |
|
 | (6) |
2.4. Characterization
XRD patterns of the prepared catalysts were recorded with a Bruker D8 Advance at a rate of 6° min−1 from 2θ = 5° to 90°. The crystalline phases were identified by matching the observed diffraction pattern with the JCPDS files.
Pore size distributions, surface areas, and pore volumes were measured by nitrogen sorption/desorption using a Micromeritics 3Flex analyzer. Specific surface area was determined by using the BET equation. The pore volumes and pore size distributions were evaluated by the BJH method.
XPS analyses were conducted on a Thermo ESCALAB 250XI, with an Al Kα anode (hν = 1486.6 eV). The C 1s, Cu 2p, N 1s and O 1s photoelectron lines were measured in XPS mode. The photon energy scale was calibrated using C 1s of saturated carbon at 284.8 eV.
H2-TPR experiments were performed using a chemisorption analyzer and according to the following experimental conditions: a 5% H2/Ar (15 mL min−1) flow was used as the reducing atmosphere from room temperature up to 800 °C, with a heating rate of 1 °C min−1 and using 50 mg of sample.
TPD was conducted by using 0.1 g catalyst in a quartz reactor. The sample was pretreated at 400 °C under He as a sweep gas (flow rate 50 mL min−1) for 40 min. After cooling down to room temperature, the sample was exposed to a flow of CO2, or NH3 for 1 h. Then the catalyst was heated in He from 50 °C to 800 °C at a rate of 10 °C min−1 to desorb CO2 (CO2-TPD), or NH3 (NH3-TPD).
3. Results and discussion
3.1. Effects of modifiers on coupling catalytic hydrolysis and oxidation of HCN
Five catalysts impregnated with different metals were studied, AC-Cu, AC-Mn, AC-Co, AC-Ni, and AC-Fe, and their catalytic capacities were measured and compared by dynamic removal capacity tests. For comparison, the catalytic capacity of virgin AC was tested via the same process. The removal rate curves of the above catalysts are plotted in Fig. 1(a). Their removal rates and performance as HCN catalysts differ, which clearly illustrates the effectiveness of the modifications for HCN removal. It can be observed that HCN is removed in much higher quantities with the modified AC than with the virgin AC, and the catalysis of virgin AC can be neglected. Compared with AC-Mn, AC-Co, AC-Ni, and AC-Fe, AC-Cu shows a significant improvement in HCN removal over a large temperature range. The most important result of the catalyst screening experiments was that AC-Cu converted HCN with activity approximately 1–5 times higher than that of the other catalysts in this experiment. Therefore, Cu was chosen as the metal species for further study.
 |
| Fig. 1 (a) Catalytic performance for coupling catalytic oxidation and hydrolysis of HCN on different catalysts. (b) N-containing products selectivity and HCN removing rate over AC-Cu. Reaction conditions: T(calcination) = 350 °C, 5% H2O, and 0.5% O2. | |
From the results shown in Fig. 1(b), the observed nitrogen-containing products were NH3, N2O and NOx, and some residual HCN. The generation of N2 can be calculated by N-balance. No conversion to NH3, N2O and NOx was observed at 150 °C implying that adsorption proceeded predominantly at this temperature. However, HCN catalysis played important roles as the temperature rises. As the temperature was increased, the total conversion of HCN increased markedly to more than 98% at or above 250 °C. The typical products of NH3 and NOx indicated the occurrence of catalytic hydrolysis and oxidation, respectively. From Fig. 1(b), N2 selectivity was increased to 38.6% when the reaction temperature was increased to 350 °C. The decrease in the production of NH3 at higher temperatures might be explained by oxidative reactions with O2, which becomes a significant factor at this temperature. The N2 formation followed the trend of the NH3 production since it is the product of a subsequent reaction. The mechanisms proposed are summarized with following reaction sequence:
|
4NH3 + 3O2 → 2N2 + 6H2O
| (8) |
Nevertheless, it cannot be fully excluded that N2 was formed by oxidation of HCN. For the calculated production of ca. 19 ppm N2 from HCN (at 350 °C), only 48 ppm of O2 in the model gas would be required — a concentration level that is easily reached.
|
4HCN + 5O2 → 4CO2 + 2N2 + 2H2O
| (9) |
Furthermore, according to the literature,7,21 NH3, NO and NO2 produced during the reaction may further react as follows:
|
4NH3 + 4NO + O2 → 4N2 + 6H2O
| (10) |
|
2NH3 + NO + NO2 → 2N2 + 3H2O
| (11) |
The above reactions are possible under our reaction conditions, and we observed three of the reaction products that support the conclusion. Therefore, in the presence of H2O and O2, the catalytic hydrolysis and oxidation are coupled in the HCN removal process. It should be pointed out that N2O and NOx were formed in considerable quantities, which is not favorable for N2 selectivity. Nevertheless, the chemical transformation of HCN and further reaction products can be greatly varied by changing the reaction conditions, which are explained by the subsequent study.
3.2. Effects of operating conditions
The results in this section begin with an analysis of HCN removal by AC-Cu with varying calcination temperatures. Next, the effect of different oxygen contents and relative humidity on HCN removal is described. These sections are followed by the analysis of nitrogen-containing products using the optimal experimental conditions that obtained above.
3.2.1. Effects of calcination temperature. According to the thermogravimetric analysis, the decomposition of Cu(NO3)2 starts at about 200 °C, and is complete at about 350 °C.22,23 Based on the above data, AC-Cu catalysts prepared at different calcination temperatures (300, 350, 400, 450 °C) were selected for further study. The effects of calcination temperatures on the AC-Cu catalysts for HCN removal are shown in Fig. 2. These data show that the calcination temperature is an important factor that influences the HCN removal efficiency. As the calcination temperature increased from 300 °C to 400 °C, the removal rate of HCN increased markedly. The AC-Cu catalyst calcined at 400 °C exhibited the highest catalytic activity. However, when the calcination temperature was higher than 400 °C, the HCN removal efficiency decreased with increasing calcination temperature. Too high calcination temperature can cause sintering or closure of the catalyst pore, resulting in the reduced active center on the surface of the catalyst and a decline in the dispersion of the active sites. This will lead to slowed adsorption and desorption of reactant in the process of reaction, and eventually reduced catalyst activity.24
 |
| Fig. 2 Catalytic performance for coupling catalytic oxidation and hydrolysis of HCN over AC-Cu at different calcination temperatures. Reaction conditions: 5% H2O, and 0.5% O2. | |
3.2.2. Effects of the oxygen content. Fig. 3(a) shows how the oxygen content affects the coupled catalysis of HCN on AC-Cu at a variety of temperatures between 150 and 350 °C. It was found that the removal rate of HCN with 1.0% O2 is the lowest compared to than that with other oxygen contents, whereas 0.5% oxygen content presents the highest activity. The removal rate order is 0.5% O2 > 0.75% O2 > 0% O2 > 0.25% O2 > 1.0% O2 at the whole temperature range. The oxygen content is also one of the important factors that influence HCN purification efficiency, and we sought to identify the optimal O2 content for AC-Cu catalytic activity. The reason that the highest removal rate of HCN was achieved with 0.5% O2 is that AC-Cu catalysis is limited at lower oxygen content and thermally unstable at higher oxygen content. It is found that the carbon decomposition at 1% O2 condition and the decomposition of AC-Cu itself lead to a reduction of the activity of the catalyst.
 |
| Fig. 3 Catalytic performance for coupling catalytic oxidation and hydrolysis of HCN over AC-Cu. Reaction conditions: T(calcination) = 400 °C. (a) Effects of the oxygen content (5% H2O). (b) Effects of relative humidity (0.5% O2). | |
3.2.3. Effects of relative humidity. Fig. 3(b) shows HCN removal rate curves for AC-Cu under gas streams with different relative humidity. It was found that the presence of moisture in the gas stream significantly affects the HCN catalysis capability of AC-Cu. Introduction of moisture improved HCN removal rate, suggesting that some degree of HCN hydrolysis occurred. At the condition of 10% relative humidity, a high removal rate of HCN was obtained at the whole temperature range for AC-Cu. As shown in Fig. 3(b), the removal rate tended to drop off at higher relative humidity, presumably due to the formation of water clusters which block the micropores and do not allow the diffusion of more water into small micropores.25 Furthermore, it may also due to competitive adsorption of water with HCN for catalysis sites on AC-Cu.26
3.2.4. Effects of operating conditions for nitrogen-containing products. In this section, using the optimized experimental conditions outlined above, the nitrogen-containing products were analyzed. As shown in Fig. 4, compared to previous studies,6,7 the selectivity of N2 reached 48.8% at 300 °C. Meanwhile, the clearly higher conversions of NH3 were obtained through the whole temperature range of AC-Cu catalysts, which also confirmed the increased hydrolysis of HCN. This result is consistent with the above results that N2 formation follows the trend of NH3 formation. Furthermore, the optimal experimental conditions have positive effect on the HCN conversion to N2, which lowers the reaction temperature for maximum HCN conversion and N2 selectivity.
 |
| Fig. 4 N-containing products selectivity and HCN removing rate over AC-Cu. Reaction conditions: T(calcination) = 400 °C, 10% H2O, and 0.5% O2. | |
For HCN oxidation in the presence of H2O, there are two possible reaction pathways of HCN consumption. First, NH3 in formed through hydrolysis of HCN and then NH3 is oxidized; Second, HCN oxidation and HCN hydrolysis are parallel processes.27 According to the present results, hydrolysis of HCN to NH3 over AC-Cu is considered to play a major role in the behavior of HCN removal (eqn (7) and (8)). Under the conditions of 10% relative humidity and 0.5% O2, the rate of HCN hydrolysis is far higher than the rate of HCN oxidation.
As before, some NOx and N2O were formed as by-products from the oxidation of HCN at high temperatures due to the strong oxidizing properties of this catalyst.6,7 In comparing Fig. 4 with 1(b), it is evident that the amount of NOx and N2O decreased during the reaction at the whole temperature range. Clearly, most of the HCN decomposed to NH3 and N2, which is an important reason for the decreased selectivity of N2O and NOx at high temperatures. Nevertheless, to improve the selectivity of N2, the yield of NH3 should be minimized by choosing the appropriate reaction conditions and catalyst.
3.3. XRD analyses of catalysts
XRD was employed in order to identify the crystalline phases in the catalytic samples. Fig. 5 illustrates the diffractograms of XRD obtained for all of the metal-modified catalysts. The XRD pattern of the virgin AC revealed a largely amorphous material. The two wide diffractions at 23° and 42° were assigned to the sample holder, whereas the small sharp peak at 31° and 35° to crystalline carbon.28 Similar diffractograms were recorded for all other activated carbon supports examined in this study. In comparison with the virgin AC, two sharp diffraction peaks at 2θ = 35.5° and 38.8° with one weak peak at 48.7° were assigned to the CuO in AC-Cu. One small peak corresponding to Cu2O was observed at approximately 35.8°. This assumption was further verified by XPS analysis (Fig. 7). This result indicated that CuO is the mainly active species for the catalytic removal of HCN. The only diffraction peak detected for AC-Co, apart from the carbon phase of the support, was clearly assigned to CO3O4. For AC-Ni, two weak diffraction peaks at 2θ = 37.2° and 43.2° were assigned to the NiO in AC-Ni. According to Liakakou,28 the nickel nitrate precursor deposited on carbon decomposes to NiO at 200–300 °C, which is consistent with our above speculation. Almost no significant diffraction peaks of iron oxides or manganese oxides were observed in AC-Fe and AC-Mn.
 |
| Fig. 5 XRD patterns of different metal-modified catalysts. | |
ICP-AES analysis was performed in order to obtain the metal contents of the catalysts. The analysis showed the weight percentages of Cu, Mn, Co, Ni, and Fe in these metal modified active carbons were 2.05%, 1.58%, 1.64%, 1.73%, and 3.15%, respectively. Although the same amount of transition metal was used, the activated carbon showed different absorption capacities for different metals. The metal content in AC-Fe catalyst was the highest compared with the other metal modified active carbon. Combined with XRD analysis, the weaker peak intensity of Fe indicate the better dispersion, but it did not show a better catalytic activity (Fig. 1(a)). Therefore, the activity of catalyst exhibited no obvious relationship with the metal content. The type of metal elements is the key factor of catalytic ability.
3.4. Particle surface area and pore size distribution
Surface area is an important factor in influencing the catalytic activity. Large surface areas contain more active sites in which the catalytic reactions could take place. The nitrogen sorption/desorption isotherms of the AC, AC-Cu, and AC-CuE (the sample after the HCN catalysis) are shown in Fig. 6(a). According to the IUPAC classification, all isotherms exhibits features intermediate between those of type of I and II, a broad knee and long plateau up to P/P0 ≈ 1.0 and extended to small tail, suggest all samples formed by micropores and mesopores.29 Maldhure and Gokce et al.30,31 reported a similar trend for porosity distributions on activated carbon.
 |
| Fig. 6 (a) Nitrogen sorption/desorption isotherms of virgin AC, fresh AC-Cu, and used AC-Cu, (b) pore size distributions of virgin AC, fresh AC-Cu, and used AC-Cu. | |
The pore size distributions and structural parameters for AC, AC-Cu, and AC-CuE are shown in Fig. 6(b) and Table 1, respectively. The pore size distribution curves in Fig. 6(b) shows that all samples had pores with radii mainly in the range of 0.85–2.5 nm, which further corroborated that all samples were formed by micropores and mesopores. Table 1 shows that the specific surface area (BET) of modified catalyst AC-Cu only slightly decreased, compared with that of virgin AC. However, the AC and AC-Cu surface areas were considerably higher, which could be due to calcination because both the AC and AC-Cu calcined at 400 °C, which is a major factor in making the surface area expand.30 The micropore area and the micropore volume of the AC-Cu decreased by 3.4% and 4.2%, respectively, compared with that of AC, while the total volume and average pore radius exhibited almost no change. These results indicate that the micropores of the AC-Cu are influenced by the modification process and the loaded CuO formed an active component on the surface of the AC-Cu. CuO is effective to load on the micropores of catalyst because the modification and calcination of Cu(NO3)2 results in pore blockage in the micropores, caused by the groups grafted on during the impregnation process. Thus, the AC-Cu activity in the HCN catalysis process suggests that CuO loaded in the micropores plays a catalytic role in the coupling oxidation and hydrolysis of HCN.
Table 1 Porosity parameters of different activated carbon samples
Samples |
SBET (m2 g−1) |
Smicro (m2 g−1) |
Vtotal (cm3 g−1) |
Vmicro (cm3 g−1) |
Raverage (nm) |
AC |
1239.4 |
327.3 |
0.1918 |
0.1287 |
1.4392 |
AC-Cu |
1238.2 |
316.2 |
0.1906 |
0.1233 |
1.4201 |
AC-CuE |
1196.5 |
278.6 |
0.1841 |
0.1066 |
1.3879 |
Fig. 6(b) and Table 1 also show a comparison between the AC-Cu and AC-CuE. Significant changes are observed in the catalyst porosity because of the HCN catalysis. After the reaction, the BET surface area, micropores area and micropores volume of the modified activated carbon decrease by 3.7%, 11.9% and 13.5%, respectively. The changes in the total pore volume and average pore radius are much less pronounced before the catalytic process. These results definitely indicate a reduction in micropores of the AC-Cu, which could be occupied by various adsorbed species due to catalytic use for HCN.
3.5. X-ray photoelectron spectroscopic analysis
Fig. 7 shows the Cu 2p, N 1s and O 1s XPS spectra of the AC-Cu samples, and the binding energy of the C 1s, Cu 2p, N 1s, and O 1s electrons are summarized in Table 2. Fig. 7 shows the XPS spectra of core level binding energies in Cu 2p before (a) and after (b) the reaction. In agreement with XRD results, XPS analysis showed that copper oxides are present in two oxidation states in catalysts: CuO and Cu2O. As noted in Fig. 7(a and b) and Table 3, the major Cu 2p3/2 peak centers at 933.2 eV corresponded to CuO. The derivative peak at around 941.9 eV was assigned to the Cu 2p3/2 satellite peak of CuO. In addition, the bands at 932.1 eV and 951.9 eV were assigned to the Cu 2p3/2 and Cu 2p1/2 in Cu2O.32–34 XPS analysis for C 1s was also conducted on AC-Cu. The data in Table 2 indicate that the catalysis of AC-Cu for HCN has little influence on the electronic state of carbon atoms and C 1s.
 |
| Fig. 7 XPS spectra for Cu 2p, N 1s and O 1s of AC-Cu before (a, d) and after (b, c, e) reaction. | |
Table 2 XPS analysis results for C 1s, Cu 2p, O 1s, and N 1s of AC-Cu before and after reaction
Elements |
Before reaction |
After reaction |
Binding energy (eV) |
Relative content (%) |
Binding energy (eV) |
Relative content (%) |
C 1s |
284.8 |
59.51 |
284.8 |
35.05 |
285.3 |
40.49 |
283.6 |
31.43 |
— |
— |
285.43 |
33.52 |
Cu 2p |
933.2 |
66.33 |
933.2 |
36.1 |
953.0 |
33.67 |
953.7 |
12.89 |
— |
— |
941.9 |
8.98 |
— |
— |
932.1 |
26.38 |
— |
— |
951.9 |
15.65 |
O 1s |
531.3 |
93.55 |
530.9 |
100 |
533.8 |
6.45 |
— |
— |
N 1s |
— |
— |
400.9 |
61.96 |
— |
— |
399.1 |
38.04 |
Table 3 XPS results of the Cu 2p and N 1s spectra and their possible statuses before and after the reaction
Elements status |
Before reaction |
After reaction |
CuO |
Cu2O |
CuO |
Cu2O |
NH3 |
N–O |
Binding energy (eV) |
Cu 2p3/2 |
Cu 2p1/2 |
Cu 2p3/2 |
Cu 2p3/2 |
Cu 2p3/2 |
Cu 2p1/2 |
N 1s |
N 1s |
933.2 |
953.0 |
933.2 |
941.9 |
932.1 |
951.9 |
399.1 |
400.9 |
Fwhm (eV) |
2.24 |
2.76 |
2.99 |
3.15 |
1.68 |
1.88 |
1.70 |
2.20 |
Relative content (%) |
66.33 |
33.67 |
36.1 |
8.98 |
26.38 |
15.69 |
38.04 |
61.96 |
Freshly prepared AC-Cu contained no N species. After reaction, N was observed. The Fig. 7(c) exhibits the N 1s spectrum of AC-Cu fitted with two distinct peaks at 399.1 eV (38.04%) and 400.9 eV (61.96%). The peak centered at 399.1 eV is generally found in amino group.12 This suggests that a portion of HCN was converted into ammonium compounds, such as NH3. O. Kröcher et al.7 ever reported that with water vapor, HCN could be hydrolyzed into NH3. Therefore, it is guessed that amino group in Fig. 7(c) is NH3 which come from hydrolysis of HCN. The binding energy around 400.9 eV is attributable to the N–O bonds,34 which can be assigned to the oxidation of HCN or NH3. Hence, it is safely deduced that coupling catalytic hydrolysis and oxidation of HCN occurs, which is consistent with the product analysis.
The O 1s spectra before the reaction (Fig. 7(d)) revealed the presence of two peaks. The peak I (binding energy = 533.8 eV) corresponded to C–O type oxygen atoms in C–OH and COOR groups, and peak II of 531.3 was associated with a wide variety of species such as surface chemisorbed oxygen, hydroxyl and oxygen ions in low coordination situation and oxygen-containing surface contamination.21,35 The surface chemisorbed oxygen was reported to be highly active in oxidation reactions because its mobility is higher than that of the lattice oxygen.36,37 The peak III at 530.9 eV (after reaction) was attributable to the lattice oxygen of Cu2O.33,38,39 From these results, it can be inferred that the component at 531.3 eV (93.55%) could be associated with the surface chemisorbed oxygen, which participated in the catalytic oxidation reaction.
It can be speculated that the surface atomic distribution is an important reason for the promoted catalytic performance of Cu doped catalysts. The above findings indicate that AC-Cu plays a very important role in the reaction process where the activated carbon catalyzed the removal of HCN. The data suggest that AC-Cu participates in the catalytic hydrolysis and oxidation process in which the impregnated activated carbon catalyzes the removal of HCN.
3.6. H2-TPR
TPR analysis was conducted to investigate the surface redox property of AC-Cu catalyst. As shown in Fig. 8, two main H2 reduction peaks were observed for these samples. The reduction of TPR peaks at temperatures from 250 °C to 360 °C would indicate larger and less dispersed copper oxide.40–42 Thus, the first reduction peak at around 318 °C could be attributed to the reduction of larger and less dispersed CuO.41,42 The large peak width from 450 to 800 °C may be due to the reduction of Cu2+ and the reduction of some Cu+ ions (around 684 °C).43 These results are in accordance with that of XRD and XPS analysis. The active substance in AC-Cu catalyst is copper oxide, mainly CuO. Moreover, the surface redox property of catalyst is also important for the oxidation of HCN. Higher redox capability of AC-Cu catalyst could promote the oxidation of HCN and achieve highly selectivity of N2.
 |
| Fig. 8 H2-TPR profiles for AC-Cu. | |
3.7. TPD profiles
Fig. 9(a) and (b) show the TPD profiles of NH3 and CO2 for catalysts of AC and AC-Cu, respectively. Surface acidity of the catalysts was investigated by temperature programmed desorption of NH3. The NH3 desorption peaks were different in AC and AC-Cu catalysts. Two peaks of NH3 desorption were observed in the entire temperature range, one very small peak at low temperature and the other large one at high temperature. They are attributed to the desorption of NH3 on Lewis and Brönsted acid sites, respectively.44 The large desorption peak of NH3 was centered at 716 °C over the AC catalyst, and the temperature of the peak over the AC-Cu catalyst shifted to 693 °C. The strength of this peak increased significantly in the modified catalyst compared to the fresh catalyst, indicating that the acidity strength of catalyst was enhanced by the metal modification. The small peaks were around 127 °C and 102 °C for AC-Cu and AC, respectively. This peak on the fresh catalyst was similar to that of the modified catalyst. From the results of TPD profiles of CO2 in Fig. 9(b), for both AC and AC-Cu catalysts, no obvious CO2 desorption peaks were observed. On the other hand, the samples have very few basic sites. Thus, it can be concluded that all the catalysts presented mainly acidic properties and no significant basic properties. According to the combined XRD and XPS results, it was concluded that the increase in acidic sites mainly results from the formation of CuO. Moreover, the formation of CuO is an increasing function of the catalytic activity.
 |
| Fig. 9 TPD profiles over AC and AC-Cu. (a) NH3-TPD; (b) CO2-TPD. | |
4. Conclusions
In order to develop highly efficient and stable catalysts for the removal of HCN by coupling catalytic hydrolysis and oxidation, AC based catalysts impregnated with transition metal salts were prepared and their catalytic activity was tested. It was shown that modification of metal oxides on the AC significantly enhanced the removal capacity of HCN. Moreover, among the different kinds of metal-containing catalysts, AC-Cu exhibited the highest catalytic activity. Oxygen contents, relative humidity, reaction temperatures, and calcination temperatures can influence the catalytic activity of the AC-Cu catalyst greatly. In particular, total HCN conversion reaches 96% at temperature range from 200 °C to 350 °C with 10% relative humidity and 0.5% O2. Nitrogen-containing products were N2, N2O, NO, NO2, and NH3 by coupling catalytic hydrolysis and oxidation of HCN on AC-Cu. The selectivity of N2 reached to 48.1% at 300 °C. According to the current study results, the activated carbon impregnated with Cu(NO3)2 provides a good candidate for coupling catalytic hydrolysis and oxidation of HCN, which meeting requirements for desirable environmental catalysts.
Acknowledgements
This work was supported and funded by the National Natural Science Foundation of China (No. 51268021, 51368026, 51568027, U1137603), 863 National High-tech Development Plan Foundation (No. 2012AA062504).
References
- M. M. Baum, J. A. Moss, S. H. Pastel and G. A. Poskrebyshev, Environ. Sci. Technol., 2007, 41, 857–862 CrossRef CAS PubMed.
- T. M. Oliver, K. Jugoslav, P. Aleksandar and D. Nikola, Chem. Eng. Process., 2005, 44, 1181–1187 CrossRef CAS.
- S. Schäfer and B. Bonn, Fuel, 2000, 79, 1239–1246 CrossRef.
- P. Dagaut, P. Glarborg and M. U. Alzueta, Prog. Energy Combust. Sci., 2008, 34, 1–46 CrossRef CAS.
- P. Ning, J. Qiu, X. Wang, W. Liu and W. Chen, J. Environ. Sci., 2013, 25, 808–814 CrossRef CAS.
- H. Zhao, R. G. Tonkyn, S. E. Barlow, B. E. Koel and C. H. F. Peden, Appl. Catal., B, 2006, 65, 282–290 CrossRef CAS.
- O. Kröcher and M. Elsener, Appl. Catal., B, 2009, 92, 75–89 CrossRef.
- H. Tan, X. Wang, C. Wang and T. Xu, Energy Fuels, 2009, 23, 1545–1550 CrossRef CAS.
- P. N. Brown, G. G. Jayson, G. Thompson and M. C. Wilkinson, J. Colloid Interface Sci., 1987, 116, 211–220 CrossRef CAS.
- M. Seredych, M. van der Merwe and T. J. Bandosz, Carbon, 2009, 47, 2456–2465 CrossRef CAS.
- M. J. Hudson, J. P. Knowles, P. J. F. Harris, D. B. Jackson, M. J. Chinn and J. L. Ward, Microporous Mesoporous Mater., 2004, 75, 121–128 CrossRef CAS.
- Q. Zhao, S. Tian, L. Yan, Q. Zhang and P. Ning, J. Hazard. Mater., 2015, 285, 250–258 CrossRef CAS PubMed.
- P. Ye, Z. Luan, K. Li, L. Yu and J. Zhang, Carbon, 2009, 47, 1799–1805 CrossRef CAS.
- Y. Gao, X. Chen, J. Zhang, H. Asakura, T. Tanaka, K. Teramura, D. Ma and N. Yan, Adv. Mater., 2015, 27, 4688–4694 CrossRef CAS PubMed.
- F. D. Bobbink, J. Zhang, Y. Pierson, X. Chen and N. Yan, Green Chem., 2015, 17, 1024–1031 RSC.
- Y. Gao, X. Chen, J. Zhang and N. Yan, ChemPlusChem, 2015, 80, 1556–1564 CrossRef CAS.
- X. He, T. Zeng, Z. Li, G. Wang and N. Ma, Angew. Chem., Int. Ed., 2016, 55, 3124–3128 CrossRef PubMed.
- X. Q. Wang, P. Ning, Y. Shi and M. Jiang, J. Hazard. Mater., 2009, 171, 588–593 CrossRef CAS PubMed.
- Y. Itaya, K. Kawahara, C. W. Lee, J. Kobayashi, N. Kobayashi, S. Hatano and S. Mori, Fuel, 2009, 88, 1665–1672 CrossRef CAS.
- K. Sakanishi, Z. H. Wu, A. Matsumura, I. Saito, T. Hanaoka, T. Minowa, M. Tada and T. Iwasaki, Catal. Today, 2005, 104, 94–100 CrossRef CAS.
- H. Chang, X. Chen, J. Li, L. Ma, C. Wang, C. Liu, J. W. Schwank and J. Hao, Environ. Sci. Technol., 2013, 47, 5294–5301 CrossRef CAS PubMed.
- Ž. D. Živković, D. T. Živković and D. B. Grujičić, J. Therm. Anal. Calorim., 1998, 53, 617–623 CrossRef.
- K. Wu, D. Wang, L. Shao, M. Shui, R. Ma, M. Lao, N. Long, Y. Ren and J. Shu, J. Power Sources, 2014, 248, 205–211 CrossRef CAS.
- M. T. Makhlouf, B. M. Abu-Zied and T. H. Mansoure, Adv. Powder Technol., 2014, 25, 560–566 CrossRef CAS.
- V. I. Águeda, B. D. Crittenden, J. A. Delgado and S. R. Tennison, Sep. Purif. Technol., 2011, 78, 154–163 CrossRef.
- X. Wang, J. Qiu, P. Ning, X. Ren, Z. Li, Z. Yin, W. Chen and W. Liu, J. Hazard. Mater., 2012, 229, 128–136 CrossRef PubMed.
- T. Shimizu, K. Ishizu, S. Kobayashi, S. Kimura, T. Shimizu and M. Inagaki, Energy Fuels, 1993, 7, 645–647 CrossRef CAS.
- E. T. Liakakou, E. Heracleous, K. S. Triantafyllidis and A. A. Lemonidou, Appl. Catal., B, 2015, 165, 296–305 CrossRef CAS.
- K. S. W. Sing, D. H. Everett, R. A. W. Haul, L. Moscow, R. A. Pierotti, J. Rouquerol and T. Siemieniewska, Pure Appl. Chem., 1985, 57, 603–619 CrossRef CAS.
- A. V. Maldhure and J. D. Ekhe, Chem. Eng. J., 2011, 168, 1103–1111 CrossRef CAS.
- Y. Gokce and Z. Aktas, Appl. Surf. Sci., 2014, 313, 352–359 CrossRef CAS.
- Z. Liu, M. D. Amiridis and Y. Chen, J. Phys. Chem. B, 2005, 109, 1251–1255 CrossRef CAS PubMed.
- U. Arellano, J. M. Shen, J. A. Wang, M. T. Timko, L. F. Chen, J. T. Vázquez Rodríguez, M. Asomoza, A. Estrella, O. A. González Vargas and M. E. Llanos, Fuel, 2015, 149, 15–25 CrossRef CAS.
- A. P. Dementjev, A. De Graaf, M. C. M. Van de Sanden, K. I. Maslakov, A. V. Naumkin and A. A. Serov, Diamond Relat. Mater., 2000, 9, 1904–1907 CrossRef CAS.
- J. Chen, X. Zhang, H. Arandiyan, Y. Peng, H. Chang and J. Li, Catal. Today, 2013, 201, 12–18 CrossRef CAS.
- Z. B. Wu, R. B. Jin, Y. Liu and H. Q. Wang, Catal. Commun., 2008, 9, 2217–2220 CrossRef CAS.
- Z. Lian, F. Liu, H. He, X. Shi, J. Mo and Z. Wu, Chem. Eng. J., 2014, 250, 390–398 CrossRef CAS.
- J. M. Lázaro Martínez, E. Rodríguez-Castellón, R. M. Torres Sánchez, L. R. Denadayd, G. Y. Buldaina and V. Campo Dall' Orto, J. Mol. Catal. A: Chem., 2011, 339, 43–51 CrossRef.
- J. C. Zheng, H. M. Feng, M. H. W. Lam, P. K. S. Lam, Y. W. Ding and H. Q. Yu, J. Hazard. Mater., 2009, 171, 780–785 CrossRef CAS PubMed.
- J. M. Valero, S. Obregón and G. Colón, ACS Catal., 2014, 4, 3320–3329 CrossRef CAS.
- S. Jung, S. Bae and W. Lee, Environ. Sci. Technol., 2014, 48, 9651–9658 CrossRef CAS PubMed.
- F. Epron, F. Gauthard, C. Pinéda and J. Barbier, J. Catal., 2001, 198, 309–318 CrossRef CAS.
- J. Wang, Z. Peng, H. Qiao, H. Yu, Y. Hu, L. Chang and W. Bao, Ind. Eng. Chem. Res., 2016, 55, 1174–1182 CrossRef CAS.
- J. Li, R. Zhu, Y. Cheng, C. K. Lambert and R. T. Yang, Environ. Sci. Technol., 2010, 44, 1799–1805 CrossRef CAS PubMed.
|
This journal is © The Royal Society of Chemistry 2016 |
Click here to see how this site uses Cookies. View our privacy policy here.