Chromogenic and fluorescence sensing of pH with a Schiff-base molecule†
Shibashis Haldera,
Aradhita Bhattacharjeea,
Ankita Roya,
Sompriya Chatterjeeab and
Partha Roy*a
aDepartment of Chemistry, Jadavpur University, Jadavpur, Kolkata-700 032, India. E-mail: proy@chemistry.jdvu.ac.in; Fax: +91-33-2414-6414; Tel: +91-33-2457-2970
bDepartment of Pharmaceutical Technology, NSHM Knowledge Campus, 124, B.L. Saha Road, Kolkata-700 053, India
First published on 11th April 2016
Abstract
pH is one of the key parameters of many chemical and biological processes and also to assess the quality of water. We have synthesized and characterized a new Schiff-base molecule, 2-hydroxy-5-methyl-3-((quinolin-3-yliminio)methyl)benzaldehyde (HMQB) which is able to detect different pH regions. It shows a strong emission band at 464 nm in Britton Robinson buffer solution of pH 2.0 upon excitation at 400 nm. With the increase in pH value of the medium, the emission intensity at 464 nm decreases gradually and at the same time, a new fluorescence peak emerges at 530 nm. The UV-vis spectra of HMQB exhibits peaks at 350 nm and 435 nm in acidic and basic regions respectively. Images of HMQB in different pH solutions indicate no coloration and yellowish green coloration in acidic and basic media respectively corroborating the results of the UV-vis spectra. We have applied the probe molecule successfully to sense pH regions of river water and lemon juice. HMQB has also been used for cell imaging study.
Introduction
The quality of water is determined by a number of factors including dissolved inorganic materials, color, odor, conductivity, turbidity, pH, dissolved organic matter, living microorganisms etc.1 Among these parameters, pH is one of the key factors for the normal environment and normal human health. For any aqueous medium, H3O+ and OH− are present along with other small ions/molecules. Typically, the concentration of H3O+ ion is expressed by the pH value which is measured by calculating the value of negative logarithm of the molar concentration of hydronium ions.2 According to the World Health Organization (WHO) recommendation, the pH of drinking water falls in the range of 6.5–8.5.3 Water without of above mentioned pH range may affect human health. Acid rain lowers pH value whereas microbial activities in water may alter its pH by generating acidic or basic metabolic species.4 Contaminated water with odd pH values may have some different odor and taste. Such water may influence a number of factors including corrosion of metallic containers,5 irritation in gastrointestinal tract,6 and inefficient disinfection.7 Water with low pH may have some adverse effects on agriculture as metals are generally leached out by low pH water. Water with low pH may become detrimental to microorganisms which are beneficial for the growth of crops.River basins and area near sea/oceans are generally densely populated area owing to several favorable factors including availability of water for industry, agriculture or drinking purposes, development of industries, option for alternative mode of transportation, etc. Water for domestic and industrial use is generally supplied from rivers or oceans after making it suitable for use by water treatment. Thus, it becomes mandatory to have knowledge of pH to judge the quality of water before its treatment and also before its distribution to municipality. It is to be continuously checked at different steps of water treatment.8
pH plays crucial roles in many field of sciences e.g. chemical syntheses, medicinal, environmental and life sciences.9 The extracellular pH is one of the key factors in many biological processes. Decrease in extracellular pH of ordinary cells (pH 7.2–7.4) to the pH value of 6.2–6.9 suspects the presence of tumor cells.10 Lowering in pH values has effects on tumor properties including adhesion, relocation and resistance towards drug. Thus, it is necessary to develop suitable methods to determine extracellular pH.11
Generally pH meter based on glass electrode is used in laboratory to measure pH of a solution. But it has some limitations including electrical interference and acid error.12 However, a number of other techniques have appeared for the measurement of pH. Among these, fluorescence spectroscopy has become especially interesting to the researchers because of its easy operation, low instrumentation cost, high sensitivity etc. Various types of fluorescent sensors have been developed based on wide range of fluorophore units e.g. xanthene, BODIPY, cyanine and others.13 A half-condensed Schiff-base molecule based on 4-methyl-2,6-diformylphenol (DFP) has been reported to be selective pH sensor.14 Beside this, a significant number of fluorescent probes with DFP have been constructed for sensing of different analytes establishing DFP as a promising fluorophore.14,15 Recently we have constructed a quinoline based pH sensor based on protonation and deprotonation of ring nitrogen.16
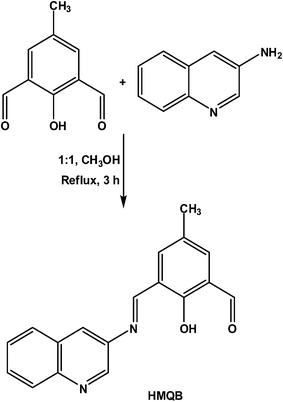
In this respect, we report synthesis, characterization and pH sensing properties of a new Schiff-base molecule, 2-hydroxy-5-methyl-3-((quinolin-3-yliminio)methyl)benzaldehyde (HMQB) (Scheme 1). HMQB has been designed and constructed based on two fluorophore units, namely DFP and quinoline, which were previously used for the fabrication of pH fluorescent sensors.14,16 We aim to check the effect on the pH sensing ability of both the fluorophores. Although significant number of metal ion sensors have been constructed based on DFP; to the best of our knowledge, there is only one report of fluorescence sensor for pH with DFP as the fluorophore.14 There is scope for improvement in the pH sensing ability of such probe. In this case, we offer visual as well as fluorescence sensing of different pH regions whereas in the previous report fluorescence intensity of the sensor increases at a particular wavelength in different pH. However, the present probe shows chromogenic and fluorogenic sensing in different regions of pH with samples collected from river water and lemon juice. In addition to this, it has been used for cell imaging study to broaden its scope of applications.
Experimental section
Materials and physical methods
3-Aminoquinoline was purchased from Sigma Aldrich and was used as received. 4-Methyl-2,6-diformylphenol (DFP) was synthesized following a published procedure.17 All other reagents were purchased from commercial source and were used without further purification. Solvents used during spectroscopic studies were purified and dried by standard procedures.18 FT-IR spectra were obtained from a Perkin Elmer spectrometer (Spectrum Two) with the samples by attenuated total reflectance (ATR) technique. Absorption spectra were recorded on a Lambda 25 Perkin Elmer spectrophotometer and emission spectra on a Shimadzu RF-5301-PC spectrophotometer. Elemental analysis was carried out with a 2400 Series-II CHN analyzer, Perkin Elmer, USA. ESI-MS+ spectra were recorded on a QTOF Micro YA263 mass spectrometer. NMR spectra of the compounds were recorded on Bruker 300 MHz spectrometer.Synthesis of 2-hydroxy-5-methyl-3-((quinolin-3-yliminio)methyl)benzaldehyde (HMQB)
To a methanolic solution (20 mL) of 4-methyl-2,6-diformylphenol (DFP) (1.64 g, 10 mmol), 20 ml of methanolic solution of 3-aminoquinoline (1.44 g, 10 mmol) was added slowly under stirring condition. This mixture was stirred for 20 min. Then it was refluxed for 6 h. On cooling of this mixture to room temperature, orange product appeared as precipitate and it was collected by filtration. The product was recrystallized from toluene. Yield: 2.10 g (71%). Anal. calc. (%) for C18H14N2O2: C, 74.48; H, 4.83; N, 9.65. Found: C, 74.39; H, 4.91; N, 9.54. 1H-NMR (500 MHz, CDCl3) (d, ppm): 2.39 (s, 3H), 7.61 (t, 1H, overlapped), 7.62 (s, 1H, overlapped), 7.74 (t, 1H, J1 = 7.5 Hz, J2 = 6.5 Hz), 7.88 (d, 1H, J = 8.0 Hz), 7.99 (s, 1H), 8.15 (d, 1H, J = 7.5 Hz), 8.86 (s, 1H), 8.96 (s, 1H), 13.49 (s, 1H, br); 13C-NMR (300 MHz, DMSO-d6; δ): 192.2, 164.9, 161.2, 146.6, 142.7, 140.5, 139.5, 132.0, 129.4, 129.2, 128.7, 128.3, 127.9, 127.4, 125.5, 123.3, 120.4 and 19.4. ESI-MS+ (m/z): 291.07 (HMQB + H+).Theoretical calculations
The ground state (S0) geometry of HMQB and MQB− were fully optimized by DFT calculation using the Gaussian 03 program.19 The optimized structure of the compound has been obtained from B3LYP hybrid function with 6-31G basis set for H, C, N and O atoms. The absorption properties of HMQB and MQB− in water were calculated by a time-dependent density functional theory (TDDFT)20 approach associated with the conductor-like polarizable continuum model (CPCM).21Cell culture and cell imaging
We have studied the intracellular pH change using HMQB to HeLa cells. The HeLa cells were grown in DMEM (Gibco) medium containing 10% FBS (Gibco) and 1% Pen-Strep (Gibco). The extra cellular pH was changed using 10.0 mM NaOH or 10.0 mM HCl to the DMEM and intracellular pH responses were monitored. The cells were incubated with 1.0 mM HMQB for 30 min at different pH and the cells were washed with DMEM medium with corresponding pH for three times. The distributions of the probe in the cells were monitored using confocal microscopy where excitation was at 405 nm and emissions were monitored at 470 nm and 530 nm. The cytotoxic effect of the sensor was monitored for 12 h but there were no significant cytotoxic effect.HeLa cells were used for the evaluation of the cytotoxicity of the pH sensor, HMQB, dissolved in DMSO. Cells were plated in 96 well plates at 1 × 10⁴ density per well and maintained in the culture for 24 h at 37 °C in 5% CO2 incubator. After that 1.0 mM and 10.0 mM of the probe (final concentration) were added to the culture plates and incubated for 12 h and for the control, only DMEM medium was used. Final DMSO concentration was maintained below 1%. After 12 h incubation of the sensor, 3-(4,5-dimethylthiazolyl-2)-2,5-diphenyltetrazolium bromide (MTT) was used to study the cell viability assay and absorbance of the formazan dye was determined by the micro-plate reader at 595 nm (Bio-RAD, USA), where untreated cells were assumed as 100% viable.
Results and discussion
HMQB has been synthesized by Schiff-base condensation of one equivalent of DFP and one equivalent of 3-aminoquinoline in 1![[thin space (1/6-em)]](https://www.rsc.org/images/entities/char_2009.gif) :
:![[thin space (1/6-em)]](https://www.rsc.org/images/entities/char_2009.gif) 1 ratio in methanol (Scheme 1). To get the desired product amine has been taken in lower equivalent with respect to the formyl group. Different spectroscopic analyses confirm the formation of HMQB leaving one of the formyl groups unreacted. ESI mass spectrum of HMQB shows its m/z peak at 291.07 which is due to the presence of HMQB. FT-IR spectrum of the compound exhibits two important bands at 1677 and 1607 cm−1 indicating the presence of one CHO group and one C
1 ratio in methanol (Scheme 1). To get the desired product amine has been taken in lower equivalent with respect to the formyl group. Different spectroscopic analyses confirm the formation of HMQB leaving one of the formyl groups unreacted. ESI mass spectrum of HMQB shows its m/z peak at 291.07 which is due to the presence of HMQB. FT-IR spectrum of the compound exhibits two important bands at 1677 and 1607 cm−1 indicating the presence of one CHO group and one C![[double bond, length as m-dash]](https://www.rsc.org/images/entities/char_e001.gif) N moiety respectively. 1H NMR spectrum also confirms the presence of one formyl proton at 10.53 ppm and one imine proton at 8.86 ppm indicating the formation of HMQB.
N moiety respectively. 1H NMR spectrum also confirms the presence of one formyl proton at 10.53 ppm and one imine proton at 8.86 ppm indicating the formation of HMQB.
UV-vis spectra of HMQB (1 × 10⁻⁴ M) have been recorded in different pH using Britton Robinson buffer22 at room temperature (Fig. 1). It has been observed that it exhibits absorption maxima at 350 nm in pH 2 in at room temperature. As the pH of the medium increases the intensity of absorbance at 350 nm gradually decreases and a new peak emerges at 435 nm with increasing intensity. This bathochromic shift in higher pH region may due to the deprotonation of the phenolic hydroxyl group.14
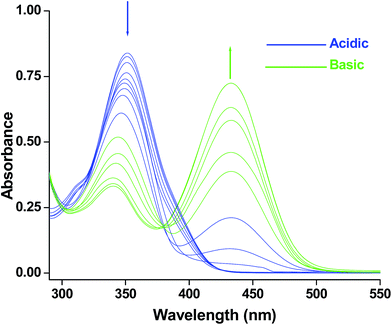 | ||
| Fig. 1 UV-visible spectra of HMQB (1 × 10⁻⁴ M) at pH = 2.0, 2.5, 3.0, 3.5, 4.0, 4.5, 5.0, 5.5, 6.0, 6.5, 7.0, 7.5, 8.0, 8.5, 9.0, 9.5, 10.0 in Britton Robinson buffer at room temperature. | ||
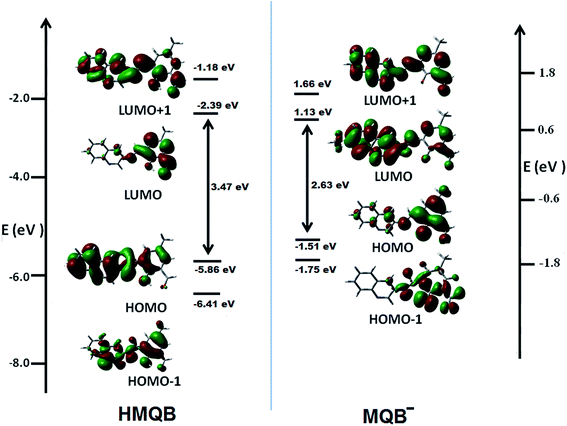
These experimental observations are supported by the result of theoretical calculations. The ground state (S0) geometries HMQB and its deprotonated form, MQB−, were fully optimized by DFT/B3LYP method using the Gaussian 03 program. Geometries of optimized structures are shown in Fig. 2. Considering the optimized structure of the ground state, the absorption spectral properties of HMQB and MQB− in water have been calculated by a time-dependent density functional theory (TD-DFT) approach associated with the conductor-like polarizable continuum model (CPCM). The lowest 20 singlet–singlet transitions have been computed and the results of TD calculations have been found to be qualitatively very similar. Due to the presence of electronic correlation in the TDDFT (B3LYP) method, it can yield more accurate electronic excitation energies. HMQB shows intense peak at 350 nm (experimental value: 350 nm), whereas MQB− shows peaks at 343 nm (experimental value: 340 nm) and 445 nm (experimental value: 435 nm), respectively (Table 1; Fig. 3). It has also been observed from the DFT calculation that HOMO–LUMO energy gap is decreased in deprotonated form (MQB−) compare to that of the protonated one (HMQB) (Fig. 3). This may be the reason behind the bathochromic shift which is occurring with increase in pH. GaussView 5 software was used to prepare the calculated electronic density plots for frontier molecular orbitals.
| Compound | Excitation (eV) | Electronic transition state | Excitation (nm) | Osc. strength (f) | Key transitions | Transition assigned |
|---|---|---|---|---|---|---|
| HMQB | 3.5447 | S0–S2 | 350 | 0.1058 | (63%) HOMO → LUMO+1 | ILCT |
| MQB− | 2.7783 | S0–S2 | 445 | 0.0828 | (73%) HOMO−1 → LUMO | ILCT |
| 3.6110 | S0–S5 | 343 | 0.0079 | (40%) HOMO−1 → LUMO+1 | ILCT |
To obtain the emission spectra of HMQB (1 × 10⁻⁴ M) in different pH range, it has been excited at 400 nm. HMQB in Britton Robinson buffer of pH 2.0 exhibits an emission maximum at 464 nm with strong intensity. The intensity at that particular wavelength starts to decrease with the increase in pH of the medium and a new emission peak appears at 530 nm. With further increase in pH the new peak at 530 nm becomes intensified (Fig. 4). The emission peaks at 464 nm and 530 nm can be attributed to the presence of HMQB and MQB−, respectively. The emission intensities at 464 nm were plotted against pH of the medium and it reflects an almost linear relationship between I464 and pH in between pH 4–6 (Fig. s5†). The pKa value of HMQB has been calculated with the of help of the Henderson–Hasselbach type mass action equation: log{(Fmax − F)/(F − Fmin)} = pH − pKa, where Fmax, Fmin, F represent the maximum, minimum and observed fluorescence intensity at a given pH value, respectively.23 It has been found to be 5.20.
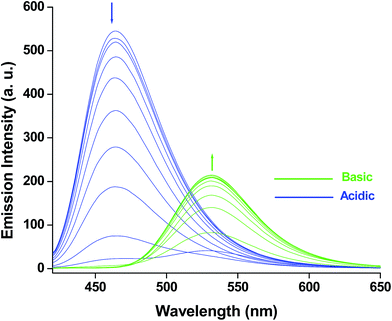 | ||
| Fig. 4 Emission spectra of HMQB (1 × 10⁻⁴ M) at pH = 2.0, 2.5, 3.0, 3.5, 4.0, 4.5, 5.0, 5.5, 6.0, 6.5, 7.0, 7.5, 8.0, 8.5, 9.0, 9.5, 10.0 in Britton Robinson buffer at room temperature. | ||
To ensure whether the pH sensing ability of the compound does alter in presence of different ions including environmentally threatening metal ions and anions or not, the emission spectra were taken in the presence of the ions at pH 5.0 and pH 8.0. It has been observed that emission intensity does not alter too much in the presence of Na+, K+, Zn2+, Mg2+, Cu2+, Mn2+, Fe3+, Co2+, Ca2+, Ni2+, NO3−, Cl−, SO42−, PO43− and BO33− whereas Cu2+, Mn2+ and Fe3+ slightly decreases the emission intensity (Fig. s6 and s7†).
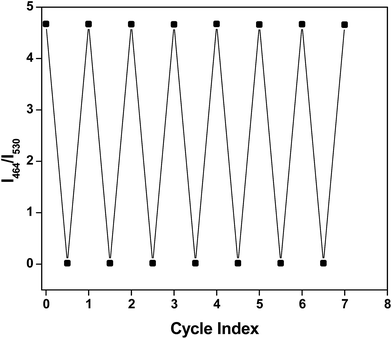
A question may arise about the stability of a Schiff-base in different pH range. Schiff-base compounds undergo hydrolysis in acidic medium. But a number of Schiff-bases were reported to be extremely stable in wide range of pH.13 However, to ensure the stability of HMQB towards pH variation, its aqueous solution is adjusted back and forth between pH 4 and pH 10 with 2 (M) HCl and 2 (M) NaOH solutions. The corresponding array is represented in Fig. 5, which indicates the good sensitivity of the material towards pH switching. The Schiff-base molecule is fairly stable in this pH range. This also reflects that the pH of the medium can be switched to acidic and basic range several times repeatedly without too much deterioration of its on/off character.
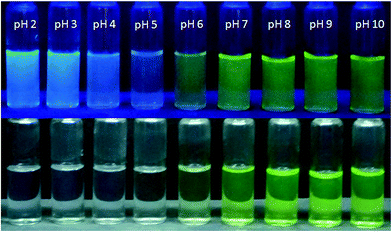
For chromogenic detection of different pH regions, we have captured images of HMQB in different pH solutions under UV irradiation and visible light (Fig. 6). The colorless solution of HMQB in acidic pH region turns to be yellowish green in alkaline pH. When we see color of HMQB solution in low pH region under UV radiation, we can see blue coloration which changes to green on shifting pH region to basic range. This result has been well reflected by results of UV-vis spectra. Colorless solution of HMQB shows absorption maxima at 350 nm whereas its basic solution in higher pH region exhibits band at 435 nm displaying blue coloration in solution. This is to note that change in color at pH 6 and pH below 6 is noticeable with naked eye. The Schiff-base molecule shows similar effect with insignificant change in color intensity for pH 6 and above. This change can hardly be noticed with naked eye.
pH sensor based on diformylphenol system is very much limited. There is only one report of DFP based pH sensor.14 Previously reported pH sensor showed increment in emission intensity with increase in pH. However, it has been not mentioned in the report that whether the reported probe could detect different pH regions. This comparison showed superior utility of the present sensor, HMQB. We have reported another simple pH sensor based on quinoline derivative.16 Our previous probe was useful for detection of acidic and basic regions like the present one. However, HMQB has been applied for cell imaging study while our previous probe was not employed for such purpose.
Next we focus on its utility to detect pH of a real system. For this purpose we chose water of river Ganga and lemon (citrus limon) juice. Because of presence of different metal ions, suspended materials, industrial discharge etc. water from river Ganga is alkaline16 while existence of citric acid makes lemon juice acidic. Thus, we can check applicability of HMQB by employing it in samples of two different pH regions. Another reason for the selection of river water is that water supply to Kolkata Municipal Corporation area with vast population is done by purifying water from river Ganga. There are potential sources in this area that can pollute the river water. Water has been collected from Diamond Harbour of 24 Parganas (South) district, about forty km downstream from Kolkata. We hope to present the pollutants that can play their role in water. pH has been determined to be 7.83 by a pH meter. We capture images of this river water in the presence of the probe (Fig. 7). It shows greenish yellow under visible light and bright green under UV irradiation (Fig. 7c and d). We select lemon juice to get an acidic solution to check sensing ability of the probe in acidic medium. pH of lemon juice has been measured to be 2.5. Images of lemon juice in absence and in the presence of HMQB under visible and UV irradiation are persistent with result given in Fig. 6. The emission and absorption spectra of this river water and lemon juice in the presence of probe (1 × 10⁻⁴ M) have been recorded (ESI, Fig. s8–s11†). These spectra are similar to those obtained with probe in Britton Robinson buffer under similar conditions. Thus, other ions present in real sample are not able to affect the sensing ability of the sensor.
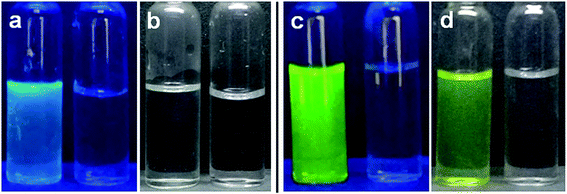 | ||
| Fig. 7 HMQB under UV irradiation (a) & (c) and visible light (b) & (d) in lemon juice (a) & (b) and water from river Ganga (c) & (d). | ||
We have applied the probe to cell imaging study using HeLa cell with the help of a fluorescence microscopy. Actually application of HMQB in cell imaging study widens its applicability from real sample to biological system. To examine its ability in such studies, we have changed extracellular pH with 10 mM HCl or 10 mM NaOH solution. We have adjusted extracellular pH as 4.0, 4.5, 5.0, 7.4 and 8.0 in the presence of HMQB. Images of the cell in the presence of probe have been captured after incubation at 37 °C for 30 min (Fig. 8). We have checked the images with emissions at 470 nm and 530 nm for acidic and basic pH regions using excitation wavelength at 405 nm. Blue color cells are observed in the presence of the probe at pH 4.0 and 4.5 as expected and no green image is detected at these pH values. However, at 5.0, both blue and green cell are observed under 470 and 530 nm respectively. Only green color cells at 530 nm can be seen as the pH of the medium changes to basic regions (pH 7.4 and 8.0) where no blue image is noticed. The cytotoxicity study (MTT assay) in cervical cancer cells treated with two different concentrations of HMQB for up to 12 h (Fig. s12†) shows that HMQB of concentration up to 10 mM does not indicate any considerable cytotoxic effect on the cells for at least up to 12 h. We observed no significant effects on cell survivability by MTT assay. We observed very tiny particles inside the cells which might be due to aggregation of the probe inside the cell. But more or less the compound showed no cytotoxic effects. Thus, these results indicate that HMQB is an efficient contender for monitoring changes in different pH region in cells under biological conditions.
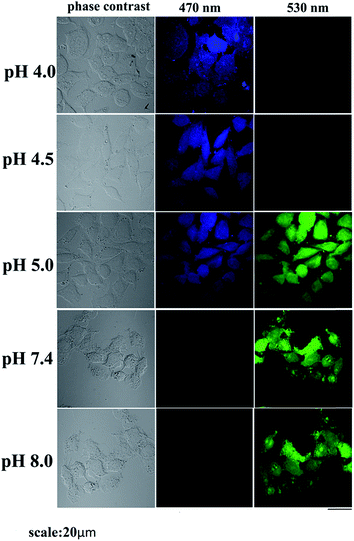 | ||
| Fig. 8 The phase contrast and fluorescence images of HeLa cells captured after being incubated with 1.0 mM HMQB at 4.0, 4.5, 5.0, 7.4 and 8.0 at 37 °C for 30 min. | ||
Conclusions
In summary, we have been able to isolate and characterize a half-condensed Schiff-base compound derived from diformylphenol and quinoline amine. It shows two different bands in UV-vis and fluorescence spectroscopic measurements in acidic and basic pH regions establishing it a colorometric and fluorometric pH sensor. Theoretical calculations have been performed to investigate the observed spectral transitions. This fluorescent chemosensor is able to indentify acidic and basic pH regions even with real sample. It has been used for biological applications. This study indicates the HMQB can be an innate pH indicator.Acknowledgements
PR wishes to thank Department of Science and Technology, New Delhi for financial supports. SH and AB wish to thank CSIR, New Delhi, for their fellowships.References
- A. K. De, Environmental Chemistry, New Age International (P) Limited Publishers, New Delhi, 7th edn, 2010 Search PubMed.
- D. A. Skoog, D. M. West and F. J. Holler, Fundamentals of Analytical Chemistry, Saunders College Publishing New York, NY, 6th edn, 1992 Search PubMed.
- World Health Organization, Guidelines for Drinking-water Quality, WHO Press, Geneva, Switzerland, 4th end, 2011, accessed on April 07, 2016 at http://www.who.int/water_sanitation_health/publications/dwq_guidelines/en/ Search PubMed.
- L. M. Prescott, J. P. Harley and D. A. Klein, The influence of environmental factors on growth, Microbiology, McGraw-Hill Companies Inc., USA, 1999 Search PubMed.
- R. Sadiq, S. Imran and V. Kleiner, Examining the impact of water quality on the integrity of distribution infrastructure, American Water Works Association Research Foundation, Denver, CO, USA, 2007 Search PubMed.
- O. Korostynska, K. Arshak, E. Gill and A. Arshak, IEEE Sens. J., 2008, 8, 20 CrossRef CAS.
- P. Payment, M. Waite and A. Durfour, Assessing microbial safety of drinking water improving approaches and methods: improving approaches and methods, Organisation for Economic Cooperation and Development and World Health Organization, 2003 Search PubMed.
- M. H. Banna, S. Imran, A. Francisque, H. Najjaran, R. Sadiq, M. Rodriguez and M. Hoorfar, Crit. Rev. Environ. Sci. Technol., 2014, 44, 1370 CrossRef CAS.
- (a) K. Xu and A. M. Klibanov, J. Am. Chem. Soc., 1996, 118, 9815 CrossRef CAS; (b) R. A. Gottlieb and A. Dosanjh, Proc. Natl. Acad. Sci. U. S. A., 1996, 93, 3587 CrossRef CAS PubMed.
- (a) A. Lardner, J. Leukocyte Biol., 2001, 69, 522 CAS; (b) T. R. Arnett, J. Nutr., 2008, 138, 415S CAS.
- (a) X. Zhang, Y. Lin and R. J. Gillies, J. Nucl. Med., 2010, 51, 1167 CrossRef CAS PubMed; (b) A. I. Hashim, X. Zhang, J. W. Wojtkowiak, G. V. Martinez and R. J. Gillies, NMR Biomed., 2011, 24, 582 Search PubMed.
- G. Mattock and G. R. Taylor, pH Measurement and Titration, Heywood, London, 1961, pp. 198–246 Search PubMed.
- (a) X. Li, X. Gao, W. Shi and H. Ma, Chem. Rev., 2014, 114, 590 CrossRef CAS PubMed; (b) J. Y. Han and K. Burgess, Fluorescent Indicators for Intracellular pH, Chem. Rev., 2010, 110, 2709–2728 CrossRef CAS PubMed.
- U. C. Saha, K. Dhara, B. Chattopadhyay, S. K. Mandal, S. Mondal, S. Sen, M. Mukherjee, S. van Smaalen and P. Chattopadhyay, Org. Lett., 2011, 13, 4510 CrossRef CAS PubMed.
- (a) S. Dey, A. Roy, G. P. Maiti, S. K. Mandal, P. Banerjee and P. Roy, New J. Chem., 2016, 40, 1365 RSC; (b) R. Alam, T. Mistri, A. Katarkar, K. Chaudhuri, S. K. Mandal, A. R. Khuda-Bukhsh, K. K. Das and M. Ali, Analyst, 2014, 139, 4022 RSC; (c) T. Mistri, M. Dolai, D. Chakraborty, A. R. Khuda-Bukhsh, K. Kumar Das and M. Ali, Org. Biomol. Chem., 2012, 10, 2380 RSC; (d) B. Chakraborty, P. Halder, S. Chakraborty, O. Das and S. Paria, Inorg. Chim. Acta, 2012, 387, 332 CrossRef CAS; (e) P. Roy, K. Dhara, M. Manassero and P. Banerjee, Inorg. Chim. Acta, 2009, 362, 2927 CrossRef CAS; (f) P. Roy, K. Dhara, M. Manassero, J. Ratha and P. Banerjee, Inorg. Chem., 2007, 46, 6405 CrossRef CAS PubMed.
- S. Halder, S. Dey and P. Roy, RSC Adv., 2015, 5, 54873 RSC.
- R. R. Gagne, C. L. Spiro, T. J. Smith, C. A. Hamann, W. R. Thies and A. K. Schiemke, J. Am. Chem. Soc., 1981, 103, 4073 CrossRef CAS.
- D. D. Perrin, W. L. F. Armarego and D. R. Perrin, Purification of Laboratory Chemicals, Pergamon Press, Oxford, U.K., 1980 Search PubMed.
- M. J. Frisch, G. W. Trucks, H. B. Schlegel, G. E. Scuseria, M. A. Robb, J. R. Cheeseman, J. A. Montgomery Jr, T. Vreven, K. N. Kudin, J. C. Burant, J. M. Millam, S. S. Iyengar, J. Tomasi, V. Barone, B. Mennucci, M. Cossi, G. Scalmani, N. Rega, G. A. Petersson, H. Nakatsuji, M. Hada, M. Ehara, K. Toyota, R. Fukuda, J. Hasegawa, M. Ishida, T. Nakajima, Y. Honda, O. Kitao, H. Nakai, M. Klene, X. Li, J. E. Knox, H. P. Hratchian, J. B. Cross, V. Bakken, C. Adamo, J. Jaramillo, R. Gomperts, R. E. Stratmann, O. Yazyev, A. J. Austin, R. Cammi, C. Pomelli, J. W. Ochterski, P. Y. Ayala, K. Morokuma, G. A. Voth, P. Salvador, J. J. Dannenberg, V. G. Zakrzewski, S. Dapprich, A. D. Daniels, M. C. Strain, O. Farkas, D. K. Malick, A. D. Rabuck, K. Raghavachari, J. B. Foresman, J. V. Ortiz, Q. Cui, A. G. Baboul, S. Clifford, J. Cioslowski, B. B. Stefanov, G. Liu, A. Liashenko, P. Piskorz, I. Komaromi, R. L. Martin, D. J. Fox, T. Keith, M. A. Al-Laham, C. Y. Peng, A. Nanayakkara, M. Challacombe, P. M. W. Gill, B. Johnson, W. Chen, M. W. Wong, C. Gonzalez and J. A. Pople, Gaussian 03 (Revision C.02), Gaussian Inc., Wallingford, CT, 2004 Search PubMed.
- (a) A. D. Becke, J. Chem. Phys., 1993, 98, 5648 CrossRef CAS; (b) P. J. Hay and W. R. Wadt, J. Chem. Phys., 1985, 82, 299 CrossRef CAS; (c) S. Miertus, E. Scrocco and J. Tomasi, Chem. Phys., 1981, 55, 117 CrossRef CAS; (d) V. Barone, M. Cossi and J. Tomasi, J. Comput. Chem., 1998, 19, 404 CrossRef CAS.
- (a) V. Barone and M. Cossi, J. Phys. Chem. A, 1998, 102, 1995 CrossRef CAS; (b) M. Cossi and V. Barone, J. Chem. Phys., 2001, 115, 4708 CrossRef CAS; (c) M. Cossi, N. Rega, G. Scalmani and V. Barone, J. Comput. Chem., 2003, 24, 669 CrossRef CAS PubMed.
- H. T. S. Britton and R. A. Robinson, J. Chem. Soc., 1931, 1456 RSC.
- L. Cao, X. Li, S. Wang, S. Li, Y. Li and G. Yang, Chem. Commun., 2014, 50, 8787 RSC.
Footnote |
| † Electronic supplementary information (ESI) available. See DOI: 10.1039/c6ra06284a |
| This journal is © The Royal Society of Chemistry 2016 |

