 Open Access Article
Stability studies of ionic liquid [EMIm][NTf2] under short-term thermal exposure†
Christin
Neise
a,
Christine
Rautenberg
b,
Ursula
Bentrup
b,
Martin
Beck
c,
Mathias
Ahrenberg
d,
Christoph
Schick
d,
Olaf
Keßler
c and
Udo
Kragl
*a
aInstitute of Chemistry, University of Rostock, Albert-Einstein-Str. 3a, 18059 Rostock, Germany. E-mail: udo.kragl@uni-rostock.de
bLeibniz Institute for Catalysis (LIKAT Rostock), Albert-Einstein-Str. 29 a, 18059 Rostock, Germany
cFaculty of Mechanical Engineering and Marine Technology, Chair of Materials Science, University of Rostock, Albert-Einstein-Str. 2, 18059 Rostock, Germany
dInstitute of Physics, University of Rostock, Albert-Einstein-Str. 23-24, 18059 Rostock, Germany
First published on 4th May 2016
Abstract
Ionic liquids (ILs) as new media for synthesis and as functional fluids in technical applications are still of high interest. Cooling a steel component from an annealing temperature of nearly 850 °C down to room temperature in a liquid bath is a technically important process. The use of ionic liquids offers advantages avoiding film boiling of the quenching medium. However, such a high immersion temperature exceeds the thermal stability of the IL, for example such as [EMIm][NTf2]. To obtain information about formation of potential toxic decomposition products, potential fragments at varied states of decomposition of [EMIm][NTf2] were studied by various spectroscopic and gravimetric methods. For the first time it was possible to quantify fluorine-containing products via mass spectrometry coupled directly with thermogravimetric (TG) measurements. While chemical and spectroscopic analysis of thermally stressed ILs revealed no hints concerning changes of composition after quenching hot steel for several times, the mass-spectrometer (MS) coupled TG analysis gives information by comparing the decomposition behaviour of fresh and used ILs. A number of fragments were detected in low amounts confirming the proposed decomposition mechanism.
1. Introduction
Whereas ionic liquids (ILs) at the beginning were often introduced as green solvents in synthetic chemistry, the view nowadays is more detailed.1,2 Certainly their extremely low vapour pressure may offer advantages in certain applications. There is a large number of publications covering many possible applications, some of them with the potential to replace other systems. One area not yet fully explored is in the area of recycling cellulose and other organic materials or biomass pre-treatment.3 Well known are water mixtures and the use of protic and aprotic ionic liquids in water science4 as well as enzymatic biocatalysts for biomass processing.5 Another field of interest is engineering applications with special technical requirements for ILs such as electrolytes for alkali-metal electrochemical devices, lubricants or polymers for solar cells as well as water splitting fuel cells.6,7 Charge transport in ionic liquids and electrochemical reactions were analysed by Watanabe8 and Katayama.9 Due to of all these different fields it is extremely important to have reliable analytical methods for e.g. purity control. But in the case of ILs analytical quality assurance is more complex as properties change caused by the smallest impurities.10 Thermogravimetric combined with mass spectrometric analysis is one possibility to detect fragments and traces to understand decomposition mechanisms and detect impurities and decomposition products. This method was used in this study.Amongst the ionic liquids especially 1-ethyl-3-methyl-imidazolium bis(trifluoromethylsulfonyl)imide [EMIm][NTf2] shows high potential for many applications (Fig. 1). This IL is widely available and features high thermal stability, low vapour pressure and low melting point.11 Thus, its application in a number of applications is investigated accompanied by fundamental research as well to understand its behaviour. Energy storage, densities and thermal conductivities are quite favourable according to Liu and Fox.12 Hydrogen production in aromatic and aliphatic ionic liquids was researched by Dhiman and LaVerne.13
We have recently established the application of ionic liquids in the process of metallic component hardening.14 The heat treatment processes often contain a quenching step yielding in a short term thermal stress for the liquid used.15 A main criterion for the application of ILs as quenching media is to suppress the Leidenfrost-phenomenon, which is taking place due to the high vapor pressure when using conventional quenching baths. Cooling down a steel part from an annealing temperature of about 850 °C down to room temperature is connected with residual stresses and distortion due to uneven cooling, which can be reduced by using [EMIm][NTf2].16,17 Such high temperatures exceed the thermal stability even of this IL. For extending the application the investigation of the stability of the ionic liquid as well the detection and identification of possible decomposition products is necessary, which is difficult using conventional methods such as NMR.17 In this work the influence of the oxygen atmosphere and the stability under short term exposure will be analyzed by different thermogravimetric methods. Especially thermogravimetric methods coupled with mass spectrometry (TG-MS) analysis yield more information by comparing the decomposition behaviour of fresh and used ILs. Recording the MS data in “Scan mode” gives comprehensive information about the formed fragments, which enables a detailed thermal analysis for further investigations using typical multiple ion detection (MID) mode. The formation of potential toxic decomposition products and gases such as SO2, CO2 or HF will become visible. These are on one hand important for process safety, but may also led to further understanding of for example corrosion processes.
2. Experimental
Materials
The ionic liquid [EMIm][NTf2] (1-ethyl-3-methylimidazolium bis(trifluoromethylsulfonyl)imide) used in this work is purchased from Iolitec with a purity ≥ 98%. The molar mass is 391.31 g mol−1. It was dried under vacuum for 3 hours for pre-conditioning. The purity was verified using NMR spectroscopy (1-H, 13-C; 19-F and DEPT) recorded on a Bruker ARX 300 spectrometer. The spectra were calibrated with respect to traces of DMSO or H2O in the deuterated solvent used (d6-DMSO: 1-H d = 2.50 ppm; 13-C d = 39.5 ppm; D2O: 1-H d = 3.32 ppm). MIR spectra (500–4000 cm−1) were recorded using the ATR technique with a Thermo Nicolet 380FT-IR spectrometer. Elemental analyses for C, H, N, and S were obtained with a Flash EA 1112 NC Analyzer from CE Instruments (experimental error ±0.5%). Mass spectra were recorded in the electron ionization mode with a Finnegan MAT 95-XP (Thermo Electron). For electrospray ionization experiments, the HPLC system was coupled to a 6210 Time-of-Flight LC/MS (Agilent) with an eluent composition of MeOH/0.1% HCOOH in water 90![[thin space (1/6-em)]](https://www.rsc.org/images/entities/char_2009.gif) :
:![[thin space (1/6-em)]](https://www.rsc.org/images/entities/char_2009.gif) 10. No column was used. The moisture content of the ionic liquids was measured by Karl-Fischer-titration using a 756/831 KF Coulometer from Metrohm. The viscosities of the ILs were determined using a Stabinger Viscometer SVM 3000 for dynamic viscosity with the M5-single-point-method.
10. No column was used. The moisture content of the ionic liquids was measured by Karl-Fischer-titration using a 756/831 KF Coulometer from Metrohm. The viscosities of the ILs were determined using a Stabinger Viscometer SVM 3000 for dynamic viscosity with the M5-single-point-method.
Experimental setup and sample preparation
The dried sample of [EMIm][NTf2] is used for the quenching procedure and as pure substance for analysis. The metallic components are made of steel X5CrNi18-10 (AISI 304) with cylindrical geometry (29.5 mm × 120 mm) hosting a thermocouple arrangement of two type K thermocouples with 0.5 mm diameters.14 The samples were machined into the required dimensions and cleaned with deionized water and ethanol prior to the quenching experiments. A schematic view of the experimental quenching setup is shown in Fig. 2. The metal samples were heated up to 850 °C as annealing temperatures under ambient atmosphere for 20 minutes in a muffle furnace (VEB Elektro Bad Frankenhausen). After reaching the desired temperature, they were removed from the furnace and immediately immersed into the quenching medium, with a bath temperate of about 30 °C.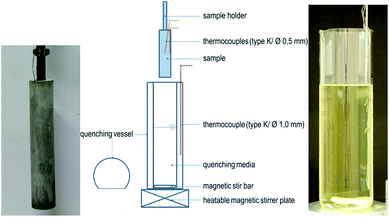 | ||
| Fig. 2 Experimental setup for quenching with metallic sample (left) and ionic liquid quenching bath of 0.9 L (right). Details are given in ref. 14. | ||
During the short transfer time between furnace and bath of about 10 seconds, the samples cooled down for a maximum of 10 to 20 K. The IL as quenching bath is preheated to a constant temperature of 30 °C and cooled down after each quenching experiment by a circulating water bath. After each quenching process the metal-samples were cleaned by immersion in deionized water and rinsed with ethanol. Samples of the respective IL were taken before and after each experiment from the quenching bath for chemical analysis. The darkening of the IL during quenching is shown in Fig. 3. The sample of pure ionic liquid (A) is a colorless, clear and odorless liquid. After six times of steel quenching (B) it gets brown colored but remains clear. After more than ten times of more than 850 °C it is nearly black (C) with dark particles most likely corroded steel particles as they adhere to the magnetic stirrer bar. The last sample was generated only for obtaining possible decomposition products in higher concentration.
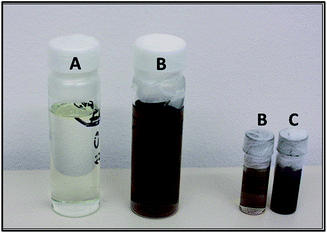 | ||
| Fig. 3 Samples of 3 states of [EMIm][NTf2] (A) pure IL; (B) after 6 times of steel quenching and (C) after more than 10 times of steel quenching. | ||
Pre-tests by short term test tubes (Draeger AG, Lübeck), for analyzing gas phases in industrial application and use by fire brigades on site, have shown formation of different gases like carbon dioxide (CO2), sulfur dioxide (SO2) and other organic vapors. Using conventional gas chromatography with flame ionization detector, we could not find any compounds besides the peaks coming from the IL itself (GC-FID using a CP3800 equipped with an autosampler CP8400 (all formerly Varian, now Agilent, Santa Barbara) and a range of polar and nonpolar capillary columns (25 m × 0.25 mm × 0.25 μm) and different temperature gradients between 100 and 200 °C. The injector temperature was set to 220 °C, the detector temperature to 250 °C).
Differential scanning calorimetry (DSC)
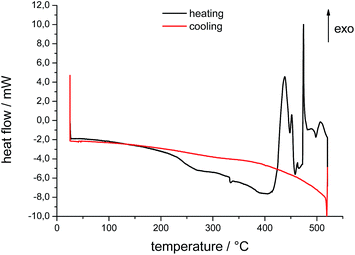
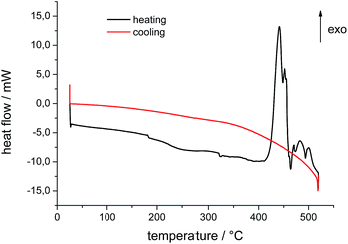
Measurements of phase-transition temperature and heat capacities were done by a Mettler-Toledo differential scanning calorimeter, model DSC 823. The instrument was calibrated for temperature and heat flow and samples were placed in platinum or aluminum crucibles (40 μL, about 15 mg of IL). The samples were heated and cooled between 25 °C and 520 °C in a nitrogen atmosphere with a rate of 10 K min−1. The decomposition temperature was determined by using the onset and start temperature. The onset temperature is the intersection of the baseline weight, either from the beginning of the experiments or after the drying step, and the tangent of weight vs. temperature curve as decomposition occurs.18 Resulting DSC curves for the pure IL and the IL after 6 times of steel quenching are shown in Fig. 4 and 5.TG-DSC-MS measurements
Simultaneous thermogravimetric (TG) and differential scanning calorimetric (DSC) measurements coupled with gas analysis by mass spectrometry (MS) were performed on a Sensys TG-DSC (Setaram, Caluire) connected to an OmniStar quadrupol mass spectrometer (Pfeiffer Vacuum). The samples (mass between 8 and 13 mg) were weighted in open aluminium crucibles (75 μL) and heated from 25 °C up to 500 °C in He (20 mL min−1) with a heating rate of 2 K min−1. The MS ionization source was electron impact (EI) with an ionization voltage of 70 eV. The MS data were collected in scan mode by scanning all masses in the range m/z = 2 up to m/z = 199. Recording the MS data in scan mode gives comprehensive information about the formed fragments which enables a detailed analysis in further investigations using the multiple ion detect (MID) mode.All experiments were repeated at least once, mostly performed 3 times. For the figures only one graph is shown.
3. Results and discussion
The mass loss of 3 different samples of [EMIm][NTf2] was measured between 25 °C and 550 °C. The resulting TG and DSC curves for the fresh sample (A) and the two samples B and C, which have been used for 6 and 10 times for quenching respectively, are shown in Fig. 6. The estimated values (mass loss, onset and peak temperatures as well as enthalpies) are summarized in Table 1.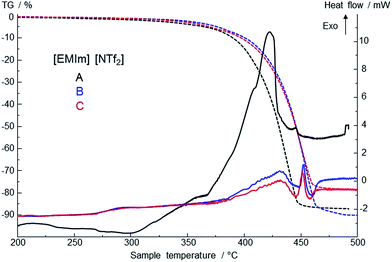 | ||
| Fig. 6 TG/DSC curves of decomposition temperatures and mass loss of 3 different IL samples (different amounts for sample A and samples B and C were used; see Results section for details). | ||
| IL | TG | DTG | DSC | ||
|---|---|---|---|---|---|
| Δm, % | T onset, °C | T Peak, °C | T Peak, °C | Enthalpy, J g−1 | |
| A | −86.3 | 409 | 438 | 422 | 485.9 |
| 446 | 2.6 | ||||
| B | −89.7 | 420 | 454 | 431 | 126.9 |
| 452 | 19.0 | ||||
| C | −77.8 | 424 | 451 | 432 | 159.4 |
| 452 | 29.7 | ||||
Compared to the fresh IL, the used ILs decompose in a different manner. The onset and the peak temperatures are shifted to higher temperatures, the shape of the DSC peaks is changed, and the enthalpies of the exothermic peaks are distinctly lowered. Comparing the DSC curves, the quenched samples B and C show similar properties, whereas the mass losses differ. These results correspond to the results of Heym et al.19 The mass loss at 450 °C varies between 75% and 85% because of small variations in the low sample mass. Also a partial evaporation can contribute to the mass loss, as well as volatilization of impurities present before.20 It is described that evaporation is analyzed by performing isothermal TGA experiments with different inert gases (H2 and N2) to investigate the mass loss, which should be different for the different inert gases.21 The experiments by DSC with heating rate of 10 K min−1 show contrary trends to thermogravimetric measurements. Phase transition from liquid to gas phase starts at about 412–415 °C in an exothermal reaction. Differences are to the different methods of measuring and heating rates which are not further discussed by the authors.21,22 According to these findings, we assume that prior to the start of exothermal decomposition at about 440 °C mass loss as detected by TGA is due to partly evaporation of the IL. Studies of Earle et al. showed the possibility of distillation of ionic liquids.23 They demonstrated that pure [EMIm][NTf2] as well as from mixtures can be distilled at 300 °C and 0.1 mbar with a distillation rate of 0.12 g h−1 in a glass tube oven. Results of Ahrenberg et al. using differential fast scanning calorimetry (DFSC) measurements support this hypothesis.24 In another content they observed nano-droplet evaporation of ionic liquids including [EMIm][NTf2] using DFSC yielding a constant ratio of the vapor pressures as determined in helium and nitrogen atmosphere. Fast heat treatment via DFSC clearly shows absence of decomposition of the pure IL at temperatures more than 100 K above the onset temperature of decomposition as determined from slow scanning methods such as TGA. Thus if decomposition can be avoided or minimized, it should be possible to reach the normal boiling point of an ionic liquid. Such high temperatures might be achieved for very short time when metallic alloys are quenched in ionic liquids.
TGA/DSC measurements of used IL as shown in Fig. 6 exhibit a small shift of 1.5 mW in heat flow between 150 °C and 200 °C. This can be attributed to water traces and volatile decomposition products from the quenching process itself. Samples were prepared at ambient conditions and contain water of maximum of 1 wt%. Small amounts of water influence positively the process of quenching metals. It has to be adjusted after each quenching experiment. In addition, ionic liquids take up water easily due to their hygroscopic behavior.25 The water content of [EMIm][NTf2] influences the behavior of decomposition and evaporation due to its own vapor pressure. Gao et al. reported a shift in FT-IR spectra for the degradation of imidazolium-based ionic liquids in aqueous solution.26 The shifts of samples B and C in TGA/DSC curves are first indicators that mass spectrometry might help to understand the processes during quenching.
The quenching of metallic components was done in an open system at air and therefore an O2 atmosphere. So it is likely that oxidized products may be formed. Kroon et al.11 studied thermal degradation of ionic liquids using quantum chemical simulation. They postulate that ILs containing anions such as [NTf2] cannot decompose via dealkylation and the cation stays intact. While chemical and spectroscopic analysis of used ILs revealed no evidence concerning changes of composition caused by the quenching process, the TGA-MS analysis gives more information by comparing the decomposition behavior of fresh and heat treated IL. The optical properties of heat treated IL samples do not allow for spectroscopic measurements. NMR, EI, ESI and IR showed no evidence of other formed products. They amounts formed may be well below the detection limits of the methods.
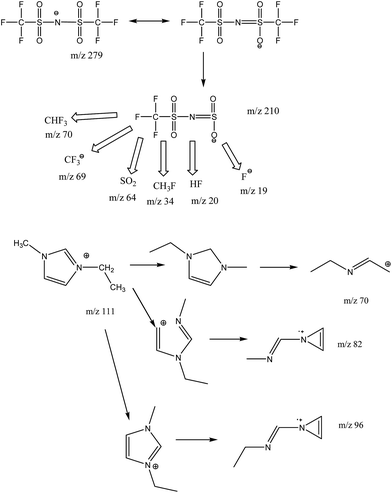
To investigate the processes during the quenching process very fast heating rates up to 10![[thin space (1/6-em)]](https://www.rsc.org/images/entities/char_2009.gif) 000 K s−1 are necessary. This can be achieved in ultrafast scanning calorimetry.24 Unfortunately it is not possible to couple ultra-fast scanning calorimetry and electron ionization mass spectrometry due to different time scales. At the beginning, the multiple ion detection (MID) mode was used for comparing our results to data of Chen et al.,27 who postulate decomposition mechanism and kinetic studies of [EMIm][NTf2]. However, this information is not enough to understand the complex thermal and chemical behavior of this IL under the repeating short thermal stress using an open system with oxygen atmosphere. The possible fragments are shown in Fig. 7. However, the available equipment could only detect m/z values up to 199.
000 K s−1 are necessary. This can be achieved in ultrafast scanning calorimetry.24 Unfortunately it is not possible to couple ultra-fast scanning calorimetry and electron ionization mass spectrometry due to different time scales. At the beginning, the multiple ion detection (MID) mode was used for comparing our results to data of Chen et al.,27 who postulate decomposition mechanism and kinetic studies of [EMIm][NTf2]. However, this information is not enough to understand the complex thermal and chemical behavior of this IL under the repeating short thermal stress using an open system with oxygen atmosphere. The possible fragments are shown in Fig. 7. However, the available equipment could only detect m/z values up to 199.
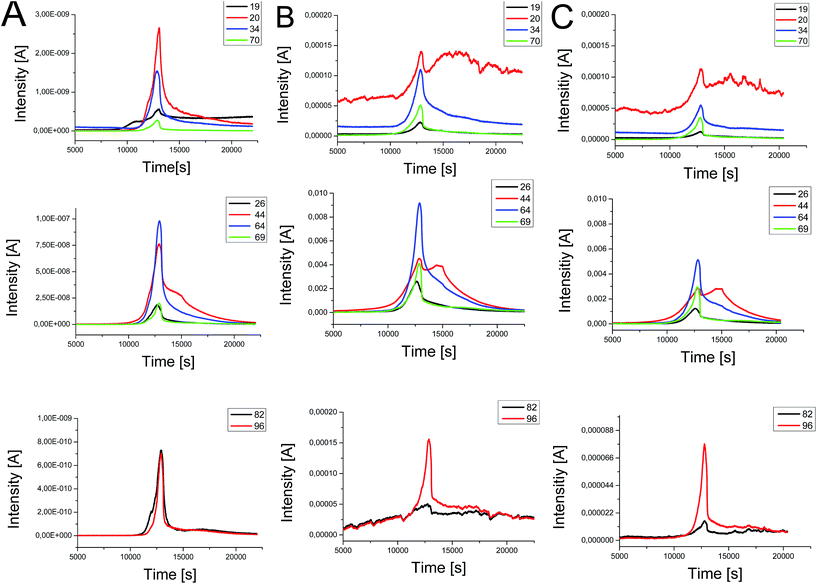
By using TGA-DSC-MS analysis in scan mode we were able to get spectra from 2 m/z to 199 m/z. In Fig. 8 intensities of m/z values of [EMIm][NTf2] for heating to 550 °C in He at 2 K min−1 measured with TGA-MS are shown. The intensities of the signals are relatively low caused by the extremely low vapor pressure of the ionic liquid. The intensities increase due to decomposition into gaseous and more volatile substances. In addition, the intensities depend on the weighted mass of the test sample.
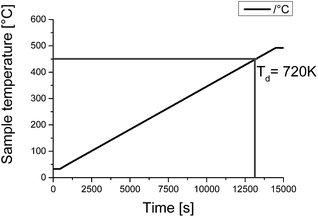
All signals that were detected belong to fragments of the cation and anion of [EMIm][NTf2]. The fragments of the anion yield signals at m/z of 19 (F), 20 (HF), 34 (CH3F), 48 (SO), 51 (HCF2), 64 (SO2), 69 (CF3), 70 (HCF3) 128 (S2O4), 134 (CF3SO2) and 162 (C2H3F3NO2S). The 1-ethyl-3-methylimidazolium cation shows typical fragments of m/z 26, 27 and 28 of the ethyl group (C2H4), 44 (CO2), 69 and 70 (C3H5N2), 82 (C4H6N2), 95 and 96 (C5H7N2) and last 110 and 111 (C6H10N2) of [EMIm]. In order to enable good comparability of intensities there are only the major signals displayed in Fig. 8. For better understanding Fig. 9 shows the temperature as function of time allowing the correlation of sample temperature und occurrence of fragments over time. On the opposite Efimova et al. analyzed 1-ethyl-3-methylimidazolium halides.28 They report, that the cation stays intact. In all three samples, we found the intact EMIm+ cation (m/z 111) in TG-MS measurements. For the pure [EMIm][NTf2] as reference our data are also in good agreement with the data of Chen,27 who used multi ion detect mode for simplification of data evaluation. But in scan mode it is possible to analyze characteristic profiles of each fragment over the complete measurement. Therefore we conclude that the elimination reaction is favorable for the decomposition process of pure [EMIm][NTf2] over the nucleophilic substitution reaction according to SN1 and SN2 mechanism. This is supported by nearly identical signals of EIm+ (m/z 96) and MIm+ (m/z 82). The fluorine (19F) peak of sample A starts to increase at 9700 seconds, which corresponds to 350 °C, and seems to be raising in 10 K steps. This characteristic profile is lost in samples B and C, which were heat treated during the quenching experiments. The pure IL shows also the highest signal of m/z 20 (HF) while the intensity of m/z 70 is hardly sufficient for evaluation. In the beginning of the TGA-MS measurement quenched ionic liquids show higher intensity for fluorine compounds than compared to other species. m/z 20 (HF) and m/z 34 (CH3F) start on a higher level, whereas m/z 19 (F) and m/z 70 (CHF3) start on a lower level. We neglected the influence of hydrogen bonding in our explanation due to the fact, that Ludwig et al.29 demonstrated its contribution to the overall interaction energy in aprotic ionic liquids to be only about 10%. The local and directional nature of this kind of interaction is still influencing unique properties of this IL. Increasing the temperature to reach a certain effect can then be related directly to changing interaction energies. The intensities for m/z 69 (CF3) and m/z 26 (C2H4) intensities are relatively low for the pure IL. Thermal exposure of [EMIm][NTf2] increases their intensities. The characteristic profile of these two fragments seems to be connected to each other. In case of the fresh IL (Fig. 8A) they occur at the same time at nearly the same level. After quenching, they appear earlier and the intensities are a little bit different (Fig. 8B and C). In a more pronounced way the decomposition fragments of the cation m/z 82 and m/z 96 change. With increasing thermal stress, the fragment m/z 82 is close to the baseline, but the fragment 96 (EIm+) is still present.
Due to the thermal exposure of the IL there is no modification in the fragmentation of typical species, but the small shift in temperature and time curves, which belongs to different reactions of elimination and nucleophilic substitutions. This also changes the macromolecular properties like pH, viscosity and density.30 On a closer examination, it becomes clear that the slope of m/z 44 (CO2) in comparison to m/z 64 (SO2) shows a significant outline with a typical shoulder at 450 °C and a second local maximum after reaching decomposition temperature. This becomes more pronounced for samples in Fig. 8B and C, but the ratio of intensities remains similar in all three cases. Neto et al.31 combined MS data of a HCT ultra mass spectrometer at 250 °C and DFT calculations performed with B3LYP/6-31+G to analyze vapor from ionic liquids. He showed that neutral ion pairs went more easily in to the gas phase.
But this is difficult to determine because of the amount of vibrational energy introduced into these neutral aggregates during heat treatment. Because the interactions of lighter gaseous clusters are weaker than for larger ones, which dominate the process, the IL can be thermally disrupted easily, particularly for the higher ordered species. The higher occurrence of CO2 in more often used samples offers notable advantages for the industrial application as quenching in carbon rich atmosphere is used to obtain carbonated surfaces of metallic components. Currently, the influence of HF, CO2 and SO2 in interaction with ionic liquids is discussed for gas capture and storage, flash point reduction and reversible absorption.32–34 This might give additional opportunities for heat treatment and at the same time surface modification of the components.
Heym et al.35 published maximum operation temperatures and vapor pressures for the application of selected ionic liquids. For [EMIm][NTf2] they reported 565 K at ambient pressure and 363 K at 1.1 × 10⁻⁴ pascal, without distinguishing between decomposition and evaporation. Nevertheless, they confirmed the highest thermal stability of this IL.
In summary, changes in the composition of heat treated [EMIm][NTf2] are very small and therefore should be no problem in application of this IL as quenching medium for steel hardening.
4. Conclusion
TG-DSC-MS analysis proved to be a suitable tool to study the thermal decomposition behavior of ILs. While chemical and spectroscopic analysis of used ILs revealed no hints concerning changes of composition by the quenching processes as reported before,17 the TGA-MS analysis gives additional information by comparing the decomposition behavior of fresh and used ILs. The different samples of ionic liquid [EMIm][NTf2] were heated up the corresponding temperature. Electron impact ionization mass spectra were scanned from 2 m/z up to 199 m/z. Recording the MS data in scan mode gives comprehensive information about the formed fragments which enables a detailed analysis in further investigations using the multiple ion detect (MID) mode. Based on the results of different fragments like SO2, CO2 and HF which are formed by the heat treatment and previously reported,17 some main conclusions can be drawn. At first we successfully adopted TGA-MS in scan mode for the complex determination of decomposition products obtained by thermally stressed ionic liquids. The commonly adopted thermal decomposition mechanisms has been proven to be valid also under these conditions. TGA and DSC measurements show that the onset temperature of decomposition of [EMIm][NTf2] and the evaporation is increased to 415 °C. Heat treatment of the ionic liquids led to characteristic modifications of the TGA-MS profiles. The gases such as SO2, CO2 and HF formed by the heat treatment process might act as short lived isolating film consequently prevent further decomposition of the ionic liquid.Acknowledgements
This work was supported by the Deutsche Forschungsgemeinschaft (DFG) (KR 2491/8-2, KE 616/17-2, SCHI 331/21-2).Notes and references
- R. N. Das and K. Roy, Toxicol. Res., 2012, 1, 186 RSC.
- K. Fujita, Y. Nikawa and H. Ohno, Chem. Commun., 2013, 49, 3257 RSC.
- P. Weerachanchai and J.-M. Lee, ACS Sustainable Chem. Eng., 2013, 1, 894 CrossRef CAS.
- S. Saita, Y. Kohno, N. Nakamura and H. Ohno, Chem. Commun., 2013, 49, 8988 RSC.
- E. Gonzalez Garcia, A. K. Ressmann, P. Gaertner, R. Zirbs, R. L. Mach, R. Krska, K. Bica and K. Brunner, Anal. Bioanal. Chem., 2014, 406, 7773 CrossRef CAS PubMed.
- C.-M. Jin, C. Ye, B. S. Phillips, J. S. Zabinski, X. Liu, W. Liu and J. M. Shreeve, J. Mater. Chem., 2006, 16, 1529 RSC.
- M. Götz, F. Ortloff, R. Reimert, O. Basha, B. I. Morsi and T. Kolb, Energy Fuels, 2013, 27, 4705 CrossRef.
- K. Yoshida, M. Nakamura, Y. Kazue, N. Tachikawa, S. Tsuzuki, S. Seki, K. Dokko and M. Watanabe, J. Am. Chem. Soc., 2011, 133, 13121 CrossRef CAS PubMed.
- Y. Katayama, Y. Toshimitsu and T. Miura, Electrochim. Acta, 2014, 131, 36 CrossRef CAS.
- D. Merli, S. Protti, P. Petracca, M. Fagnoni and A. Profumo, Electroanalysis, 2013, 25, 1453 CrossRef CAS.
- M. C. Kroon, W. Buijs, C. J. Peters and G.-J. Witkamp, Thermochim. Acta, 2007, 465, 40 CrossRef CAS.
- H. Liu, E. Maginn, A. E. Visser, N. J. Bridges and E. B. Fox, Ind. Eng. Chem. Res., 2012, 51, 7242 CrossRef CAS.
- S. B. Dhiman, G. S. Goff, W. Runde and J. Laverne, J. Phys. Chem. B, 2013, 117, 6782 CrossRef CAS PubMed.
- M. Beck, C. Schmidt, M. Ahrenberg, C. Schick, U. Kragl and O. Kessler, HTM, J. Heat Treat. Mater., 2013, 68, 214 CrossRef CAS.
- R. Redmann and O. Kessler, HTM, J. Heat Treat. Mater., 2011, 66, 281 CrossRef CAS.
- M. Beck, C. Schmidt, M. Ahrenberg, C. Schick, U. Kragl and O. Kessler, HTM, J. Heat Treat. Mater., 2015, 2, 73 CrossRef.
- C. Schmidt, M. Beck, M. Ahrenberg, C. Schick, O. Kessler and U. Kragl, RSC Adv., 2014, 4, 55077 RSC.
- C. P. Fredlake, J. Chem. Eng. Data, 2004, 49, 954 CrossRef CAS.
- F. Heym, B. J. M. Etzold, C. Kern and A. Jess, Green Chem., 2011, 13, 1453 RSC.
- C. Maton, N. De Vos and C. V. Stevens, Chem. Soc. Rev., 2013, 42, 5963 RSC.
- M. Götz, R. Reimert, S. Bajohr, H. Schnetzer, J. Wimberg and T. J. S. Schubert, Thermochim. Acta, 2015, 600, 82 CrossRef.
- P. Schmidt, M. Binnewies, R. Glaum and M. Schmidt, Materials-Modeling, 2013, http://dx.doi.org/10.5772/55547 Search PubMed.
- M. J. Earle, J. M. Esperaca, M. A. Gilea, J. N. Lopes, L. P. Rebelo, J. W. Magee, K. R. Seddon and J. A. Widegren, Nature, 2006, 439, 831 CrossRef CAS PubMed.
- M. Ahrenberg, M. Brinckmann, J. W. P. Schmelzer, M. Beck, C. Schmidt, O. Kessler, U. Kragl, S. P. Verevkin and C. Schick, Phys. Chem. Chem. Phys., 2014, 16, 2971 RSC.
- S. Cuadrado-Prado, M. Domínguez-Pérez, E. Rilo, S. García-Garabal, L. Segade, C. Franjo and O. Cabeza, Fluid Phase Equilib., 2009, 278, 36 CrossRef CAS.
- J. Gao, L. Chen, Y. Y. He, Z. C. Yan and X. J. Zheng, J. Hazard. Mater., 2014, 265, 261 CrossRef CAS PubMed.
- Y. Chen, Y. Cao, Y. Shi, Z. Xue and T. Mu, Ind. Eng. Chem. Res., 2012, 51, 7418 CrossRef CAS.
- A. Efimova, L. Pfützner and P. Schmidt, Thermochim. Acta, 2015, 604, 129 CrossRef CAS.
- K. Fumino and R. Ludwig, J. Mol. Liq., 2014, 192, 94 CrossRef CAS.
- F. Scheiff, A. Holbach and D. W. Agar, Chem. Eng. Technol., 2013, 36, 975 CrossRef CAS.
- B. A. D. Neto, E. C. Meurer, R. Galaverna, B. J. Bythell, J. Dupont, R. G. Cooks and M. N. Eberlin, J. Phys. Chem. Lett., 2012, 3, 3435 CrossRef CAS PubMed.
- Y. Abdollahi, N. A. Sairi, M. K. Aroua, H. R. F. Masoumi, H. Jahangirian and Y. Alias, J. Ind. Eng. Chem., 2015, 25, 168–175 CrossRef CAS.
- H. Liu, J. Huang and P. Pendleton, Energy Procedia, 2011, 4, 59 CrossRef CAS.
- H.-J. Liaw, C.-C. Chen, J.-R. Chen, S.-K. Huang and S.-N. Liu, Green Chem., 2012, 14, 2001 RSC.
- F. Heym, W. Korth, J. Thiessen, C. Kern and A. Jess, Chem. Ing. Tech., 2015, 87, 791 CrossRef CAS.
Footnote |
| † Electronic supplementary information (ESI) available. See DOI: 10.1039/c6ra06129j |
| This journal is © The Royal Society of Chemistry 2016 |


