
 Open Access Article
 This Open Access Article is licensed under a Creative Commons Attribution-Non Commercial 3.0 Unported Licence
HD DVD substrates for surface enhanced Raman spectroscopy analysis: fabrication, theoretical predictions and practical performance†
A. I.
Radu‡
ab,
Ye. Ye.
Ussembayev‡
cde,
M.
Jahn
ab,
U. S.
Schubert
cd,
K.
Weber
ab,
D.
Cialla-May
*ab,
S.
Hoeppener
*cd,
A.
Heisterkamp
e and
J.
Popp
ab
aFriedrich Schiller University Jena, Institute of Physical Chemistry and Abbe Center of Photonics, Helmholtzweg 4, 07745 Jena, Germany. E-mail: dana.cialla-may@leibniz-ipht.de
bLeibniz Institute of Photonic Technology Jena, Albert-Einstein-Str. 9, 07745 Jena, Germany
cLaboratory of Organic and Macromolecular Chemistry (IOMC), Friedrich Schiller University Jena, Humboldtstr. 10, 07743 Jena, Germany. E-mail: s.hoeppener@uni-jena.de
dJena Center for Soft Matter (JCSM), Friedrich Schiller University Jena, Philosophenweg 7, 07743 Jena, Germany
eInstitute of Applied Optics, Friedrich Schiller University, Fröbelstieg 1, 07743 Jena, Germany
First published on 4th May 2016
Abstract
Commercial HD DVDs provide a characteristic structure of encoding pits which were utilized to fabricate cost efficiently large area SERS substrates for chemical analysis. The study targets the simulation of the plasmonic structure of the substrates and presents an easily accessible fabrication process to obtain highly sensitive SERS active substrates. The theoretical simulation predicted the formation of supermodes under optimized illumination conditions, which were verified experimentally. First tests of the developed SERS substrates demonstrated their excellent potential for detecting vitamin A and pro-vitamin A at low concentration levels.
Introduction
The detection of trace contaminations and low concentrations of molecules represents an important area of research concerning sensing and diagnostic applications. Sensitive detection down to the molecular level is one of the key issues, e.g., for the identification of different bacteria and the treatment of diseases which are induced by them,1,2 as well as of low-molar mass substances in food-relevant matrices.3,4 Surface enhanced Raman Spectroscopy (SERS)2,4–7 has been developed into a very powerful tool to address these issues. SERS is a fast and easy to perform technique proving molecular fingerprint information of the sample. This is based on the utilization of light interactions with metallic nanoparticles or nanostructures, which result in a strong electromagnetic field on the metal surface. As a consequence, close to the nanostructured metal surface, Raman signals of molecules can be enhanced by several orders of magnitude compared to a conventional Raman measurement. One issue for the establishment of SERS tools is the availability of suitable substrates, which should provide nanostructured metallic surface features, that are, at the same time cost-efficient and preferably available in large quantities with a constant quality on a large scale. Additionally, the Raman signal enhancement behavior should be sufficient for the desired application.Top-down fabrication techniques, including e.g., optical and electron-beam lithography6,8 can provide SERS-active substrates with a high structural homogeneity and SERS signal reproducibility. In general, the applicability of these substrates is limited by high production costs due to demanding technological requirements. Alternatively, bottom-up fabrication methods provide cost-efficient and easily accessible nanostructures but have a limited control over their chemical purity, size and geometry. Therefore, these fabrication methods need still to be improved before a high efficiency for SERS measurements can be achieved on a reproducible base.
In the present study we suggest the utilization of a mass-produced commercial product as SERS-active substrates, which is well established in optical data storage technology; namely HD-DVDs. These optical storage disks are on one hand very low priced (production costs vary between $0.90 to $1.50 per HD DVD), since large scale production for the mass-market made them a widespread technological product, and are, on the other hand, high quality products regarding their encoded structure.8–10 In particular for the change from common CD to the DVD and later on to the HD DVD standard, the primary priority was the improvement of the molding processes to obtain nanometer precision as well as to establish the required quality controls. As a result, the modern CD/DVD industry reached excellent product quality not only for the conventional (CD and DVD) but also for the next-generation (HD DVD and Blue-Ray) disks.11,12
We report here the fabrication of SERS substrates based on commercial HD DVDs, a theoretical discussion of the surface plasmon characteristics of the HD DVD structure based on finite element modelling (FEM) and finally demonstrate their capabilities for SERS application by the detection of vitamin A (retinol) and pro-vitamin A (β-carotene) as model substances. As a result, it could be demonstrated that HD DVD disks are attractive nanostructured materials for plasmonic applications due to the structural arrangement and dimensions of their encoding pits.
Results and discussion
Commercially available double-sided HD DVD disks present a sandwich-like structure consisting of different layers (Fig. 1a). Two 0.6 mm thick polycarbonate (PC) layers act as a support for two reflective, mirror-like metal films with a thickness of 0.1 mm. These metal layers are separated by an additional thin polymer-based protective layer.11,13 The encoding pits are located within the PC disks and present nanostructures with a typical width of 250 nm that are spatially distributed in concentric rings with a periodicity of 400 nm.13 The length of the encoding pits, however, varies between 200 and 1000 nm. The typical structure of the encoding pits is schematically depicted in Fig. 1a (top). These encoding pits are used here as templates for forming SERS active substrates. In order to get access to the encoding pit layer a simple procedure was applied to separate the layers of a commercial HD DVD. The two sides of the disk can be carefully separated with a sharp knife (Fig. 1b) and the residual reflective metal film attached on the PC surface is subsequently cleaved off with scotch tape (Fig. 1c). Then a gold layer was sputter-coated on the previously cleaned PC substrates (Fig. 1d). The prepared metal coated samples were additionally cleaned by oxygen plasma treatment for five minutes to remove organic contaminations from the Au layer. Finally, the disks were cut into small pieces with a size of 5 mm × 5 mm.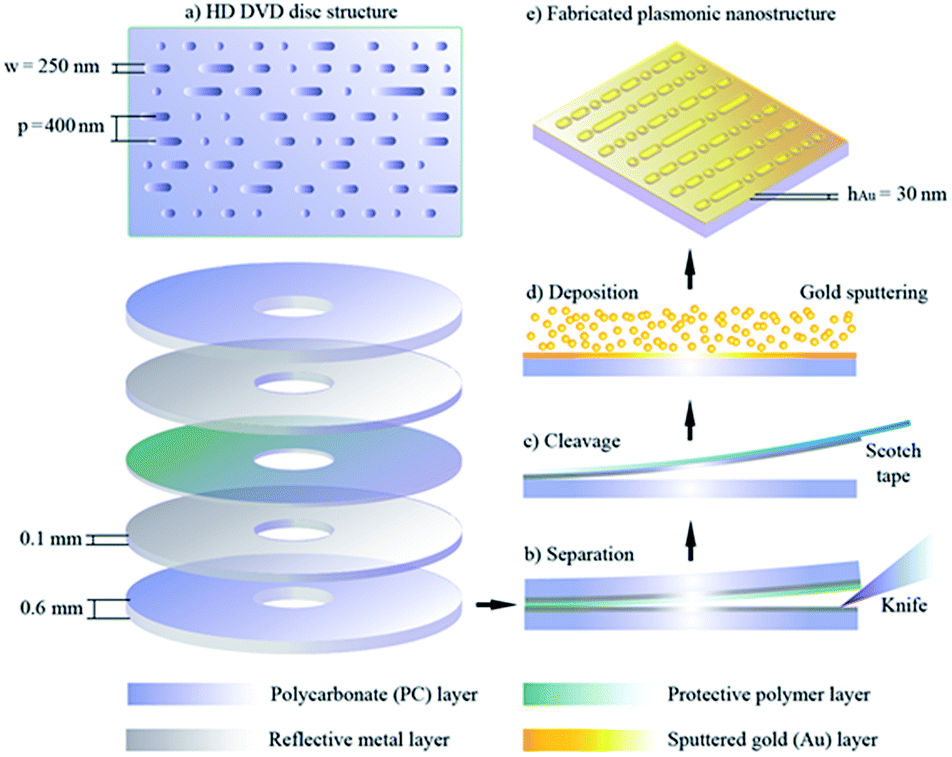 | ||
| Fig. 1 Architecture of HD DVD disks (a) and preparation steps to obtain the SERS substrates (b–e). The illustration is not drawn to scale. | ||
This procedure results in a gold coated substrate containing the inscribed encoding pits of the HD DVD. Fig. 2 depicts the corresponding SEM (Fig. 2a) and topographic AFM images (Fig. 2b) of the obtained gold coated HD DVD substrates. AFM measurements (Fig. 2b) revealed that the depth of the pits varies in the range between 35 and 80 nm due to tip convolution effects in particular for the short pits, but also due to possible shadowing effects during the sputter coating process of the Au layer. However, most of the pits are 60 nm in depth, which was assumed to be the average depth of the encoding pits (Fig. SI1†).
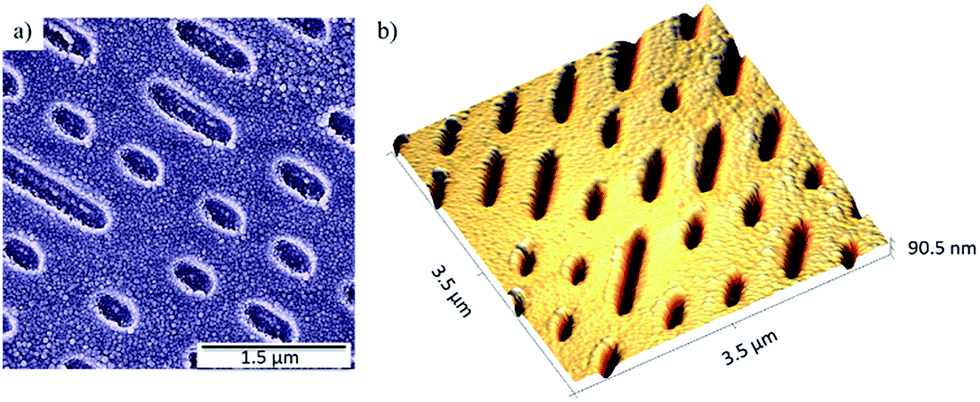 | ||
| Fig. 2 SEM (a) and AFM (b) topography images of the HD DVD encoding pit structure. | ||
In order to understand the plasmonic properties of the individual encoding pits finite element modelling (FEM, details of the method are summarized in the Experimental details) was carried out. Since the only non-constant structural feature is the lengths of the encoding pits different values were tested for the length of the pits. Fig. 3 represents the results obtained for a pit length l = 900 nm. In this model, the E-field component of the incident electromagnetic field was considered to be perpendicular to the pit length (TM- or p-polarization). These assumptions significantly reduced the computation time and allowed the study of several interesting plasmonic effects on the structures. In particular, a strong angular intensity modulation, which involves light diffraction, absorption in the metal layer and surface plasmon polariton (SPP) near-field enhancement of electromagnetic fields were found. Distinct features of the light intensity modulation at the as-prepared nanostructure can be related to the excitation of localized surface plasmon resonances (LSPR) concentrated on the rims of the encoding pit (Fig. 3a). This type of plasmons is generally observed for metal nanoparticles with a finite volume (spheres6,7,10,12,14 rods,12,14 bow-tie15 and rhomb-shaped6 nanoantennas) and also at the sharp voids and edges of different geometries (tips,16,17 nanoholes,18 rectangular nanowires19 and gratings20). In the case of the HD DVD-based nanostructures, LSPR modes can be induced within a wide range of wavelengths (λexc = 500 to 900 nm) regardless of the angle of incidence. However, the magnitude of the resulting near-field enhancement strongly depends on the frequency of the excitation source and its overlapping with the spectral position of the LSP resonances.
 | ||
| Fig. 3 Localized surface plasmons excited at the edges of a HD DVD encoding pit for different E-field directions ((a) TM- (λexc = 745 nm) and (b) TE-polarizations (λ = 648 nm)) and (c) their coupling with propagating surface plasmon polaritons within the inner volume of the structure (λ = 625 nm). The structure is shown as top view representation. | ||
The wavelength of LSP resonances can be controlled in general by the size and shape of nanostructures, the optical properties of the applied materials (metal and surrounding dielectric medium) as well as by the polarization of the incident light.21 In the case of incident p-polarized light (TM-polarization), which is depicted in Fig. 3a, a LSP resonance at a wavelength of λexc = 745 nm is excited on the HD DVD structures. In this case, the highest near-field enhancements can be found along the longer sides of the encoding pit. In contrast to this, surface plasmons localized at the opposite ends of the structure are induced by E-field components parallel to the x-axis (TE- or s-polarization), which is shown in Fig. 3b. These resonances are blue shifted, with a maximum at a wavelength of λexc = 648 nm and provide a higher field enhancement compared to the p-polarization. However, the resulting Raman signal of molecules is expected to be small in this configuration because of the smaller surface area coverage of the locally enhanced fields in the case of the s-polarized light. Therefore, for the subsequent studies p-polarized light was utilized for the excitation in order to maximize the area of structures, which exhibit strong plasmon near field enhancement. By this means, a larger number of absorbed molecules on the surface can contribute to the measured SERS signal. Additionally, the p-polarization plays a key role for exciting propagating surface plasmon polaritons (SPP; Fig. 3c), which contribute considerably to the studied light intensity modulation observed at the nanostructures under discussion. The induced SPPs traveling along the surface of the nanostructure lead to an enhancement of the electromagnetic field (Fig. 3c) and, consequently, an increase of the intensity of the collected Raman scattering signals is expected. For the excitation of the SPP modes the following parameters play a crucial role: (i) the excitation wavelength λexc = 2π/k0 (where k0 = ω/c is a light wavevector in free space), (ii) the grating periodicity p, (iii) the optical properties of applied dielectric material nd and (iv) the angle of incidence θ. In Fig. 3c, an example of an optimal combination of these parameters is shown. Here, the coupling of the LSP and the SPP within the inner volume of the encoding pit of the HD DVD gold substrate, induced in air at normal incident light with a wavelength of λexc = 625 nm, is observed. Due to the typical the structural features of HD DVD disk (p = 400 nm), the Raman instrumentation wavelength utilized (λexc = 785 nm), and the used dielectrics (nd = nair = 1), some restrictions are imposed on the experimental parameters. Therefore, only the incident angle θ and the thickness of the applied Au layer can be adjusted to fulfil the phase-matching condition required for the SPP excitation. Since HD DVD disks can behave additionally as a diffraction grating due to the fixed periodicity of the encoding pits, the coupling of the incident light to the SPP wavevector via diffraction effects was taken into account in this work.
In order to investigate the influence of the metal coating thickness, the absorption, reflection and transmission angular dependence were taken into consideration. As observed in Fig. 4, the reflection spectrum features two resonance minima. These correspond to the excitation of two different propagating plasmon modes: the short-range SPP (SR-SPP or ab-mode – the first minimum at smaller angle) and the long-range SPP (LR-SPP or sb-mode – the second one at larger angle) modes,22 resulting in a SPP mode splitting. The described plasmon behavior is only typical for a thin metal layer and changes substantially for increasing layer thicknesses (Fig. 4a). In particular, when the thickness of the metal is sufficiently large (hAu > 60 nm in Fig. 4a), an asymmetrically bound mode disappears. Considering these observations, a gold layer with a thickness of 30 nm was chosen as the optimum conditions for the following experiments (Fig. 4b).
 | ||
| Fig. 4 The angular dependence of reflection R (a), absorption A, transmission T and normalized near-field enhancement |E|/|Emax| for a gold layer of 30 nm thickness deposited on a HD DVD substrate (b). The observed reflectance minima splitting is caused by the thickness of the metal film. Particularly, thinner layers cause sharper dips in the reflectance spectra where bulk metal films (hAu > 60 nm) show a single LR-SPP minimum in the reflection spectrum. | ||
Additionally, numerical simulations were conducted to investigate the influence of the oblique incident angle on the substrate's performance. The structure of the induced propagating plasmon modes are depicted in Fig. 5. These modes have different dispersion characteristics depending on the field-distribution of the SPPs excited at the two conductor–isolator interfaces (air–gold and gold–polycarbonate). In particular, when the metal thickness is sufficiently thin (in our case 30 nm) and the difference of the dielectric refractive indices is relatively small (nΔ = nPC − nair = 0.57), the plasmons excited above (in the air) and below (in the PC) the metal film will couple, resulting in two bound supermodes: the asymmetric bound ab- and symmetric bound sb-modes. They are classified with respect to their magnetic field component Hx across the structure, which has an asymmetric (“+/−” or “−/+” in Fig. 5c) or symmetric (“+/+” or “−/−” in Fig. 5d) spatial surface charge distribution on top and bottom of the gold film. The symmetric sb-bound mode shows small confinement of excited free electrons (Fig. 5d) and, as a result, a larger propagation length being commonly referred to as long-range SPP. In contrast to LR-SPP, the asymmetric ab-plasmon mode propagates only short distances (short-range SPP) due to a stronger confinement of coherently oscillating electrons on the metal surface (Fig. 5c).
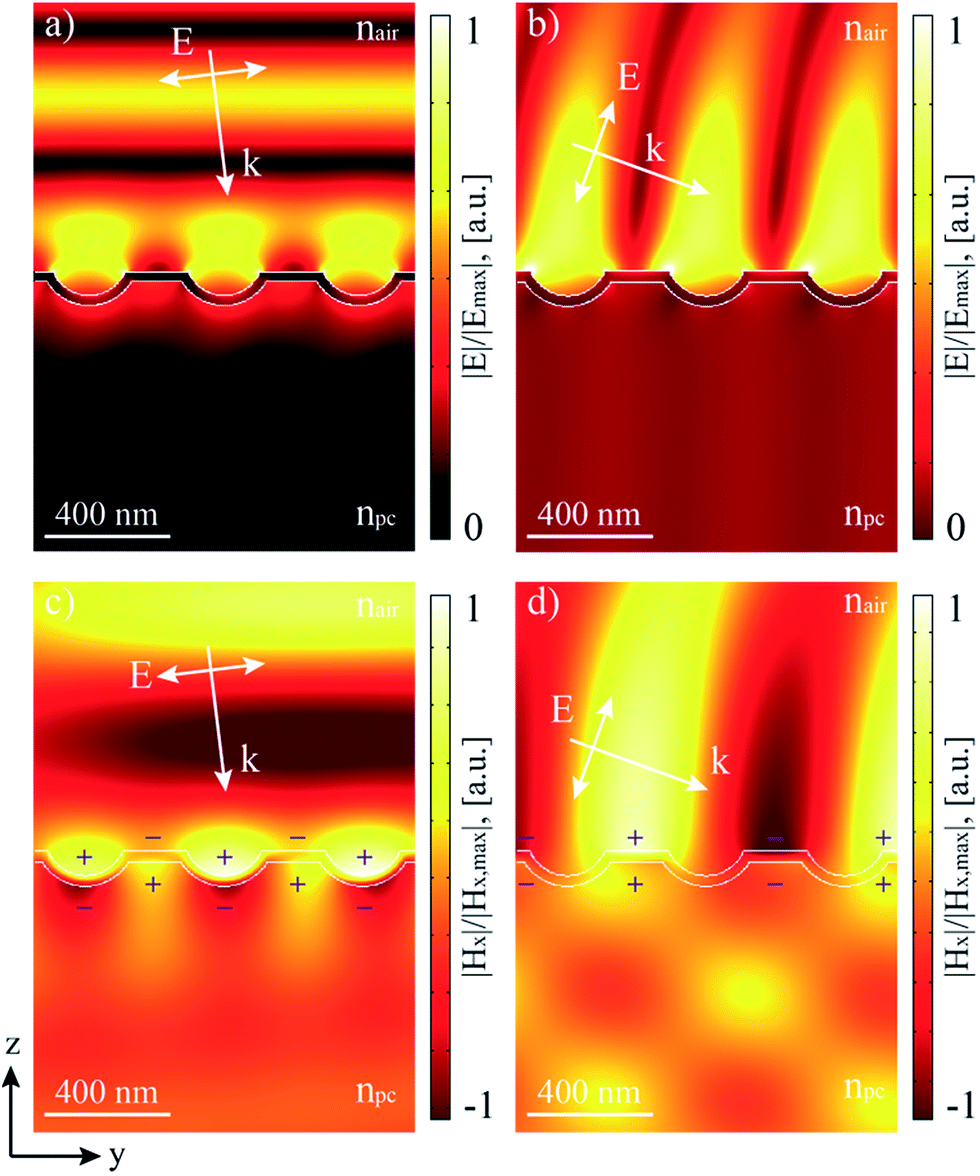 | ||
| Fig. 5 Electric field distribution of surface plasmon modes excited at the HD DVD plasmonic nanostructure with a wavelength of 785 nm and the critical angles of 7° (a) and 69° (b) which correspond to short-range (SR) and long-range (LR) SPPs, respectively. These two plasmon types are differentiated with respect to their magnetic field component Hx ((c) and (d)) where SR-SPP and LR-SPP show an asymmetric (“+/−” or “−/+” in (c)) and a symmetric (+/+ or “−/−” in (d)) distribution of surface charges, respectively. The structure is shown from the side view. | ||
The predicted angular dependence of the SERS signals under optimized illumination conditions on the HD DVD substrates was experimentally investigated by utilizing retinol (also known as vitamin A (Fig. SI2†)) as analyte (Fig. 6). In order to demonstrate the effect, the angle of incidence, measured between the excitation beam and the substrate was gradually increased from 0 to 20° in steps of 2°. The obtained Raman fingerprint information is depicted in Fig. 6a. For a better visualization, Fig. 6c depicts the peak area of the retinol marker mode at 1565 cm−1 (assigned to the C![[double bond, length as m-dash]](https://www.rsc.org/images/entities/char_e001.gif) C stretching vibration of the polyene chain of the molecule23), estimated by the Simpson's rule as function of the angle of incidence. These results fit to the numerical calculations for small incident angles and support the formation of the predicted supermodes. Deviations of the theoretical and experimental data can be expected. For larger incident angles the model fails since scattering occurs that is not sufficiently corrected by the applied model. Moreover, since for the calculation an idealized encoding pit geometry was chosen, additional deviations arise. In reality the encoding pit lengths vary between 200 and 1000 nm and there is also a slightly non-uniform depth of the features observed. Furthermore, the grain size might vary across the surface of the obtained substrates (e.g., the walls and the inner volume of the pits) due to the sputtering process and could influence the SERS signal enhancement. These parameters are not considered in the theoretical models. Thus, only a qualitative verification of the plasmon coupling can be performed. Based on the angle dependent SERS measurements, an optimized incident angle of 4° was applied for all further SERS investigations.
C stretching vibration of the polyene chain of the molecule23), estimated by the Simpson's rule as function of the angle of incidence. These results fit to the numerical calculations for small incident angles and support the formation of the predicted supermodes. Deviations of the theoretical and experimental data can be expected. For larger incident angles the model fails since scattering occurs that is not sufficiently corrected by the applied model. Moreover, since for the calculation an idealized encoding pit geometry was chosen, additional deviations arise. In reality the encoding pit lengths vary between 200 and 1000 nm and there is also a slightly non-uniform depth of the features observed. Furthermore, the grain size might vary across the surface of the obtained substrates (e.g., the walls and the inner volume of the pits) due to the sputtering process and could influence the SERS signal enhancement. These parameters are not considered in the theoretical models. Thus, only a qualitative verification of the plasmon coupling can be performed. Based on the angle dependent SERS measurements, an optimized incident angle of 4° was applied for all further SERS investigations.
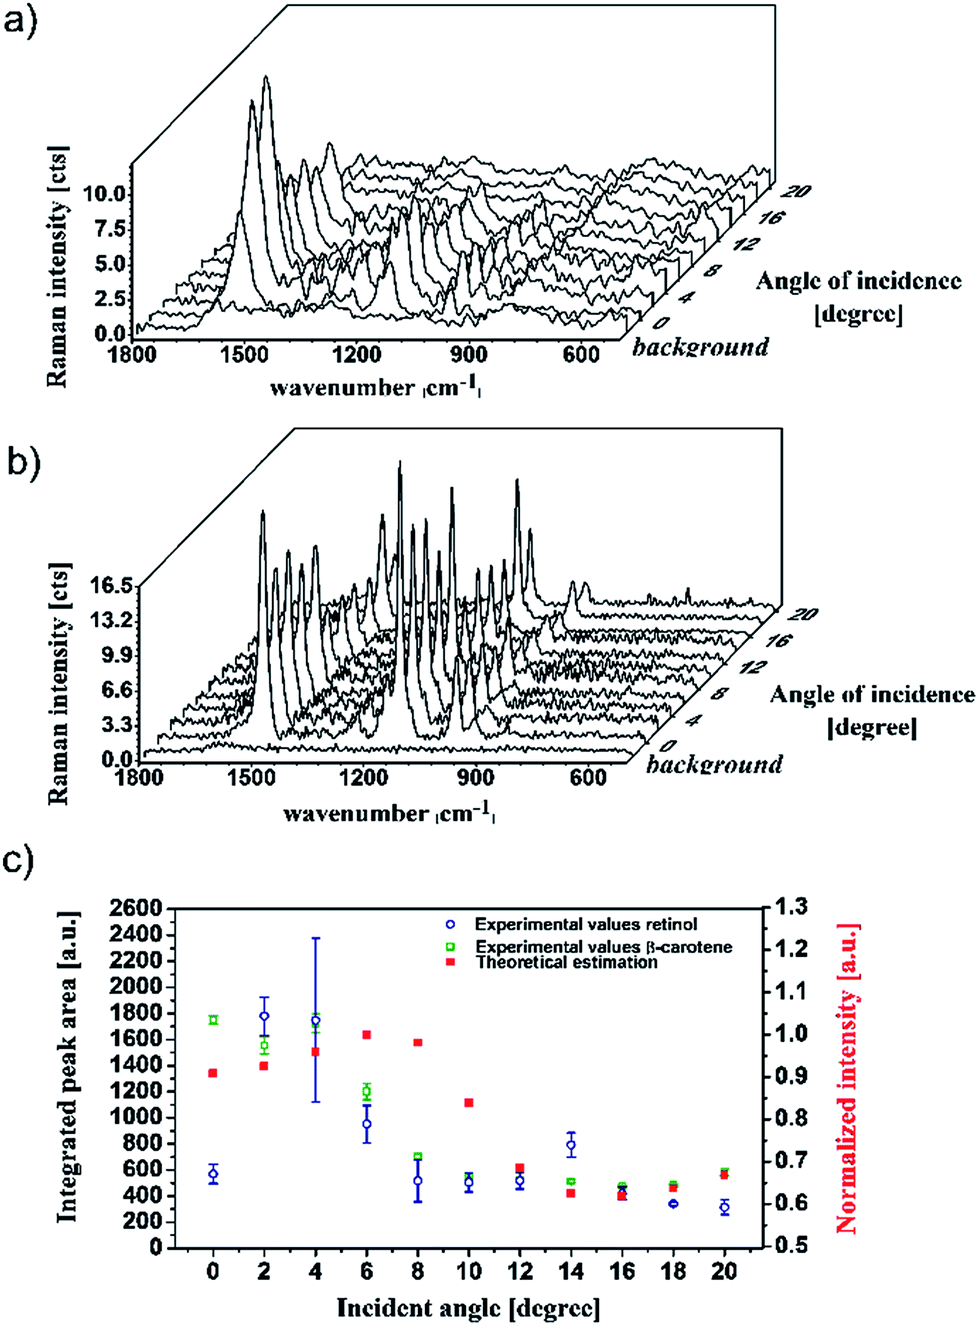 | ||
| Fig. 6 SERS spectra of retinol (a) and β-carotene (b) as function of the angle of incidence. Integrated peak area of the 1569 cm−1 band (retinol) and the 1533 cm−1 band (β-carotene) as function of the angle between the incident beam and the substrate (c). Please note that the presented measured data include the standard error of the mean of the obtained experimental values. | ||
To confirm these optimized conditions, additionally experiments employing the pro-vitamin A (β-carotene) (Fig. SI2†) were conducted (Fig. 6b).24 β-Carotene plays an important role in the metabolism both as an antioxidant, leading to a reduced risk of cancer or bone calcification, and as a vitamin A precursor.
Reference Raman spectra of both analytes were recorded at an excitation wavelength of 785 nm and are presented in Fig. 7. The extinction spectra of the two analytes (Fig. SI2†) exclude that resonance Raman effects are contributing to the obtained spectra. The observed Raman bands at 1521 cm−1 for the β-carotene spectra25 and at 1584 cm−1 for the retinol spectra23 can be assigned to the CC stretching vibrations of the polyene chain. The observed shift in the peak positions can be explained by the difference in the length of the conjugated π-electron system of the two molecules.26 A complete band assignment of the two molecules can be found elsewhere.23,25
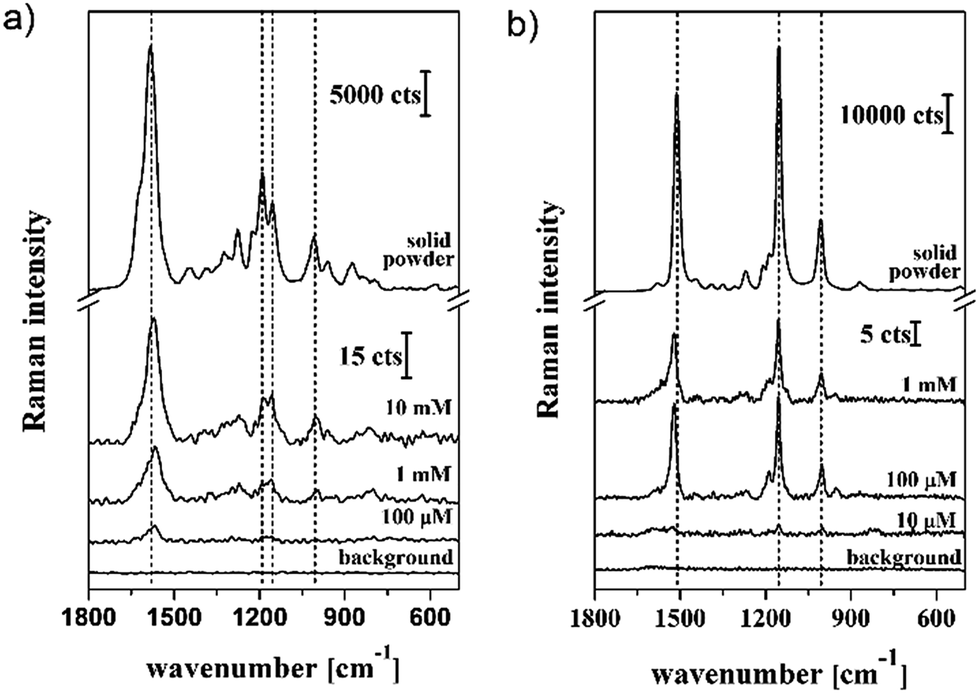 | ||
| Fig. 7 Raman spectra measurement on powder and concentration dependence of the SERS signal of the solutions with different concentrations of retinol (a) and β-carotene (b). | ||
SERS spectra of different concentrations of retinol and β-carotene were recorded on gold-coated HD DVD substrates and compared with the obtained Raman reference spectra (Fig. 7).
By comparison of the reference Raman spectra with the SERS fingerprint a shift of the CC stretching vibrations for both analytes (12 cm−1 to higher wavenumber for β-carotene and 19 cm−1 to lower wavenumbers for retinol) was reproducibly observed for the SERS measurements as compared to the Raman ones. The shift of the peak position of the CC vibrational mode might be a consequence of the charge transfer between the analyte molecule and the metallic surface. However, these would lead to a reduction of the electron density of the molecule, which would cause a down-shift of the peak position. This would explain the down-shifting observed in the case of retinol. However, the up-shifting of the peak position in the case of β-carotene cannot be fully explained by the electron withdrawing character of the C9H15 group, as the electron displacement within the molecule is also present under normal conditions, i.e., for the Raman measurements. A detailed investigation of the shift in peak positions is beyond this study and will be addressed in further research.
Additionally, it was found that the detected quantities of both analytes are related to the relevant range to be detected in food industry. According to the European Union (EU) regulations27 both analytes are admitted in food as quantum satis. Nevertheless, in the case of β-carotene a maximum permitted content in sausages of 37 μM kg−1 (EU no 1129/2011) is permitted, which is in the range of the tested values. Considering this, it is expected that the detection of the two analytes in food matrixes is possible by combining a food extraction protocol with the presented SERS measurement procedure and a solid analytical tool for reliable, rapid data analysis. Moreover, by mathematically designing the pit structure embedded on the HD DVD structure, the performance of the introduced SERS-active substrate would further increase.
Experimental
FEM simulations of surface plasmons
In order to define the optimal resonance conditions for the surface plasmon excitation of the nanostructure finite-element modelling (FEM) method was employed. The commercially available FEM modelling package COMSOL Multiphysics 4.3a with radio frequency (RF) module was used. The calculations were performed within a single 3D unit cell, which encloses the reconstructed geometry of the encoding pit with dimensions as determined by SEM/AFM measurements (w = 250 nm, v = 60 nm, l = 900 nm). The applied refractive indices of air and PC were nair = 1 and nPC = 1.57,28 respectively. The complex, frequency-dependent, relative permittivity of gold (sputtered metal film) εAu was interpolated from the reference literature.29 For the oblique incident angles Floquet periodic boundary conditions (PBC) were applied in x- and y-directions to reproduce the infinite array of the encoding pits with a HD DVD periodicity of p = 400 nm (track pitch length). Perfectly matched layers (PML) were set in ±z direction (the direction of light propagation under normal incidence) to absorb the electromagnetic field components reflected or scattered from the boundaries. Reflection (R) and transmission (T) were defined by integrating the reflected and transmitted power over the planes above and below the nanostructure, respectively. Light absorption (A) in gold was calculated by integrating the total power dissipation (Q) within the volume of the metal film. All the coefficients (A, R, T) were normalized to the incident power (P0). Surface plasmon enhancement factors were calculated by taking the ratio |E|/|E0| for the electric field (E-field) and |E|2/|E0|2 for the intensity (I), where E is a computed electric field and E0 is the initial field. The obtained SPP enhancement was normalized to the maximum values.Chemicals and reagents
All reagents were of analytical or HPLC reagent grade. Retinol (>95% pure) and β-carotene (>95% pure) were purchased from Sigma Aldrich (Steinheim, Germany). n-Hexane (>99% pure) and ethanol was purchased from Carl Roth (Karlsruhe, Germany). Stock solutions of 1 mM concentration of both retinol and β-carotene were prepared by dissolving the appropriate powder quantities in n-hexane. They were further diluted to 100 μM, 10 μM and 1 μM.HD DVD disk (Hitachi video) was ordered from https://www.Amazon.co.uk. The structural characterization of the fabricated nanostructures was performed by scanning electron microscopy (SEM, Gemini 1530 LEO field emission microscope) and an atomic force microscopy (AFM, NTegra Aura (NT-MDT)).
Spectroscopic measurements
The extinction spectra of the analytes were recorded with a Jasco V650 diode-array spectrophotometer.The Raman measurements were performed using a commercially available WITec confocal Raman system (WITec GmbH, Ulm, Germany) equipped with a 785 nm laser. The reference Raman spectra were recorded employing solid substances. For the reference Raman spectra of retinol and β-carotene the excitation wavelength was 785 nm, the laser power at the surface of the sample was 80 mW and the spectra are recorded within 1 s with 10 accumulations.
For the angle-dependent SERS measurements, the substrates were incubated in 1 mM aqueous solutions of retinol and β-carotene for 30 min and finally dried in an Ar stream. Afterwards the substrate was fixed on a 25 × 25 metric goniometer with a traveling distance of 40 degrees (LASER 2000, Wessling, Germany). The angle between the incident beam and the substrate was varied from 0 to 20 degrees and SERS measurements were performed every two degrees. The excitation wavelength was 785 nm. The light was focused via a 10× objective (NA 0.2) onto the sample and the Raman scattered light was collected with the same microscope objective. Line scans with 100 point measurements were recorded with an integration time of 0.5 s per point. The power at the surface of the sample was adjusted to 1 mW.
Finally, SERS spectra were recorded by applying nanostructured arrays incubated in 100 μM, 10 μM, 1 mM and 10 mM aqueous solutions of these analytes. The angle of incidence was adjusted to 4 degrees. Line scans were recorded with 100 point measurements and an integration time of 0.5 s per point. The measurements were performed utilizing a 100× objective (NA 0.75).
All presented spectra have been background corrected. For the data analysis RStudio 2.1 and Origin 8.5 were used.
Conclusions
We demonstrated the fabrication of highly sensitive SERS substrates based on commercially available HD DVDs. These provide highly interesting structures which show beneficial and promising plasmonic effects. As such, the formation of supermodes under optimized illumination conditions were predicted and experimentally verified. The HD DVD based SERS substrates have been utilized in a first application to trace vitamin A and β-carotene.The main advantage of the utilized approach to fabricate SERS substrates based on this mass-market product is certainly the low price and the excellent quality of the encoding pit structures that is molded into the PC support of commercial HD DVDs. Nevertheless, further studies should address the most suitable encoding pit structures to achieve the highest enhancement factors possible (in particular, optimization of the pit length). In the present study no control over this parameter was possible and an averaging over hundreds of different pit geometries took place. Therefore, based on simulations the optimum pit geometry should be predicted and engraved into an HD DVD support.
Acknowledgements
Funding of research projects “QuantiSERS” (03IPT513A) and “Jenaer Biochip Initiative 2.0” (03IPT513Y) within the framework “InnoProfile Transfer – Unternehmen Region“ the Federal Ministry of Education and Research, Germany (BMBF) is gratefully acknowledged. The studies were additionally supported by the Abbe School of Photonics, Jena and “PhoNa (Photonic Nanomaterials)” (03IS2101A) granted by the German Federal Ministry of Education and Research. PD Dr M. Westermann and his research group, Electron Microscopy Center of the University Hospital Jena, Germany, is gratefully acknowledged for providing the equipment used for sputtering and the SEM investigations.Notes and references
- P. Matousek and N. Stone, J. Biophotonics, 2013, 6, 7–19 CrossRef CAS PubMed; K. M. Khan, H. Krishna, S. K. Majumder, K. D. Rao and P. K. Gupta, J. Biophotonics, 2014, 7, 77–85 CrossRef PubMed; J. J. Anders, H. Moges, X. Wu, I. D. Erbele, S. L. Alberico, E. K. Saidu, J. T. Smith and B. A. Pryor, Lasers Surg. Med., 2014, 46, 34–45 CrossRef PubMed; S. Marubashi, H. Nagano, S. Kobayashi, H. Eguchi, Y. Takeda, M. Tanemura, K. Umeshita, M. Monden, Y. Doki and M. Mori, J. Clin. Pharmacol, 2010, 50, 705–709 CrossRef PubMed.
- I. J. Hidi, S. Mühlig, M. Jahn, F. Liebold, D. Cialla, K. Weber and J. Popp, Anal. Methods, 2014, 6, 3943–3947 RSC.
- J. Płonka, A. Toczek and V. Tomczyk, Food Anal. Methods, 2012, 5, 1167–1176 CrossRef CAS; B. Gleize, M. Steib, M. André and E. Reboul, Food Chem., 2012, 134, 2560–2564 CrossRef PubMed; V. Peksa, M. Jahn, L. Štolcová, V. Schulz, J. Procházka, K. Weber, D. Cialla-May and J. Popp, Anal. Chem., 2015, 87, 2840–2844 CrossRef PubMed.
- M. Jahn, S. Patze, T. Bocklitz, K. Weber, D. Cialla-May and J. Popp, Anal. Chim. Acta, 2015, 860, 43–50 CrossRef CAS PubMed.
- T. Ito and S. Okazaki, Nature, 2000, 406, 1027–1031 CrossRef CAS PubMed; M. Baia, L. Baia, S. Astilean and J. Popp, Appl. Phys. Lett., 2006, 88, 143121 CrossRef; P. Binkowska, B. Cord and P. Wohlfahrt, Microsyst. Technol., 2007, 13, 139–144 CrossRef; G. Tosello, H. N. Hansen and F. Marinello, CIRP Ann., 2010, 59, 563–568 CrossRef; K. H. Hering, R. Moller, W. Fritzsche and J. Popp, ChemPhysChem, 2008, 9, 867–872 CrossRef PubMed; T. Dörfer, M. Schmitt and J. Popp, J. Raman Spectrosc., 2007, 38, 1379–1382 CrossRef; K. Strelau, R. Kretschmer, R. Möller, W. Fritzsche and J. Popp, Anal. Bioanal. Chem., 2010, 396, 1381–1384 CrossRef PubMed; E. C. Le Ru and P. G. Etchegoin, in Principles of Surface-Enhanced Raman Spectroscopy, ed. E. C. Ru and P. G. Etchegoin, Elsevier, Amsterdam, 2009, pp. 185–264 CrossRef PubMed; X. Guo, J. Biophotonics, 2012, 5, 483–501 CrossRef PubMed.
- D. Cialla, A. Marz, R. Bohme, F. Theil, K. Weber, M. Schmitt and J. Popp, Anal. Bioanal. Chem., 2012, 403, 27–54 CrossRef CAS PubMed.
- J. F. Li, Y. F. Huang, Y. Ding, Z. L. Yang, S. B. Li, X. S. Zhou, F. R. Fan, W. Zhang, Z. Y. Zhou, Y. Wu de, B. Ren, Z. L. Wang and Z. Q. Tian, Nature, 2010, 464, 392–395 CrossRef CAS PubMed.
- J. R. Minkel, Sci. Am., 2005, 292, 30 CAS.
- J. P. Christ and A. P. Slowak, in Kommunikations-, Informations- und Medienzentrum der, Universität Hohenheim, Hohenheim, 2010 Search PubMed.
- Z. Yang, Z. Niu, Y. Lu, Z. Hu and C. C. Han, Angew. Chem., Int. Ed., 2003, 42, 1943–1945 CrossRef CAS PubMed; E. A. Coronado, E. R. Encina and F. D. Stefani, Nanoscale, 2011, 3, 4042–4059 RSC.
- M. Fischetti, Sci. Am., 2007, 297, 98–99 CrossRef PubMed.
- K. E. Fong and L. Y. L. Yung, Nanoscale, 2013, 5, 12043–12071 RSC.
- T. S. Milster, Opt. Photonics News, 2005, 16, 28–33 CrossRef.
- E. Hutter and J. H. Fendler, Adv. Mater., 2004, 16, 1685–1706 CrossRef CAS.
- Z. J. Coppens, W. Li, D. G. Walker and J. G. Valentine, Nano Lett., 2013, 13, 1023–1028 CrossRef CAS PubMed; T. Hanke, J. Cesar, V. Knittel, A. Trügler, U. Hohenester, A. Leitenstofer and R. Bratschitsch, Nano Lett., 2012, 12, 992–996 CrossRef PubMed.
- L. Novotny and N. van Hulst, Nat. Photonics, 2011, 5, 83–90 CrossRef CAS.
- M. Potara, A.-M. Gabudean and S. Astilean, J. Mater. Chem., 2011, 21, 3625–3633 RSC; D. K. Gramotnev and S. I. Bozhevolnyi, Nat. Photonics, 2010, 4, 83–91 CrossRef CAS.
- C. A. Barrios, V. Canalejas-Tejero, S. Herranz, M. C. Moreno-Bondi, M. Avella-Oliver, R. Puchades and A. Maquieira, Plasmonics, 2014, 9, 645–649 CrossRef CAS; R. Gordon, D. Sinton, K. L. Kavanagh and A. G. Brolo, Acc. Chem. Res., 2008, 41, 1049–1057 CrossRef PubMed.
- W. Tang, D. B. Chase and J. F. Rabolt, Anal. Chem., 2013, 85, 10702–10709 CrossRef CAS PubMed; D. Kong, J. C. Randel, H. Peng, J. J. Cha, S. Meister, K. Lai, Y. Chen, Z.-X. Shen, H. C. Manoharan and Y. Cui, Nano Lett., 2009, 10, 329–333 CrossRef PubMed.
- D. Cialla, K. Weber, R. Böhme, U. Hubner, H. Schneidewind, M. Zeisberger, R. Mattheis, R. Moller and J. Popp, Beilstein J. Nanotechnol., 2011, 2, 501–508 CrossRef CAS PubMed; Z. Chen, I. R. Hooper and J. R. Sambles, Phys. Rev. B: Condens. Matter Mater. Phys., 2008, 77, 161405 CrossRef; Z. Chen, I. R. Hooper and J. R. Sambles, J. Opt. A: Pure Appl. Opt., 2008, 10, 15007 CrossRef.
- W. L. Barnes, T. W. Preist, S. C. Kitson and J. R. Sambles, Phys. Rev. B: Condens. Matter Mater. Phys., 1996, 54, 6227–6244 CrossRef CAS; W. L. Barnes, A. Dereux and T. W. Ebbesen, Nature, 2003, 424, 824–830 CrossRef PubMed; K. A. Willets and R. P. Van Duyne, Annu. Rev. Phys. Chem., 2007, 267–297 CrossRef PubMed; I. R. Hooper and J. R. Sambles, Phys. Rev. B: Condens. Matter Mater. Phys., 2004, 70, 45421 CrossRef.
- P. Berini, Adv. Opt. Photonics, 2009, 1, 484–588 CrossRef CAS.
- D. Gill, M. E. Heyde and L. Rimai, J. Am. Chem. Soc., 1971, 93, 6288–6289 CrossRef CAS PubMed; D. Manor, R. Callender and N. Noy, Eur. J. Biochem., 1993, 213, 413–418 CrossRef PubMed.
- J. Hirschberg, Curr. Opin. Plant Biol., 2001, 4, 210–218 CrossRef CAS PubMed.
- A. G. Gonzálvez, N. L. Martínez, H. H. Telle and Á. G. Ureña, Chem. Phys. Lett., 2013, 559, 26–29 CrossRef CAS; J. Trebolazabala, M. Maguregui, H. Morillas, A. Diego and J. M. Madariaga, Spectrochim. Acta, Part A, 2013, 105, 391–399 CrossRef PubMed; K. Sokolov, P. Khodorchenko, A. Petukhov, I. Nabiev, G. Chumanov and T. M. Cotton, Appl. Spectrosc., 1993, 47, 515–522 CrossRef.
- G.-N. Qu, S. Li, C.-L. Sun, T.-Y. Liu, Y.-L. Wu, S. Sun, X.-N. Shan, Z.-W. Men, W. Chen, Z.-W. Li and S.-Q. Gao, Chin. Phys. B, 2012, 21, 127802 CrossRef.
- https://webgate.ec.europa.eu/sanco_foods/main/?event=display, last access 08/17/2015.
- S. N. Kasarova, N. G. Sultanova, C. D. Ivanov and I. D. Nikolov, Opt. Mater., 2007, 29, 1481–1490 CrossRef CAS.
- P. B. Johnson and R. W. Christy, Phys. Rev. B: Solid State, 1972, 6, 4370–4379 CrossRef CAS.
Footnotes |
| † Electronic supplementary information (ESI) available. See DOI: 10.1039/c6ra06029c |
| ‡ Both authors contributed equally. |
| This journal is © The Royal Society of Chemistry 2016 |