Amorphous silica nanoparticle-induced perturbation of cholesterol homeostasis as a function of surface area highlights safe-by-design implementation: an integrated multi-OMICS analysis

Nivedita Chatterjeea, Jisu Yanga, Rambabu Atlurib, Wonwoong Leec, Jongki Hongc and Jinhee Choi*a
aSchool of Environmental Engineering, Graduate School of Energy and Environmental System Engineering, University of Seoul, 163 Siripdaero, Dongdaemun-gu, Seoul 130-743, Korea. E-mail: jinhchoi@uos.ac.kr; Fax: +82-2-6490-2859; Tel: +82-2-6490-2869
bNational Research Centre for the Working Environment, Copenhagen, DK-2100, Denmark
cCollege of Pharmacy, Kyung Hee Unviversity, Seoul 130-761, South Korea

Received 7th March 2016 , Accepted 21st June 2016

First published on 29th June 2016


Abstract

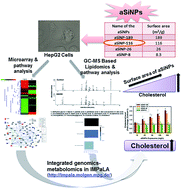
To close the knowledge gap between the wide application of amorphous silica nanoparticles (aSiNPs) and their health impact, the present study endeavored to investigate the molecular mechanisms involved in aSiNPs-mediated hepatotoxicity with a systems toxicology approach and how it is related to the physico–chemical properties of aSiNPs. To this end, we used four types of aSiNPs with different surface areas: aSiNP-116 (surface area: 116 m2 g−1), aSiNP-189 (surface area: 189 m2 g−1), aSiNP-26 (surface area: 26 m2 g−1) and aSiNP-8 (surface area: 8.3 m2 g−1); we also used the human hepatoma (HepG2) cell line as a model system. We applied multi-OMICS (DNA microarray based transcriptomics and GC-MS based lipidomics) followed by bioinformatics analysis in aSiNP-116 treated HepG2 cells. The perturbations of steroid-cholesterol biosynthesis were revealed by KEGG (with significantly altered genes) and IMPaLA (with integrated significantly altered genes and metabolites) pathway analysis. Furthermore, in corroboration with in silico analysis, the biochemical tests exhibited a concentration dependent increase in total cholesterol levels due to aSiNP-116 treatment. In a subsequent step, the hypothesis derived for aSiNP-116 was further tested for cells exposed to other aSiNPs (aSiNP-189, aSiNP-26 and aSiNP-8) with GC-MS based lipidomics as well as biochemical tests. The alterations in cholesterol biosynthesis were found to be directly proportional with the surface area of the aSiNPs, i.e., the larger the surface area, the higher the cholesterol level. Taken together, perturbation of cholesterol biosynthesis as a function of surface area was found to be a principal mode-of-action of aSiNPs exposure, which necessitates a safe-by-design approach for its biological applications.

Background

The wide applications of synthetically manufactured amorphous silica nanoparticles (aSiNPs) range from daily life uses (i.e. food packaging, food additives, plastics, toothpaste, and cosmetics) to diagnostic and biomedical fields (i.e. bioimaging, drug and gene delivery, and cancer therapy).1–3 In specific, aSiNPs are one of the most used nanomaterials in food products and are commercially available food additives (i.e. E551, Aerosil 200F or Aerosil 380F, which are used as anticaking agents, as carriers for fragrances/flavors in foods).4–6 Therefore, the large scale production and use of aSiNPs has increased human health concerns related to both consumer and occupational exposure.7 Even though significant efforts have been made to address the toxicity issues of aSiNPs,6–10 a knowledge gap was identified for the molecular mechanism of toxicity and the risk assessment of aSiNPs in food products,6,11 in particular, reports that aSiNPs are hepatotoxicants.12

The safe-by-design approach is mainly based on five principles, including alternative materials and surface functionalization to change physico–chemical and biological properties. Various approaches and tools can be used to achieve the final goal of safer-by-design nanomaterials for low impact on worker and environmental health.13

The system toxicology approach using multi-OMICS profiling techniques (transcriptomics, proteomics and metabolomics) has proven to be a robust tool for unraveling the complex molecular machinery underlying various physiological and pathophysiological processes; it has been successfully utilized in various fields, including stress biology and toxicology.14,15 Transcriptomic studies cover the entire human genome and identify the genes that are up or downregulated from the simultaneous expression of up to thousands of genes under certain conditions. Metabolomics, a snapshot of the physiological state, usually reflects combined effects of multiple upstream factors, such as the transcriptome, the proteome and the nutritional environment. The integration of these OMICS technologies has the potential to reveal a much more detailed view of cellular homeostasis and the regulatory network than when used individually.15,16

To narrow the knowledge gap and perform risk assessment related to the use of aSiNPs as food additives, as well as the molecular regulatory network of the interaction of aSiNPs with liver cells, four types of aSiNPs (aSiNP-189, aSiNP-116, aSiNP-26 and aSiNP-8) with different surface areas were used as representative compounds and the human hepatoma (HepG2) cell line was used as a model system. We sequentially applied DNA microarrays and targeted lipidomics with GC-MS followed by bioinformatics analysis (individual as well as integrated pathway analysis) in aSiNP-116 exposed HepG2 cells. Furthermore, the in silico pathway analysis (integrated pathway analysis) was confirmed experimentally with the necessary biochemical tests. In addition, the outcome and hypothesis derived from aSiNP-116 were examined for three other types of aSiNPs (aSiNP-189, aSiNP-26 and aSiNP-8) with GC-MS based lipidomics, as well as with biochemical tests. Based on the results, some considerations of safe-by-design implementation were suggested for the sustainable restoration of aSiNPs applications.

Method

Synthesis and characterization of aSiNPs

In the current study, four types of amorphous silica nanoparticles were used; some of these were commercially available and others were made in-house. aSiNP-189 was obtained from NANoREG (http://www.nanoreg.eu/; NM200), while aSiNP-116 was purchased from Sigma (#381276, Sigma-Aldrich). The two other samples, aSiNP-26 and aSiNP-8, were prepared in-house based on the Stöber method17 using tetraethyl orthosilicate (TEOS) as the silica source.

Scanning electron microscopy (SEM) was performed on a FEI Quanta 200 microscope operating at an accelerating voltage of 1–2 kV and at magnifications between 20[thin space (1/6-em)]000× and 50[thin space (1/6-em)]000× on samples with no coating.

Nitrogen isotherms18 (18) were measured at liquid nitrogen temperature (−196 °C) using a Micromeritics TriStar II volumetric adsorption analyzer (Micromeritics Instrument Corporation, USA). Before the measurements, the samples were degassed for 6 h at 200 °C under a flow of nitrogen gas. The Brunauer–Emmett–Teller (BET)19 equation was used to calculate the surface areas at the relative pressures (P/P0) between 0.05 and 0.3.

The particle size distribution and zeta (ζ) potential of all the silica nanoparticles in MEM culture media were evaluated using a photal dynamic light scattering spectrometer (DLS) (DLS-7000, Otsuka Electronics Co Inc). The amorphous silica nanoparticles were dispersed in distilled water and sonicated for 30 minutes before the DLS measurements. The amorphous nature of the aSiNPs was determined by X-ray diffraction (XRD) at room temperature (Philips X'Pert PW3040/00).

Cell culture and aSiNPs treatment

HepG2 (human liver carcinoma cells) were cultured in MEM (GIBCO), supplemented with 10% (v/v) fetal bovine serum and 1% (v/v) antibiotics, at 37 °C in a 5% CO2 atmosphere. All aSiNPs were freshly prepared in cell culture medium (MEM) (1000 mg L−1) and were sonicated for 15 minutes before biological exposure. The appropriate amounts of aSiNPs were diluted in MEM to achieve the desired concentrations for the respective experiments.

Cytotoxicity and cell viability

The cytotoxicity and cell viability of aSiNP-116 were determined with an EZ-Cytox cell viability assay kit (Daeil Lab Service, Korea), as well as the trypan blue exclusion method as described in ref. 20. All the viabilities were measured in three biological replicates each with duplicates. The details are found in the ESI (Materials and methods section).

Total RNA extraction and quantitative real-time PCR (qRT-PCR)

Extraction of total RNA from aSiNP-116 treated cell samples (100 mg L−1 for 24 h), cDNA synthesis and real time PCR were performed as described previously.20 The details can be found in the ESI (Materials and methods section).

The primers were constructed (by Primer3plus) based on sequences available in NCBI and the qRT-PCR conditions were optimized (efficiency and sensitivity tests) for each primer prior to the experiment (ESI Table S1). The gene expressions were normalized using GAPDH and β-actin as housekeeping genes.

Microarray and global gene expression analysis

The microarray and global gene expressions were performed with extracted RNA from aSiNP-116 (100 mg L−1 for 24 h) cells and hybridized to the Affymetrix Gene Chip according to the manufacturer's instructions (http://www.affymetrix.com).20 The details can be found in the ESI (Materials and methods section). Data were deposited in the Gene Expression Omnibus (GSE51276).

Pathway and network analysis

Pathway analysis was performed by two approaches – first, with gene set enrichment analysis (GSEA) software using the complete set of gene expression data from the microarray experiments, and second, the KEGG pathway exploiting the DAVID database using the list of more than 1.5 fold DGE. The network analysis was carried out by Pathway Studio (Pathway Studio v 9.0 program, Ariadne Transcriptomics, Inc.).

GC-MS based lipid analysis

Targeted lipidomics experiments were carried out with all aSiNPs (aSiNP-116, aSiNP-189, aSiNP-26, aSiNP-8) treated cells (100 mg L−1 for 24 h) in an Agilent-6890N gas chromatograph (Palo Alto, CA, USA) with a DB-5MS capillary column (30 m × 0.25 m × 0.25 μm film, J&W Scientific, Folsom, CA, USA) coupled with an Agilent-5973 mass selective detector. The details, including sample preparations and statistical analysis, can be found in the ESI (Materials and methods section).

Metabolomics pathway analysis and integrated transcriptomics–metabolomics analysis

Metabolomics pathway analysis was performed using MetaboAnalyst 3.0 software (a web service for metabolomics data analysis)21 with the metabolites that displayed >1.5 fold changes upon treatment with aSiNPs. Integrated transcriptomics and metabolomics pathway analysis was carried out with the freely available IMPaLA (http://www.impala.molgen.mpg.de/) software16,22 with the microarray DGE (>1.5 fold), as well as significantly altered lipid metabolites (>1.5 fold) due to aSiNP-116 treatment.

Total cholesterol measurements

The total cholesterol measurements were performed with a colorimetric total cholesterol assay kit (Cell Biolabs Inc., Catalogue No: STA-384) following the manufacturer's instructions for all the aSiNPs (aSiNP-189, aSiNP-116, aSiNP-26, aSiNP-8) treated cells at different doses for 24 h (10, 25, 50, 100 and 200 mg L−1). The details can be found in the ESI (Materials and methods section).

Statistical analysis

The significance of differences among/between treatments was determined using one way analysis of variance (ANOVA) followed by post-hoc tests (Tukey, p < 0.05) in SPSS 12.0KO (SPSS Inc., Chicago, Il, USA); graphs were prepared using SigmaPlot (Version 12.0).

Results

Characterization of aSiNPs

The aSiNPs were well characterized to determine both their structural and textural properties. As shown in Fig. 1, election microscopy (EM) images of all four aSiNPs showed distinct differences in their particle sizes and aggregation sizes. The aSiNP-189 and aSiNP-116 samples appeared to be typical fumed silica type particles with large aggregates of primary particles. It is also clear that the particles are non-porous and have primary particle sizes between 20 and 50 nm. Scanning election microscopy images were recorded on the other two nanoparticles, such as aSiNP-26 and aSiNP-8; these showed mono-dispersed particles with average particle sizes of 110 nm and 250 nm, respectively.
image file: c6ra06006d-f1.tif
Fig. 1 Electron microscopy images of silica nanoparticles used in this work. Transmission electron microscopy (TEM) images of (a) aSiNP-189 and (b) aSiNP-116 and scanning electron microscopy (SEM) images of (c) aSiNP-26 and (d) aSiNP-8.

Apart from the dry particle size measurements, wet particle measurements were conducted in distilled water using Dynamic Light Scattering (DLS) and the results are shown in Table 1. The aggregation level seems to increase primarily for the aSiNP-189 and aSiNP-116 samples, to 397.5 and 202.6 nm, respectively.

Table 1 Characterization of aSiNPs
Name of the aSiNP Surface area (m2 g−1) DLS particle diameter (nm) Zeta potential (ζ) (mV)
aSiNP-189 189 397.5 −12.055
aSiNP-116 116 202.6 −10.02
aSiNP-26 26 118.9 −10.335
aSiNP-8 8.3 244.0 −9.7


The surface areas of the aSiNPs samples were analyzed by N2 absorption isotherms. The adsorption of nitrogen increases with relative pressure and the results exhibit type III isotherms, which is a typical characteristic of non-porous solids. The surface areas of all the samples are presented in Table 1. The NanoReg supplied sample (aSiNP-189) showed the highest surface area of 189 m2 g−1 among all the samples, and the order of aSiNPs with respect to the surface area was found to be aSiNP-189 > aSiNP-116 > aSiNP-26 > aSiNP-8. As per the product descriptions, both samples (aSiNP-189 and aSiNP-116) are of the fumed silica type and are the products of a pyrolysis process. The large surface areas could be the result of inter-particle porosity, as the primary particles form large aggregates. Unlike the commercial aSiNPs, the aSiNPs made in-house by a precipitation method showed low surface areas, indicative of their non-porous, amorphous structures.

The zeta potentials (ζ) of all aSiNPs (aSiNP-189, aSiNP-116, aSiNP-26, and aSiNP-8) are presented in Table 1. All the samples exhibited more or less similar ζ potential, following the same order as the surface area. The amorphous nature of aSiNP-116 was observed by X-ray diffraction (XRD) analysis (Fig. S1).

Viability and cytotoxicity mediated by aSiNP-116

Initially, the cytotoxicity and viability of HepG2 cells were evaluated at various concentrations of aSiNP-116 for 24 h. A dose dependent decrease in viability was not evident from the Ez-cytox assay or the trypan blue exclusion assay (Fig. S2A), only moderate cytotoxicity was manifested from doses of 100 mg L−1 (71% viability, p < 0.047) to 200 mg L−1 (60% viability, p < 0.033). Similarly, the aSiNP-116-induced time dependent increase in cytotoxicity at the dose of 100 mg L−1 (Fig. S2B) was found to be indistinct until 8 h of exposure; reasonable cytotoxicity was only displayed from 24 h (71% viability, p < 0.05) to 72 h (63% viability, p < 0.03).

The moderate cytotoxicity dose of 100 mg L−1 (71% viability) of aSiNP-116 at 24 h exposure was chosen for the global gene expression analysis as well as for the targeted lipidomics analysis.

aSiNP-116 induced differential gene expression profiling

The differential gene expression (DGE) of the normalized microarray (adjusted p-value < 0.05) analysis revealed 393 genes (163 genes upregulated and 230 genes downregulated) showing an induction or repression of more than 1.5 fold due to aSiNP-116 treatment. The hierarchical cluster analysis of genes with more than 1.5 fold change in expression is shown in Fig. S3 and the functional annotation clustering (DAVID; enrichment score > 3.00) is listed in Table S2. The highest functional annotation clustering (enrichment score: 4.49) was found for steroid, lipid, and cholesterol biosynthesis/metabolic processes (Table S2). A list of the selected genes with strong differential expression and their gene ontology analysis can be found in ESI Tables S3 and S4, respectively. The gene ontology (GO) analysis for aSiNP-116 treatment for the term biological process (Table S4) showed mainly steroid, cholesterol, and lipid biosynthesis, and oxidation–reduction.

Gene set enrichment analysis (GSEA) coupled with KEGG analysis (Table 2) showed that the deregulated pathways in aSiNP-116 treatment were mainly steroid biosynthesis, lipid and cholesterol biosynthesis, glutathione metabolism, and xenobiotic and drug metabolism. The main hub genes in the network analysis were found to be TNF, INS, IGF1, IL4, and NOS2 with more or less similar numbers of local connectivity (Fig. S4).

Table 2 Deregulated pathways (selected) analyzed with GSEA and KEGG based on microarray DGE (>1.5 fold) after aSiNP-116 exposure for 24 h
Term Count % p-Value
KEGG pathway analysis (with genes DEG > 1.5 fold)
Upregulated
Steroid biosynthesis 4 5.2 3.4 × 10⁻⁵
Terpenoid backbone biosynthesis 3 3.9 1.5 × 10⁻³
[thin space (1/6-em)]
Downregulated
Metabolism of xenobiotics by cytochrome P450 6 7.5 1.5 × 10⁻⁶
Drug metabolism 6 7.5 1.7 × 10⁻⁶
Glutathione metabolism 4 5.0 6.6 × 10⁻⁴
Glycerophospholipid metabolism 3 3.8 2.3 × 10⁻²

Name Overlap Percent overlap Overlapping entities p-Value
Selected pathways from gene set enrichment analysis (GSEA)
Response to estradiol stimulus 11 7 NOS2, CASP8, SRD5A1, PRL, OGG1, NCOA1, CYP19A1, PIK3R1, TFF1, RARA, NCOR2 2.14 × 10⁻¹⁴
Xenobiotic metabolic process 11 7 CYP19A1, HNF4A, GSTA1, CYP51A1, SULT1E1, GSTA2, GSTA5, AKR1C1, CYP24A1, ACSS2, GSTA3 4.22 × 10⁻¹⁴
Response to organic cyclic compounds 12 5 IL4, IGF1, CASP1, SRD5A1, PRL, CDK1, CCL5, SREBF1, CYP19A1, RELA, ITGA2, HMGCS1 1.69 × 10⁻¹³
Positive regulation of cell proliferation 12 2 TNF, IL4, IGF1, INS, HIF1A, PRL, JAK2, ITGB1, RELA, FOXM1, RARA, MVD 2.52 × 10⁻¹⁰
Steroid biosynthetic process 7 8 SRD5A1, CYP19A1, CYP51A1, MVD, AKR1C1, FDPS, HMGCS1 8.96 × 10⁻¹⁰
Response to hypoxia 9 3 TNF, NOS2, CASP1, HIF1A, RHOA, CCL2, BDNF, TLR2, ITGA2 3.60 × 10⁻⁹
Steroid metabolic process 7 5 SRD5A1, SREBF1, CYP19A1, SREBF2, SULT1E1, AKR1C1, CYP24A1 1.01 × 10⁻⁸
Lipid biosynthetic process 7 5 SREBF1, SREBF2, CYP51A1, MVD, FDPS, ACSS2, HMGCS1 1.59 × 10⁻⁸
Regulation of apoptosis 8 3 INS, CASP1, CASP8, HIF1A, DDIT3, SIRT1, CD3E, NME1 1.36 × 10⁻⁷
Toll signaling pathway 5 6 CDK1, NFKB1, TLR2, RELA, IRF3 1.03 × 10⁻⁶
Glutathione metabolic process 4 9 GSTA1, GSTA2, GSTA5, GSTA3 2.67 × 10⁻⁶
Cell-matrix adhesion 5 5 RHOA, FN1, ITGB1, ITGA2, ITGA3 3.12 × 10⁻⁶
Glutathione transferase activity 4 11 GSTA1, GSTA2, GSTA5, GSTA3 3.21 × 10⁻⁶
Response to DNA damage stimulus 7 2 SGK1, FOXO1, DDIT3, SIRT1, OGG1, H2AFX, PRKDC 6.09 × 10⁻⁶
Cellular response to mechanical stimulus 4 7 CASP1, CASP8, NFKB1, ITGB1 6.24 × 10⁻⁶
Glutathione metabolism 6 4 INS, GSTA1, GSTA2, GSTA5, ADH5, GSTA3 8.62 × 10⁻⁵


The validation of the changes in gene expression was selected based on microarray fold changes (>1.5 fold), as well as pathway analysis (such as SREBF1, SREBF2, CYP51A1, MVD, FDPS, ACSS2, HMGCS1, HMGCR, CDK1 and KCNJ10). The selected gene expression validations by qPCR displayed the same mode of deregulation (up/downregulation) but with a small shift in fold change from the differentially expressed genes (DEGs) of the microarray of aSiNP-116 exposed cells (Table S5).

Effects of all aSiNPs on targeted fatty acid and lipids analysis

The targeted lipidomics analysis, delineated by GC-MS spectra (Fig. S5), revealed that an overall upregulation of fatty acids and lipid metabolites was induced by aSiNPs, specifically by aSiNP-189 and aSiNP-116. Significant fold changes were observed in the cases of palmitic acid, oleic acid and cholesterol, in particular (Table 3).
Table 3 The relative fold changes of selected altered lipid metabolites (GC-MS based targeted lipidomics) due to treatment with all aSiNPs (aSiNP-189, aSiNP-116, aSiNP-26 and aSiNP-8) for 24 h (*p < 0.05 and **p < 0.001)
Metabolites aSiNP-189 aSiNP-116 aSiNP-26 aSiNP-8
Malic acid 1.374
Phosphoric acid 2.572 **
Proline 0.499
o-Hydroxybenzaldehyde 1.745
Dibutylphthalate 2.046*
Palmitoleic acid 1.938** 2.537** 1.293 0.848
Palmitic acid 2.635** 1.424 1.301 1.087
Oleic acid 2.017** 1.703* 1.344 0.889
Oleic acid-(isomer) 2.136** 1.528* 1.176 0.824
cis-Octadecanoic acid 2.38** 1.142 0.906
Stearic acid 1.859* 1.428 1.369 1.282
Di(2-ethylhexyl) adipate 2.221**
Myristic acid 2.944*** 1.565* 1.219
Arachidonic acid 2.405 ** 1.385 0.980
Eicosatrienoic acid 2.566** 2.250** 1.152
Monopalmitin 2.068** 2.022* 1.231 0.771
Monostearin 1.252
1-Monooleoylglycerol 2.593** 1.499 0.979
Cholesterol 2.467** 2.068** 1.224 1.079


Fatty acid metabolism and steroid biosynthesis were found to be the main perturbed pathways, particularly with aSiNP-189 and aSiNP-116, based on differentially altered lipid metabolites (>1.5 fold) (Fig. S6). No pathways were found for aSiNP-26 and aSiNP-8, as these compounds did not exhibit significant alterations of lipid metabolites (Table 3).

Integrated pathway analysis based on transcriptomics and metabolomics of aSiNP-116

The combination of GC-MS-based fatty acid/lipid metabolites and DEG from the microarrays (significantly altered genes/metabolites, >1.5 fold changes) in IMPaLA identified the pathways as cholesterol biosynthesis, hypercholesterolemia, steroid biosynthesis, and SREBP signaling (Table 4).
Table 4 Integrated pathway analysis (selected) of genomics (>1.5 fold microarray DGE) and lipidomics (GC-MS based and >1.5 fold) by IMPaLA (http://www.impala.molgen.mpg.de/) due to aSiNP-116 exposure for 24 h
Pathway name Pathway source Number of overlapping genes/overlapping genes Number overlapping metabolites/overlapping metabolites P-Joint Q-Joint
Cholesterol biosynthesis Reactome 7/LSS; FDPS; DHCR7; HSD17B7; CYP51A1; HMGCS1; MVD 2/Cholesterol; phosphoric acid 5.64 × 10⁻¹³ 7.81 × 10⁻¹⁰
Cholesteryl ester storage disease SMPDB 6/LSS; FDPS; HMGCS1; HSD17B7; CYP51A1; MVD 2/Cholesterol; phosphoric acid 4.20 × 10⁻¹¹ 2.43 × 10⁻⁹
Lysosomal acid lipase deficiency (Wolman disease) SMPDB 6/LSS; FDPS; HMGCS1; HSD17B7; CYP51A1; MVD 2/Cholesterol; phosphoric acid 4.20 × 10⁻¹¹ 2.43 × 10⁻⁹
Hypercholesterolemia SMPDB 6/LSS; FDPS; HMGCS1; HSD17B7; CYP51A1; MVD 2/Cholesterol; phosphoric acid 4.20 × 10⁻¹¹ 2.43 × 10⁻⁹
Steroid biosynthesis SMPDB 6/LSS; FDPS; HMGCS1; HSD17B7; CYP51A1; MVD 2/Cholesterol; phosphoric acid 4.20 × 10⁻¹¹ 2.43 × 10⁻⁹
Biological oxidations Reactome 10/GSTA2; UGT2B17; ADH4; GSTA5; CYP24A1; GSTA1; CYP51A1; GSTA3; ACSS2; SULT1E1 2/Cholesterol; phosphoric acid 1.51 × 10⁻⁸ 7.76 × 10⁻⁷
Steroid biosynthesis – Homo sapiens (human) KEGG 5/CYP51A1; CYP24A1; DHCR7; HSD17B7; LSS 1/Cholesterol 8.72 × 10⁻⁸ 4.31 × 10⁻⁶
SREBP signaling Wikipathways 6/LDLR; LSS; FDPS; MVD; CYP51A1; HMGCS1 1/Cholesterol 1.49 × 10⁻⁷ 7.13 × 10⁻⁶
Metabolism Reactome 25/GPD1; HSD17B7; STARD4; FADS2; GSTA5; SULT1E1; FDPS; DHCR7; CYP24A1; CYP51A1; UGT2B17; LSS; SMPD2; HMGCS1; PLA2G10; ACSS2; NDUFB3; ALDOC; LDLR; SLC2A3; MVD; GSTA1; GSTA2; GSTA3; ADH4 3/Cholesterol; oleic acid; phosphoric acid 1.82 × 10⁻⁷ 8.40 × 10⁻⁶
Cholesterol biosynthesis I HumanCyc 4/CYP51A1; DHCR7; HSD17B7; LSS 1/Cholesterol 4.56 × 10⁻⁷ 1.89 × 10⁻⁵
Vitamin D metabolism Wikipathways 2/DHCR7; CYP24A1 2/Cholesterol; phosphoric acid 4.65 × 10⁻⁷ 1.89 × 10⁻⁵
Metabolism of lipids and lipoproteins Reactome 14/GPD1; LSS; FADS2; LDLR; PLA2G10; FDPS; DHCR7; SMPD2; HMGCS1; HSD17B7; CYP24A1; CYP51A1; STARD4; MVD 2/Cholesterol; phosphoric acid 9.75 × 10⁻⁷ 3.86 × 10⁻⁵
Steroid metabolism INOH 4/FDPS; DHCR7; MVD; LSS 1/Cholesterol 1.03 × 10⁻⁶ 3.95 × 10⁻⁵
Phase II conjugation Reactome 6/UGT2B17; GSTA5; GSTA1; GSTA2; GSTA3; SULT1E1 2/Cholesterol; phosphoric acid 1.64 × 10⁻⁶ 6.15 × 10⁻⁵
Glutathione conjugation Reactome 4/GSTA1; GSTA2; GSTA3; GSTA5 1/Phosphoric acid 1.99 × 10⁻⁵ 0.000656
Signal transduction Reactome 9/PTCH2; OPN1LW; OR2J3; LDLR; OR56A4; SMPD2; CDK1; OR13C2; OR2T8 4/Cholesterol; palmitoleic acid; oleic acid; phosphoric acid 3.83 × 10⁻⁵ 0.0012
Signaling by GPCR Reactome 7/OR2T8; PTCH2; OPN1LW; OR2J3; CDK1; OR13C2; OR56A4 3/Palmitoleic acid; oleic acid; phosphoric acid 0.000686 0.0148
Transmembrane transport of small molecules Reactome 2/SLC2A3; FXYD1 3/Cholesterol; oleic acid; phosphoric acid 0.00225 0.0359
Cholesterol biosynthesis Reactome 7/LSS; FDPS; DHCR7; HSD17B7; CYP51A1; HMGCS1; MVD 2/Cholesterol; phosphoric acid 5.64 × 10⁻¹³ 7.81 × 10⁻¹⁰
Cholesteryl ester storage disease SMPDB 6/LSS; FDPS; HMGCS1; HSD17B7; CYP51A1; MVD 2/Cholesterol; phosphoric acid 4.20 × 10⁻¹¹ 2.43 × 10⁻⁹
Lysosomal acid lipase deficiency (Wolman disease) SMPDB 6/LSS; FDPS; HMGCS1; HSD17B7; CYP51A1; MVD 2/Cholesterol; phosphoric acid 4.20 × 10⁻¹¹ 2.43 × 10⁻⁹


Alteration in total cholesterol levels

To substantiate the changes in cholesterol synthesis, we measured the cholesterol levels biochemically for all aSiNPs (aSiNP-189, aSiNP-116, aSiNP-26 and aSiNP-8) in treated and untreated HepG2 cells. As was hypothesized from the in silico analysis, the treatment of aSiNP-116 exhibited a clearly significant dose dependent increase, specifically between 50 mg L−1 and 200 mg L−1, in the total cholesterol concentration (Fig. 2). aSiNP-189 exhibited a similar trend to aSiNP-116, i.e., a dose dependent increase of cholesterol concentration in HepG2 cells (Fig. 2). Contrastingly, dose dependent alterations (increase) in cholesterol levels were not evident upon aSiNP-26 and aSiNP-8 exposure (Fig. 2). Interestingly, aSiNP-26, but not aSiNP-8, showed a trend of high cholesterol level compared to the control, although without significant alteration (Fig. 2).
image file: c6ra06006d-f2.tif
Fig. 2 Changes in total cholesterol levels at different concentrations (10, 25, 50, 100 and 200 mg L−1) of all aSiNPs (aSiNP-189, aSiNP-116, aSiNP-26 and aSiNP-8) treatment for 24 h in HepG2 cells. Data presented as mean ± SEM. *p < 0.05; **p < 0.001.

Discussion

In this study, we report a comprehensive profiling of the toxicity mechanism and mode of action of aSiNPs in HepG2 cells with a multi-OMICS approach, including DNA microarrays for global gene expression and GC-MS based lipidomics analysis. Following the bioinformatics pathway analysis at individual as well as integrated OMICS levels, biochemical tests were finally conducted to confirm the in silico findings experimentally. The hypothesis derived for one particular type of aSiNP (aSiNP-116) exposure was further examined with other three types of aSiNPs (aSiNP-189, aSiNP-26, and aSiNP-8), which differ only in their surface areas.

We started with the standard cytotoxicity endpoints with aSiNP-116 and found that aSiNP-116 was not highly toxic to HepG2 cells (Fig. S2). A similar trend of cytotoxicity was reported in a study conducted with 14 nm amorphous silica nanoparticles in HepG2 cells.8

Furthermore, to delineate the molecular mechanism, we performed DNA microarrays for global transcriptomics at 100 mg L−1 exposed cell samples (moderate cytotoxicity dose, ∼71% viability). The pathway analysis based on the DEGs from the microarray (>1.5 fold) indicated that the lipid metabolism pathway and the cholesterol and steroid biosynthesis pathways, in particular (Tables 2 and S2), were the most enriched gene networks altered in aSiNP-116 exposed HepG2 cells. Our microarray and pathway analysis outcomes were in agreement with a previous study conducted in amorphous silica nanoparticles-exposed human lung A549 cells, wherein the perturbation of lipid biosynthesis was reported.23 In addition, a GC-MS based metabolomics study reported metabolite disturbances in energy metabolism, amino acid metabolism, lipid metabolism, and nucleotide metabolism induced by various sized silica particles (30, 70, and 300 nm) in mice.24 Because metabolism of lipids and lipoproteins and steroid biosynthesis pathways were identified by functional annotation clustering in GSEA and KEGG pathway analysis (Tables 2 and S2), we further performed lipid metabolite profiling with GC-MS, which displayed marked upregulation of cholesterol and palmitoleic acid (Table 3). At the subsequent step, cholesterol biosynthesis was identified as the principal altered signaling pathway by integration of differentially altered lipid metabolites (>1.5 fold) and DEGs from the microarrays (>1.5 fold) in IMPaLA (Table 4). Finally, the biochemical analysis of cholesterol (Fig. 2) experimentally confirms the hypothesis derived from the bioinformatics analysis for aSiNP-116 exposure.

All the evidence, in particular, (i) cholesterol and steroid biosynthesis evoked by the functional annotation clustering and GSEA/KEGG pathway analysis (Tables 2 and S2), (ii) upregulation of cholesterol metabolites in targeted lipid metabolomics (Table 3), (iii) the steroid biosynthesis pathway by lipidomics based pathway analysis (Fig. S6B), (iv) cholesterol biosynthesis by integrated transcriptome–metabolome pathway analysis (Table 4) and (v) the further increase in total cholesterol by direct biochemical detection (Fig. 2) indicated that aSiNP-116 exposure caused the activation of the cholesterol biosynthesis pathway as a principal signaling mechanism, possibly through a SREBF2-mediated transcription pathway (Fig. 3). Intracellular levels of cholesterol and fatty acids are controlled through a feedback regulatory system mediated by a family of transcription factors called sterol regulatory element-binding proteins (SREBPs: SREBP1a, SREBP1c and SREBP2, encoded by SREBF1 and SREBF2 genes).25 The evidence suggests SREBF2 as the most active transcription factor in aSiNP-116 mediated physiological consequences, as the gene expression of SREBF2 (+1.41 fold in the microarray and +2.38 fold in individual qPCR) was found to be significantly higher than that of the SREBF1 gene (Table S5).


image file: c6ra06006d-f3.tif
Fig. 3 Illustrations displaying the alteration of cholesterol/fatty acid metabolism (downstream target genes of either SREBF1 (left) or SREBF2 (right)) and the cytochrome P450 enzymes (CYP) involved in cholesterol metabolism to steroid hormones, oxysteol and bile acids in HepG2 cells exposed to aSiNP-116 for 24 h. The genes/metabolites are listed with their respective fold changes (the number next to the (±) sign with the name of the gene/metabolite). The (+) sign indicates the upregulation and (−) indicates downregulation of mRNA levels (blue) from the microarray DGE results and the metabolomics (red) levels deduced from GC-MS.

Alterations in cholesterol homeostasis by aSiNPs as a function of surface area

Paradoxically to our findings, it was documented that amorphous silica (food grade) is hypocholesterolemic in rats.26 Recently, Kupferschmidt et al. (2014) reported that the pore size of mesoporous amorphous silica is an important parameter for reduction of body weight and body fat composition; however, no differential effects were found on cholesterol (blood lipids) levels due to mesoporous amorphous silica exposure to mice.27 On the other hand, knowledge gaps were identified in the risk assessment of nanosilica in food, specifically, on the means by which differences in physicochemical properties may cause differential toxicity responses.11 In consideration of all this, further we asked whether the cholesterol perturbation phenomenon is an interpolated fact for aSiNP-116 alone or whether cholesterol homeostasis could also be altered by other aSiNPs. To this end, we used three other types of aSiNPs in addition to aSiNP-116, which differ in their surface areas. By GC-MS based lipidomics (Table 3) and cholesterol biochemical analysis (Fig. 2), it was evident that the alteration of cholesterol by aSiNPs depends on the surface area of the same and is directly proportional. The order of aSiNPs in the induction of cholesterol level is aSiNP-189 > aSiNP-116 > aSiNP-26 > aSiNP-8, i.e., the larger the surface area, the higher the induced cholesterol concentrations (Fig. 2). Interestingly, no alteration of the cholesterol level was evident for the aSiNP with the lowest surface area (aSiNP-8).

Our observations are somewhat paradoxical to earlier works, and the hypothesis of the results can be explained by the structural and textural properties of the aSiNPs. High surface area particles, such as aSiNP-189 and aSiNP-116, exhibited high levels of cholesterol at all the exposed levels (Fig. 2). However, low surface area particles, such as aSiNP-26 and aSiNP-8, showed cholesterol levels comparatively close to the control, which is indicative of their poor adsorption properties. Surface area is a phenomenon of adsorption and therefore high surface area particles hold significant amounts of cholesterol, and if not excreted, would remain in the cell systems with high amounts of cholesterol. In support of our hypothesis, it has been shown that silica adsorbs significant amounts of cholesterol and is influenced by the interaction of bile salts with the cholesterol.28 In our study, the genes related to bile acid synthesis from cholesterol were suppressed (Fig. 3 and Table S3). Therefore, it is expected that the level of cholesterol would decrease as soon as the silica particles carrying cholesterol were excreted out of the cells. On the other hand, the particle size may be responsible for the observed effects on the cholesterol levels. The particle size measured by DLS (Table 1) shows no consistency in response to the cholesterol level. Alternatively, the particle size measured by scanning electron microscopy shows a different trend and is consistent with the effects of cholesterol homeostasis. As the two methods obtained various particle sizes, the reliability of the effects of particle size on the cholesterol levels was difficult to judge. Assuming the surface area is the most reliable measurement and is consistent with the absorption of cholesterol, we consider the surface area to be a control parameter for the observed effect. Numerous previous studies focused on porosity-surface area in the biocompatibilities of SiNPs,29 while our study reported porosity-independent but specific surface area-mediated cholesterol perturbation in hepatic cells, it is obvious that more studies are needed to identify possible mechanisms of cholesterol adsorption–excretion in relation to the properties of aSiNPs, and a safe-by-design approach is necessary for the application of aSiNPs in the biomedical and food processing industries.

Conclusion

In summary, we employed a systems toxicology approach to analyze the molecular mechanisms and pathways involved in aSiNPs-mediated hepatotoxicity. Our results demonstrated that aSiNPs exposure in HepG2 cells caused modulation of the cholesterol and steroid biosynthesis pathways. Moreover, perturbation of cholesterol biosynthesis was found to be dependent on the surface area of the aSiNPs; the larger the surface area, the higher the induced cholesterol level. We believe that the outcome of our study will contribute significantly to a greater understanding of the mode of action of aSiNPs, and in particular, would present a paradigm for elucidation of regulatory signaling cascades with the power of integrated ‘OMICS’ (transcriptomics and metabolomics) and pathway analysis induced by nanomaterials. Most importantly, the surface area of the aSiNPs can be tailored to control the induced cholesterol level, and a safe-by-design approach could be achieved for further biological applications.

Conflict of interest

None declared.

Abbreviations

aSiNP-116Amorphous silica nanoparticles purchased from Sigma (#381276, Sigma-Aldrich) with a surface area of 116 m2 g−1
aSiNP-189Amorphous silica nanoparticles available from NANoREG (http://www.nanoreg.eu/) with a surface area of 189 m2 g−1
aSiNP-26In-house synthesized amorphous silica nanoparticles with a surface area of 26 m2 g−1
aSiNP-8In-house synthesized amorphous silica nanoparticles with a surface area of 8.3 m2 g−1

Acknowledgements

This study was supported by the Mid-career Researcher Program (2013R1A2A2A03010980) through the National Research Foundation of Korea (NRF) grant funded by the Ministry of Science, ICT and Future Planning and also by a National Institute of Environmental Research (NIER) grant funded by the Ministry of Environment. Rambabu Atluri's study has been partially funded by the European Union Seventh Framework Programme (FP7/2007–2013) under the project NANoREG (A common European approach to the regulatory testing of nano-materials), grant agreement 310584.

References

  1. OECD, Synthetic amorphous silica and silicates, Berlin, Germany, 2004, http://www.chem.unep.ch/irptc/sids/OECDSIDS/silicates.pdf, accessed on 22 August 2014 Search PubMed.
  2. J. Lu, M. Liong, S. Sherman, T. Xia, M. Kovochich, A. E. Nel, J. I. Zink and F. Tamanoi, Nanobiotechnology, 2007, 3, 89–95 CrossRef CAS PubMed.
  3. I. I. Slowing, J. L. Vivero-Escoto, C. W. Wu and V. S. Lin, Adv. Drug Delivery Rev., 2008, 60, 1278–1288 CrossRef CAS PubMed.
  4. S. Dekkers, P. Krystek, R. J. Peters, D. P. Lankveld, B. G. Bokkers, P. H. van Hoeven-Arentzen, H. Bouwmeester and A. G. Oomen, Nanotoxicology, 2011, 5, 393–405 CrossRef CAS PubMed.
  5. R. Peters, E. Kramer, A. G. Oomen, Z. E. Rivera, G. Oegema, P. C. Tromp, R. Fokkink, A. Rietveld, H. J. Marvin, S. Weigel, A. A. Peijnenburg and H. Bouwmeester, ACS Nano, 2012, 6, 2441–2451 CrossRef CAS PubMed.
  6. Y. X. Yang, Z. M. Song, B. Cheng, K. Xiang, X. X. Chen, J. H. Liu, A. Cao, Y. Wang, Y. Liu and H. Wang, J. Appl. Toxicol., 2014, 34, 424–435 CrossRef CAS PubMed.
  7. C. Fruijtier-Polloth, Toxicology, 2012, 294, 61–79 CrossRef PubMed.
  8. J. Ahmad, M. Ahamed, M. J. Akhtar, S. A. Alrokayan, M. A. Siddiqui, J. Musarrat and A. A. Al-Khedhairy, Toxicol. Appl. Pharmacol., 2012, 259, 160–168 CrossRef CAS PubMed.
  9. Y. Li, L. Sun, M. Jin, Z. Du, X. Liu, C. Guo, Y. Li, P. Huang and Z. Sun, Toxicol. In Vitro, 2011, 25, 1343–1352 CrossRef CAS PubMed.
  10. Y. Yu, Y. Li, W. Wang, M. Jin, Z. Du, Y. Li, J. Duan, Y. Yu and Z. Sun, PLoS One, 2013, 8, e61346 CAS.
  11. S. Dekkers, H. Bouwmeester, P. M. Bos, R. J. Peters, A. G. Rietveld and A. G. Oomen, Nanotoxicology, 2013, 7, 367–377 CrossRef CAS PubMed.
  12. H. Nishimori, M. Kondoh, K. Isoda, S. Tsunoda, Y. Tsutsumi and K. Yagi, Eur. J. Pharm. Biopharm., 2009, 72, 496–501 CrossRef CAS PubMed.
  13. E. Tedesco, I. Micetic, S. G. Ciappellano, C. Micheletti, M. Venturini and F. Benetti, Toxicol. In Vitro, 2015, 29, 1736–1744 CrossRef CAS PubMed.
  14. A. Craig, J. Sidaway, E. Holmes, T. Orton, D. Jackson, R. Rowlinson, J. Nickson, R. Tonge, I. Wilson and J. Nicholson, J. Proteome Res., 2006, 5, 1586–1601 CrossRef CAS PubMed.
  15. A. Wilmes, A. Limonciel, L. Aschauer, K. Moenks, C. Bielow, M. O. Leonard, J. Hamon, D. Carpi, S. Ruzek, A. Handler, O. Schmal, K. Herrgen, P. Bellwon, C. Burek, G. L. Truisi, P. Hewitt, E. Di Consiglio, E. Testai, B. J. Blaauboer, C. Guillou, C. G. Huber, A. Lukas, W. Pfaller, S. O. Mueller, F. Y. Bois, W. Dekant and P. Jennings, J. Proteomics, 2013, 79, 180–194 CrossRef CAS PubMed.
  16. K. Brink-Jensen, S. Bak, K. Jorgensen and C. T. Ekstrom, PLoS One, 2013, 8, e72116 CAS.
  17. W. Stöber, A. Fink and E. Bohn, J. Colloid Interface Sci., 1968, 26, 62–69 CrossRef.
  18. S. Lowell, J. E. Shields, M. A. Thomas and M. Thommes, Characterization of Porous Solids and Powders: Surface Area, Pore Size and Density, Kluwer Academic Publishers, Dordrecht, The Netherlands, 2004 Search PubMed.
  19. S. Brunauer, P. H. Emmett and E. Teller, J. Am. Chem. Soc., 1938, 60, 309–319 CrossRef CAS.
  20. N. Chatterjee, H. J. Eom and J. Choi, Biomaterials, 2014, 35, 1109–1127 CrossRef CAS PubMed.
  21. J. Xia and D. S. Wishart, Nat. Protoc., 2011, 6, 743–760 CrossRef CAS PubMed.
  22. A. Kamburov, R. Cavill, T. M. Ebbels, R. Herwig and H. C. Keun, Bioinformatics, 2011, 27, 2917–2918 CrossRef CAS PubMed.
  23. R. Foldbjerg, J. Wang, C. Beer, K. Thorsen, D. S. Sutherland and H. Autrup, Chem.–Biol. Interact., 2013, 204, 28–38 CrossRef CAS PubMed.
  24. X. Lu, Y. Tian, Q. Zhao, T. Jin, S. Xiao and X. Fan, Nanotechnology, 2011, 22, 055101 CrossRef PubMed.
  25. D. Eberle, B. Hegarty, P. Bossard, P. Ferre and F. Foufelle, Biochimie, 2004, 86, 839–848 CrossRef CAS PubMed.
  26. M. R. Peluso and B. O. Schneeman, J. Nutr., 1994, 124, 853–860 CAS.
  27. N. Kupferschmidt, R. I. Csikasz, L. Ballell, T. Bengtsson and A. E. Garcia-Bennett, Nanomedicine, 2014, 9, 1353–1362 CrossRef CAS PubMed.
  28. N. N. Vlasova and L. P. Golovkova, Colloid J., 2009, 71, 474–479 CrossRef CAS.
  29. T. Asefa and Z. Tao, Chem. Res. Toxicol., 2012, 25, 2265–2284 CrossRef CAS PubMed.

Footnote

Electronic supplementary information (ESI) available: Detailed materials and methods, qPCR primer sequences, and additional figures (Fig. S1–S6) and tables (Tables S1–S5). See DOI: 10.1039/c6ra06006d

This journal is © The Royal Society of Chemistry 2016
Click here to see how this site uses Cookies. View our privacy policy here.