DOI:
10.1039/C6RA05838H
(Paper)
RSC Adv., 2016,
6, 64482-64493
Effect of nanosized and surface-structural-modified nano-pyroxene on adsorption of violanthrone-79†
Received
4th March 2016
, Accepted 29th June 2016
First published on 1st July 2016
Abstract
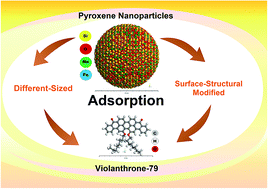
This study presents new environmentally sound and low-cost yet highly efficient pyroxene (NaFeSi2O6, PY), known as aegirine, nanoparticles. They are applied for the first time for the adsorptive removal of violanthrone-79 (VO-79) which was selected as a model-adsorbing compound to mimic polar heavy hydrocarbons. PY nanoparticles are prepared by a low temperature hydrothermal synthesis route. Controlled particle sizes of PY nanoparticles were synthesized in the range between 1 and 100 nm. Moreover, the surface and structure of the PY nanoparticles were modified by partially replacing some of the original atoms, like Na, Fe or Si, by Ce, Zr, Ni, Ca and H to enhance their adsorption capacity towards VO-79. One nanoparticle size was prepared at different synthesis heat-treating times to investigate the stability of the nano-adsorbent. It has been found that PY nanoparticles with particle sizes in the range between 30 and 60 nm have the highest adsorption capacity and affinity towards VO-79. The adsorption capacity of the VO-79 over functionalized PY nanoparticles was increased significantly in the order of PY–H > PY–Ca > PY–Ni > PY–Ce > PY–Zr, when compared with unmodified PY nanoparticles. Varying the heat-treating time of synthesis of PY nanoparticles did not affect their size stability and surface properties. Moreover, no significant increase towards VO-79 adsorption uptake was detected. The experimental macroscopic adsorption isotherms fit well to the Sips model, indicating a heterogeneous adsorption system.
1. Introduction
As of today, oil is considered the most used non-renewable energy resource worldwide,1,2 and will continue to be an important resource for future energy as well.3 The world's oil demand in 2014 was estimated to be 92.4 million barrels per day and is expected to reach 200 million barrels per day in 2050.3,4 However, with the recent fluctuation in global oil prices, the new reality represents a new challenge for the oil and gas industry. Accordingly, there is a critical need by the oil and gas industry to think beyond its current mind set and mandate intensive research to reduce both the costs and environmental footprints of the current heavy oil upgrading and recovery processes. To this purpose, nanotechnology, in the form of nanoparticles, has been attracting the scientific community and the oil industry for the potential to increase efficiency of bitumen upgrading and recovery, while reducing the environmental footprints. The exceptional properties of nanoparticles, such as high surface area-to-volume ratio and active surface functionality, promote their adsorptive and catalytic behaviours towards heavy hydrocarbons.5,6 The modern advances in nanotechnology can be reflected in terms of design nanomaterials by parametrizing the shape, size, chemical compositions and structures.7
For the purpose of oil upgrading and recovery enhancement, recent results from our research group have shown that nanoparticles could be employed as catalysts for enhancing hydroprocessing reactions in heavy oil matrices.8,9 It is reported that nanoparticles enhanced the upgrading of Athabasca bitumen by significantly increasing the hydrogen/carbon atomic ratio and reducing both viscosity and coke formation. Using multi-metallic ultra-dispersed nanoparticles for hydrocracking of bitumen in an oil sand packed bed column, Hashemi et al.,10,11 reported a viscosity reduction in the produced oil as a result of bitumen contact with emitted hydrocarbon hot gases. Hashemi et al.,12 showed that there exists a recovery enhancement via injection of hot fluid and nanocatalysts inside the medium. More recently, our research group has shown that nanoparticles can work as inhibitors to prevent or delay precipitation of asphaltenes.13 The use of nanoparticles as nano-inhibitors, for in situ adsorption of asphaltenes within the well, have demonstrated the possibility of upgrading and recovering of oils while reducing clogging of pores, viscosity, and formation damage.6,14,15 Also, nanoparticles could work as adsorbents and catalysts to selectively separate heavy polar hydrocarbons, like asphaltenes, from heavy oil by adsorbing them onto its surfaces and, consequently, upgrade these heavy fractions into light utilizable distillates. We have employed supported and unsupported nanoparticles for asphaltenes adsorption from oil matrix followed by post-adsorption catalytic decomposition.16–18
It is worth noting here, it was only recently recognized, that nanosize and shape of metal-based nanoparticles play a vital role in controlling their (bio)chemical reactivity and surface functionality in an aquatic environment.19–25 However, the effect of nanosize, morphology and surface acidity on the adsorption and catalytic properties of metal-based nanoparticles towards heavy hydrocarbon adsorption from oil matrix and post-adsorption decomposition of heavy hydrocarbon is as yet unclear. On the surface area-normalized basis, micro alumina particles were found to be more catalytically active compared to alumina nanoparticles, while more asphaltenes were adsorbed on the latter than the former.26 This may be related to the type of faces exposed, as asphaltene adsorption may only occur at specific sites. Hence, a detailed look into the effects of size and morphology of metal-based nanoparticles on their chemical reactivity, adsorption, aggregation/dispersion, and surface properties, towards polar heavy hydrocarbons, is critical for optimization of the adsorption and catalytic processes.
To maximize the sustainability of the adsorption and post-adsorption catalytic processes, it is important that the developed nanoparticles be earth abundant, naturally occurring, economical and environmentally friendly. Accordingly, in addition to understanding the adsorption behavior of heavy polar hydrocarbon, another major purpose of this study is to develop new nanoadsorbents based on iron-silicate pyroxene minerals, known as aegirine (NaFeSi2O6),27–30 which are widespread in nature and innocuous materials, for adsorption of polar heavy hydrocarbon. These iron-silicate minerals in nanoparticle sizes also possess superficial ionic exchange properties that permit surface modification to introduce Brønsted acid sites,31 which could positively impact its adsorptive and catalytic properties. However, because of the complexity of asphaltenes, the understanding of its adsorption properties is difficult. Hence, a proper model molecule with a well-defined structure that can mimic the properties of real asphaltenes would help to improve this understanding.
Here we used violanthrone-79 (VO-79) as a model heavy compound to better mimic asphaltenes and understand its adsorption behaviours on different surfaces of nanoparticles. VO-79 is not only a more representative heavy compound, but also its structure is composed of polyaromatic cores containing oxygen with attached aliphatic chains. Also, VO-79 was proven to resemble asphaltenes in their chemical and physical properties and adsorption behaviour on solid surfaces.32 The iron-silicate nanoparticles (NaFeSi2O6) are prepared in-house using low temperature hydrothermal synthesis route, like the one used for commercial zeolites production,31 and tested for the first time for adsorptive removal of VO-79 from toluene-based solutions. This study provides vital insights about the surface selectivity and activity as well as particle size role for the development of more efficient nano-adsorbents and catalysts (nanosorbcats)33 for heavy hydrocarbon processing. We believe that this field of study is highly novel, and is of strategic importance to the oil industry worldwide and other industries dealing with large scale use of nanoparticles.
2. Experimental section
2.1 Materials
A model asphaltene molecule, violanthrone (VO-79) (98% C50H48O4, Mw = 712.91 g mol−1, dark brown to black solid color CAS number 85652-50-2) purchased from Toronto Research Chemicals (ON, Canada). Fig. 1a and b show the chemical structure of VO-79 as drawn with ChemDraw V14 and the 3-D ball and stick molecular structure optimized with BIOVIA Forcite module, respectively. Pyroxene (PY) nanoparticles were prepared in-house and applied for adsorption of VO-79 from toluene-based solutions. Fig. 1c and d show the ball and stick aegirine unit cell structure drawn with BIOVIA Builder module34 and CPK structure of a 10 nm diameter of PY nanoparticle drawn with the BIOVIA Nanostructure module,24 respectively. Toluene HPLC grade obtained from Sigma-Aldrich (ON, Canada) was used as a solvent. For typical PY gel preparation, sulfuric acid (H2SO4 97%) was acquired from Fisher Scientific (ON, Canada); sodium silicate (SiO2 26.5%, Na2O 10.6%) from Sigma-Aldrich (ON, Canada); iron(III)chloride hexahydrate (FeCl3·6H2O 99%) from Merck (ON, Canada); and sodium hydroxide (NaOH 99%) from VWR (ON, Canada). For PY nanoparticles modification, zirconyl chloride octahydrate (ZrOCl2·8H2O); nickel(II)nitrate hexahydrate (Ni(NO3)2·6H2O); cerium nitrate hexahydrate (Ce(NO3)·6H2O); calcium nitrate tetrahydrate (Ca(NO3)2·4H2O) and sulfuric acid (H2SO4 97%) all purchased from Sigma-Aldrich (ON, Canada) were employed. All chemicals were used as received without any further purification.
 |
| Fig. 1 Chemical structure of (a) VO-79 drawn with ChemDraw V14.0;35 (b) 3-D ball and stick molecular structure of VO-79 optimized with BIOVIA Forcite module;24 (c) ball and stick aegirine unit cell structure36 drawn with BIOVIA Builder module34 and (d) CPK structure of a 10 nm of nano-aegirine particle drawn with the BIOVIA Nanostructure module.24 Green atoms represent sodium, red atoms represent oxygen, blue atoms represent iron, yellow atoms represent silicon, grey atoms represent carbon and white atoms represent hydrogen (ESI, Section S1†). | |
2.2 Synthesis of PY nanoparticles
2.2.1 PY of different nanoparticle sizes. Different-sized PY nanoparticles with sizes between 10 and 99 nm were prepared by a simple controlled time and low temperature hydrothermal synthesis route. In brief, an acidic solution that consists of 2.8 g of FeCl3, 2.4 g of H2SO4, and 12 g of distilled water, was slowly added to a basic solution that consists of 4.9 g of sodium silicate, 3.2 g of NaOH and 9 g of distilled water. The mixture was magnetically stirred at 300 rpm and 25 °C for 15 min to produce a homogeneous fluid-like brown gel. Then, the prepared gel was transferred to a 40 mL non-stirred stainless-steel Parr reactor (series 4713) which was placed in an oven at temperature of 220 °C for 72 h, unless otherwise noted. After reaching the desired crystallization time, filtration and washing with distilled water were carried out to the obtained product. After that, the sample was allowed to dry overnight at room temperature (ESI, Table S1†). For cases where the particle size is higher than 34 nm, the previously nucleated crystals of PY nanoparticles were used as seeds and introduced in the gel in an attempt to provide conditions for nucleation of the crystals to favor the formation of larger nano-crystals. Seeding technique was helpful to enhance the growth of crystals and increase the particles size (ESI, Table S1†). The main framework components of the resultant PY nanoparticles structure are silicon, iron, sodium and oxygen, as confirmed by X-ray structural identification analysis. The prepared different-sized PY nanoparticles were labeled as PY followed by the value of the particle size. Thus, PY with a particle size of 10 nm was denoted as PY-10.
2.2.2 PY nanoparticles with different surface and structural modifications. The atomic ratio of Si/Fe in pure aegirine should always be fixed to 2.0. However, it is possible to artificially modify the structure of aegirine by partially replacing Fe or Si during the synthesis by addition of other suitable elements, and in this way, an artificial modification of the Si/Fe atomic ratio can be carried out.31 To understand the effect of surface and structural modifications of PY nanoparticles on adsorption (hereinafter called functionalized PY nanoparticles), PY-34 was selected, based on its highest adsorption uptake, for structural and surface modifications. PY-34 was scaled up in a 300 mL stirred 316-stainless-steel Parr reactor (4843 model) with both temperature and stirrer controllers. The surface of the scaled up PY-34 was functionalized with different elements, namely, hydrogen and calcium by superficial ion exchange to replace the original sodium cation. PY-34 was dispersed in an aqueous solution containing diluted sulfuric acid solution at room temperature. The solid was filtered and washed with distilled water. Finally, the solid was dried at room temperature for 20 h and stored in a sealed container for further uses. The modified nanoparticles were labeled by the initial letters of the adsorbent followed by the symbol of the functionality element. For example, PY nanoparticles that are ion exchanged with hydrogen was denoted as PY–H. The same procedure was used to obtain PY–Ca using calcium nitrate tetrahydrate but the mixing temperature was raised to 60 °C for 6 h to promote a faster rate of exchange. Then, the mixture was filtered and the solid was washed with enough distilled water. Nickel nitrate solution was used for PY-34 wetting impregnation. PY was titrated with water until the last drop of water makes the solid completely wet (slurry-like). Then, this amount of water is used to prepare the solution of nickel nitrate to produce 3 wt% nickel impregnated on PY surface. The solid was dried at room temperature overnight and then calcined in air flow at 450 °C for 3 h to produce PY–Ni. For the case of PY–Zr and PY–Ce, 5 wt% of zirconium and cerium were individually doped in the structure of PY nanoparticles by isomorphous substitution of main elements (i.e., Fe and Si). Zirconyl chloride and octahydrate cerium nitrate hexahydrate were added individually to the acid solution for each gel synthesis and hydrothermally treated at temperature of 220 °C for 72 h (ESI, Table S2†).
2.2.3 PY nanoparticles with different heat-treating time. To investigate the effect of heat-treating time, the aforementioned preparation procedure of typical PY nanoparticles preparation was followed, but at a higher scale (factor of 5). Then, the prepared gel was divided equally and placed in five 40 mL non-stirred stainless-steel Parr reactors. All reactors were hydrothermally treated at 220 °C with different heating times of 24, 48, 72, 96 and 120 h. The prepared samples were allowed to dry overnight at room temperature. The samples were labeled as PY followed by the value of the heat-treating time. Thus, PY nanoparticles with a heat-treating time of 24 h was denoted as PY-24.
2.3 Characterization of the prepared PY nanoparticles
2.3.1 X-ray diffraction (XRD). XRD measurements of dried powder different-sized, surface and structural-modified PY nanoparticles were collected at room temperature using X-ray Ultima III Multi Purpose Diffraction System (Rigaku Corp., The Woodlands, TX) with Cu Kα radiation operating at 40 kV and 44 mA with a θ–2θ goniometer. The crystalline domain sizes of the prepared nanoparticles were determined using the Debye–Scherrer equation as implemented in the commercial software JADE37 by fitting the experimental profile to a pseudo-Voigt profile function, and then, calculating the full width at half maximum (FWHM) of the peak. The range of the scan was 10–90° 2θ degrees using a 0.02° step and a counting time of 0.2 step per s. The experimental cell parameters of the prepared materials were obtained by cell refinement with the program CELREF38 by using the extracted peak positions after the profile fitting and the monoclinic space group C2/c (no. 15) with the initial cell parameters reported for aegirine by Cameron et al.36
2.3.2 Textural properties. The surface areas of the prepared different-sized, surface and structural-modified PY nanoparticles were measured following the Brunauer–Emmett–Teller (BET) method. This was accomplished by performing nitrogen physisorption at 77 K using a surface area and porosity analyzer (TriStar II 3020, Micromeritics Corporate, Norcross, GA). The external surface area was obtained by the t-plot method, which indicates the porosity of the surface. Test samples were firstly pretreated at 150 °C under N2 flow overnight before analysis in order to remove any existed moisture.
2.3.3 Scanning electron microscopy (SEM). Scanning electron microscopy was performed to study the surface morphology of the different-sized PY nanoparticles. A field emission Quanta 250 electron microscope manufactured by FEI was used, with an accelerating voltage of 20 kV and a spot size of 3.0. To view the morphology of the samples. A very small quantity of each powdered sample was placed over a carbon tape sample holder and it was tapped to release the excess and loose particles.
2.3.4 High resolution transmission electron microscopy (HRTEM). Transmission electron microscopy images for different-sized PY nanoparticles were obtained via FEI Tecnai F20 FEG TEM using an accelerating voltage of 200 kV to analyze the nanoparticle size and morphology. This technique provides atomic-resolution real space imaging for nanoparticles. Around 0.5 mg of PY nanoparticles sample was dispersed in 1 mL pure ethanol and stirred for approximately 10 minutes in order to assure that the sample was completely suspended. Then, a drop of the solution was deposited on the sample holder by a pipette. Once ethanol evaporated, the powder was placed on the grid holder and became ready for imaging. A High Resolution Transmission Electron Microscopy (HRTEM) carbon grid was used for supporting the sample.
2.3.5 X-ray photoelectron spectroscopy (XPS). XPS analysis was performed to confirm the elemental and the surface composition for the functionalized PY nanoparticles. XPS was carried out with a PHI VersaProbe 5000 spectrometer. The spectra were taken using monochromatic Al source (1486.6 eV) at 50 W and beam diameter of 200.0 μm with a take off angle of 45°. The samples were pressed on a double sided tape, and spectra were taken with double neutralization. The binding energies were reported relative to C1s at 284.8 eV. The peak results were analyzed and fitted with Gaussian–Lorentzian mixed function using the MultiPak software that came with the instrument.
2.3.6 Temperature programmed desorption (TPD). The total acidity and the strength distribution of components for the prepared different-sized, surface and structural-modified PY nanoparticles were performed on a CHEMBET 3000 (Quantachrome Inc.). Ammonia and carbon dioxide (TPD-NH3 and TPD-CO2) were used for this particular analysis. The total surface acidity is dependent on the amount of desorbed gas. A sample of 100 mg was pretreated in a quartz reactor in which a stream of helium (He) was introduced at 150 °C and atmospheric pressure overnight to remove any water from the sample. The sample was then allowed to cool down to 100 °C. Either a flow of 10% NH3(g) in argon (Ar) or 10% CO2(g) in Ar was employed to saturate the sample at 100 °C for 1 h. The flow rate of the mixture of Ar with NH3 or CO2 was kept at 25 cm3 min−1. To desorb the physisorbed NH3 or CO2, pure Ar with a flow rate of 15 cm3 min−1 was passed through the sample for 1 h at 100 °C. Consequently, the sample was heated up to 900 °C at a heating rate of 10 °C min−1 to release the chemisorbed gas. The amount of NH3 or CO2 were determined from the area under the peak using a calibration curve made for this purpose.
2.3.7 Infrared spectroscopy (FTIR). A Nicolet 6700 FT-IR instrument manufactured by Thermo Electron Corporation with a smart diffuse reflectance attachment to carry out diffuse reflectance infrared Fourier transform spectroscopy (DRIFTS) analysis was used to study the molecular bonds and have an up-close view on the hydroxyl functional group region on the surface of the prepared different-sized PY nanoparticles. Around 2.5 mg of the sample was mixed with 500 mg of KBr and the entire mixture was mounted in the DRIFTS sample holder. The spectra were recorded from 400 to 4000 cm−1 with a resolution of 2 cm−1 and each spectrum is the average of 128 scans.
2.3.8 Thermogravimetric analysis (TGA). TGA was used to determine the hydroxyl group density on the surface of the prepared different-sized PY nanoparticles. PY nanoparticles samples were dried in a vacuum oven at 65 °C overnight. After drying, thermogravimetric analysis was carried out for the samples in air flow at a rate of 100 cm3 min−1 with a heating rate of 20 °C min−1 using a simultaneous thermogravimetric analysis/differential scanning calorimetry (TGA/DSC) analyzer (SDT Q600, TA Instruments, Inc., New Castle, DE). The TGA sample mass was kept low (∼5 mg) to avoid diffusion limitations.39 The experiments were repeated twice, to confirm their reproducibility. The TGA instrument was calibrated for mass and heat changes using sapphire as a reference for heat calibration and zinc as a reference for temperature calibration. The surface hydroxyl groups density (σ), expressed as (#OH/nm2), of the PY nanoparticles samples was calculated using the TGA weight loss between 400 and 700 °C as follows:40–42 |
 | (1) |
where Wc is the weight loss (g) in the regime between 400 and 700 °C, WNP is the weight of PY nanoparticles sample (g), SA is the BET surface area of PY nanoparticles (nm2 g−1), the coefficient 2 is given due to the fact that each two hydroxyl groups start to condensate above 400 °C to produce a water molecule with molecular weight Mw of 18.02 (g mol−1), and NA is the Avogadro's number.
2.4 Adsorption experiments
Adsorption experiments were performed at temperature of 25 °C by preparing solutions of VO-79 dissolved in toluene. Around 100 mg of each prepared PY nanoparticles was placed in a set of 25 mL vials containing final volume of 10 mL solution of VO-79 dissolved in toluene with different initial concentrations ranging from 7 to 700 μmol L−1. The vials were sealed firmly to avoid solution evaporation. Adsorption was allowed to take place by shaking the vials for 24 h on a Wrist Action shaker (Burrel, Model 75-BB) to ensure that the equilibrium was attained. Then, the samples were allowed to settle overnight. Afterwards, the supernatant was decanted and tested using Evolution™ 260 UV-Vis spectrophotometer with pure toluene as a blank. The calibration curve was built at a wavelength of 634 nm. Thus, the adsorption uptake per surface area of PY nanoparticles and adsorption affinity were determined based on the constructed isotherms and mass balance analysis. Some experiments were performed by triplicate, and the standard deviations were calculated and presented. The adsorbed amount of VO-79, Q (mol m−2), was calculated as shown in eqn (2). |
 | (2) |
where C0 is the initial concentration of VO-79 in solution (g L−1), Ce is the equilibrium concentration of VO-79 in the supernatant (g L−1), V is the solution volume (L), SA is the BET surface area of PY nanoparticles (m2 g−1), Mw is the molar mass of VO-79 (g mol−1) and m is the mass of the nanoadsorbent (g).
3. Results and discussions
3.1 Characterization studies
3.1.1 XRD of different-sized and functionalized PY nanoparticles. X-ray diffraction analysis of the different-sized PY nanoparticles is shown in Fig. 2a, which confirmed that the correct structure is pyroxene. The sharp peaks in the XRD patterns imply good crystallinity of all products. The identification of the patterns confirms the material to be aegirine. The aegirine structure was identified by comparing these experimental patterns with the reported signals in the pdf card #01-076-2564 of the 2005 ICDD (International Centre for Diffraction Data) database included in the program JADE V.7.5.1 (Materials Data XRD Pattern Processing Identification and Quantification). Noticeable changes in the signals intensities and broadenings are produced. PY-10 nanoparticles produced the broadest signals, indicating that this material has the smallest crystalline domain sizes. However, narrower peaks can be seen when the crystalline domain size increases. Fig. 2b shows the XRD patterns for the functionalized PY nanoparticles. As seen, the patterns are similar; which suggests that the formed structure is similar to the aforementioned identified pattern for the unmodified PY nanoparticles. Notably, PY–Zr has a broader signal implying that the crystalline domain size is smaller when compared to other functionalized PY nanoparticles.
 |
| Fig. 2 XRD powder patterns of nano-pyroxene aegirine for (a) different particle sizes (b) different functionalities. Vertical lines are the reference data (pdf card #01-076-2564) for the iron-silicate pyroxene aegirine from Materials Data XRD Pattern Processing Identification & Quantification.43,44 | |
3.1.2 Textural properties. No significant differences were observed between the surface areas obtained by the BET and t-plot methods for the different-sized and functionalized PY nanoparticles. This suggests that the prepared PY nanoparticles have no significant porosity and maintained high external surface areas.39 An estimation of the particle size (assuming spherical-like nanoparticles) was accomplished by using the measured specific surface area and the derived equation d = 6000/(SAρaegirine); where d is the particle size in nm, SA is the experimentally measured specific surface area (m2 g−1), and ρ is the aegirine density (3.577 g cm−3).43 The estimated diameter values using surface areas are in good agreement with those obtained by XRD for small particle sizes.However, when the particle size increases, significant deviation is observed between crystalline domain sizes obtained by XRD and the particle size obtained by BET as listed in Table 1. This could be because XRD measures the crystalline domain size while the particle may be present as a single crystal or an agglomeration of several crystals. Therefore, for our case here, the ultrafine nano regime, particle size and crystalline domain size are very similar.
Table 1 BET surface area, particle size and XRD crystalline size of different-sized PY nanoparticles
Sample |
BET surface area (m2 g−1) |
Particle size by BET (nm) |
Crystalline domain size by XRD (nm) |
PY-10 |
160 |
10 |
10 ± 2 |
PY-34 |
50 |
34 |
25 ± 1 |
PY-54 |
31 |
54 |
44 ± 1 |
PY-62 |
27 |
62 |
34 ± 2 |
PY-99 |
17 |
99 |
25 ± 2 |
Table 2 lists the crystalline domain sizes and surface areas for the prepared functionalized PY nanoparticles. The crystalline domain sizes and surface areas for the prepared functionalized PY nanoparticles by ion exchange are quite the same. Interestingly enough, the doped Ce and Zr in PY nanoparticles showed a change in the crystalline domain sizes values in comparison with unmodified PY nanoparticles. The surface area values increased for PY–Zr nanoparticles and decreased for PY–Ce nanoparticles. This suggests that the Zr-doping is affecting the growth of the crystal domain sizes contrary to the Ce-doping. This could be due to the replacement that takes place in the silicon sites for Zr and in the iron sites for Ce. Moreover, the size of Zr atom is larger than the Si atom which leads to an increase in the unit cell parameters when incorporated in the aegirine structure.
Table 2 BET surface area, particle size and XRD crystalline size of functionalized PY nanoparticles
Sample |
BET surface area (m2 g−1) |
Particle size by BET (nm) |
Crystalline domain size by XRD (nm) |
Unmodified PY |
50 |
34 |
24 ± 3 |
PY–Ca |
50 |
34 |
23 ± 3 |
PY–Ni |
50 |
34 |
24 ± 2 |
PY–H |
50 |
34 |
25 ± 2 |
PY–Ce |
35 |
49 |
19 ± 2 |
PY–Zr |
78 |
21 |
13 ± 1 |
The Ce atom is not only bigger in size than the Fe atom, but also it is heavier, thus, causing not only a unit cell expansion, but also a smaller surface area by increasing the density of the material. It is worth noting here that neither ZrO2 nor CeO2 signals were detected in the XRD patterns. However, for the PY–Ce nanoparticles sample, some small signals not indexed in the aegirine pattern were detected; this may indicate that not all the cerium added was incorporated into the aegirine structure or that a modification from the C2/c space group occurred by the Ce incorporation into the structure. Confirmation of the incorporation of Zr and Ce in the structure of PY nanoparticles can be obtained by looking at the expansion in the cell parameters for PY–Zr and PY–Ce nanoparticles which are shown in Table 3.
Table 3 Cell parameters for PY–Zr and PY–Ce nanoparticles
Sample |
a [Å] |
b [Å] |
c [Å] |
β [°] |
V [Å3] |
Natural aegirine36 |
9.658 ± 0.002 |
8.795 ± 0.002 |
5.294 ± 0.001 |
107.42 ± 0.02 |
429.1 ± 0.1 |
PY |
9.667 ± 0.007 |
8.801 ± 0.003 |
5.297 ± 0.005 |
107.37 ± 0.08 |
430.1 ± 0.6 |
PY–Zr |
9.719 ± 0.006 |
8.833 ± 0.004 |
5.329 ± 0.004 |
107.33 ± 0.07 |
436.8 ± 0.6 |
PY–Ce |
9.691 ± 0.008 |
8.807 ± 0.006 |
5.316 ± 0.006 |
107.47 ± 0.09 |
432.8 ± 0.9 |
As seen, the incorporation of both Zr and Ce was successful in the structure of samples PY–Zr and PY–Ce nanoparticles as they produced expansions of the cell parameters a, b and c (Table 3). The cell parameters and most noticeably the cell volume were expanded for the Zr and Ce samples beyond the error of the technique. Zr and Ce have larger crystal radii than Si and Fe. Nonetheless, in the case of the Ce sample, the expansion is lower than the Zr-sample and it may suggest that part of the Ce is in another structure (the extra signals in the high resolution diffractogram).
XRD analysis of PY nanoparticles with different heat-treating times showed very close values for the crystalline domain sizes as seen in Table 4. The relative crystallinity was not affected with increasing crystallization time and average crystalline domain size remained around 27 nm, as obtained by the Debye–Scherrer equation. According to the XRD results, increasing crystallization time does not increase the crystalline domain size. Accordingly, the BET surface area remained unaffected by the heat-treating time despite the fact that crystallization time can have both positive and negative impact on the crystallinity.45–47
Table 4 BET surface area, particle size and XRD crystalline size PY nanoparticles prepared at different synthesis time
Sample |
Synthesis time (h) |
BET surface area (m2 g−1) |
Particle size by BET (nm) |
Crystalline domain size by XRD (nm) |
PY-24 |
24 |
42 |
40 |
27 ± 2 |
PY-48 |
48 |
45 |
37 |
26 ± 2 |
PY-72 |
72 |
40 |
42 |
28 ± 2 |
PY-96 |
96 |
40 |
42 |
27 ± 2 |
PY-120 |
120 |
43 |
39 |
29 ± 2 |
3.1.3 Shape and morphology of different-sized PY nanoparticles. To discuss the size dependent adsorption of VO-79 over PY nanoparticles, it is important to investigate the surface morphology and the nanoparticles shape in the first place. Natural occurring aegirine tends to grow as elongated fibrous-like monoclinic prismatic crystals (following the c-direction) in cm sizes48 and the old name acmite was given due to the habit of the crystals to look like spear points.49 The representative SEM images of the surface of the synthetic materials (different-sized PY nanoparticle) showed morphology quite different as seen in Fig. 3a for the smallest crystalline domain size. On the other hand, larger crystalline domain sizes have primarily fiber-like shapes with elongated crystals of about 1 μm in the longest direction as seen in Fig. 3b–f which are similar to what is observed for the natural counterparts but with a difference in scale. The SEM images, when compared with the XRD and BET data, seem to suggest that the prepared materials are composed of micron-size aggregates of smaller nanoparticles.
 |
| Fig. 3 SEM images for different-sized pyroxene nanoparticles. (a) PY-10 (b) PY-21 (c) PY-34 (d) PY-54 (e) PY-62 and (f) PY-99 (line mark in the images corresponds to 1 μm). | |
Therefore, to get insights into PY nanoparticles real shapes, HRTEM images were taken for the different-sized PY nanoparticles as shown in Fig. 4. These images confirm the presence of nano-sized particles of PY. As seen in Fig. 4a and b, nanoparticles are spherical in shape for PY nanoparticles of sizes 10 and 21 nm, while the shape of the particles tend to be rod-like when the size increases between 30 and 60 nm as seen in Fig. 4c and d. The particles become sheet-like in shape for PY-62 and PY-99 nanoparticles (Fig. 4e and f). These images may be interpreted as an indication that PY-10 and PY-21 large particles are composed of smaller ones as previously suggested. This characteristic may be used to explain the larger surface area observed for these materials.
 |
| Fig. 4 HRTEM images for different-sized pyroxene nanoparticles. (a) PY-10 (b) PY-21 (c) PY-34 (d) PY-54 (e) PY-62 and (f) PY-99 (line mark in the images corresponds to 20 nm). | |
3.1.4 FTIR analysis of different-sized PY nanoparticles. Natural samples of aegirine do not show hydroxyl stretching bands unless they are exposed to some hydrothermal treatment.50 Fig. 5 shows the infrared spectra of the prepared different-sized PY nanoparticles. It is expected to see hydroxyl stretching bands centered at around 3400 cm−1 due to the hydrothermal treatment carried out for nanoparticle preparation. Yet, PY-64 and PY-99 nanoparticles do not show these bands and the explanation is that the crystallization of these larger nanoparticles required calcination of the previously hydrothermally prepared smaller PY nanoparticles at high temperatures. This causes dehydroxylation and growing of the crystal size. PY-34 nanoparticles slightly show a hydroxyl band. Therefore, hydroxyl density on the surface is needed to determine the amounts of OH moieties on each surface.
 |
| Fig. 5 Infrared spectroscopy of the prepared different-sized pyroxene nanoparticles for the hydroxyl group region. | |
3.1.5 Surface hydroxyl density. Fig. 6 shows the TGA thermograms of the prepared different-sized PY nanoparticles. The TGA curves were divided into three regimes, namely: (a) gas desorption (b) water molecules desorption, and (c) dehydroxylation of adjacent –OH groups. As seen, the percentage of weight loss from 400 °C up to 700 °C for the studied samples showed that the sample with the smallest crystalline domain sizes has the largest percentage of weight loss, indicating a higher –OH surface content as expected. The samples of different-sized PY nanoparticles lose weight due to dehydroxylation reactions, which are caused by exposure of the hydroxylated samples to high temperatures (beyond 400 °C). The analysis of hydroxyl density on the surface revealed that the calcined PY-99 and PY-64 nanoparticles did not have detectable hydroxyl groups on their surface (negligible weight loss after 400 °C). On the other hand, PY-10 nanoparticles show the highest hydroxyl density on the surface (5.7 #OH/nm2) followed by PY-21 nanoparticles (2.4 #OH/nm2). PY-34 nanoparticles have very low hydroxyl density on the surface (1.6 #OH/nm2), while PY-54 nanoparticles have (3.3 #OH/nm2). The most likely reason behind this, is that PY-34 nanoparticles have less defects on the surface which leads to less hydroxyl groups on the surface as the OH forms exclusively at defect sites.51 The quantitative hydroxyl density obtained for the different-sized PY nanoparticles shows agreement with the qualitative FTIR analysis discussed earlier.
 |
| Fig. 6 TGA thermograms of different-sized pyroxene nanoparticles with three mass regimes: (a) gas desorption (b) water molecules desorption, and (c) dehydroxylation of adjacent –OH groups. | |
3.1.6 XPS and TPD analyses of surface and structural-modified PY (functionalized PY nanoparticles). The XPS semi quantitative analysis was used to determine the elemental and the surface composition of the functionalized PY nanoparticles. The XPS atomic ratios for functionalized PY nanoparticles by ion exchange (PY–Ca and PY–H) given in Table 5 revealed that the atomic ratios of Si/Na increased significantly when compared to nominal ratio of Si/Na (valued at 2.0) of unmodified PY nanoparticles (ESI, Table S3†). Also Na/Fe values decreased, suggesting that ion exchange was successfully introduced on the surface that was enriched with Na. The ratio Si/Na for the doped element Zr showed that Zr slightly substituted silicon atoms. However, for PY–Ce nanoparticles, in which Ce replaced Fe the ratio Si/Fe is lower than the expected implying that the surface of PY is deficient in Fe. Interestingly, the atomic ratios Si/Na and O/Si for PY–Ni decreased. This could be attributed to that Ni on the surface of PY nanoparticles could be occupying sites similar to the Na atoms. On the other hand, Ni may be bonded to surface oxygen atoms after the calcination treatment was applied.31
Table 5 XPS atomic ratios of surface and structural-modified PY nanoparticles
Ratio |
Si/Fe |
Si/Na |
Na/Fe |
O/Si |
Si/Zr |
Si/Ce |
Si/Ca |
Si/Ni |
Unmodified PY |
2.7 |
2.5 |
1.1 |
3.4 |
— |
— |
— |
— |
PY–Zr |
2.4 |
1.8 |
1.3 |
3.1 |
28.1 |
— |
— |
— |
PY–Ce |
2.7 |
2.5 |
1.1 |
3.1 |
— |
7.1 |
— |
— |
PY–Ca |
2.9 |
4.4 |
0.7 |
2.9 |
— |
— |
24.8 |
— |
PY–H |
3.0 |
4.1 |
0.7 |
2.8 |
— |
— |
— |
— |
PY–Ni |
2.2 |
2.1 |
1.1 |
3.0 |
— |
— |
— |
14.2 |
Surface acidity and basicity of functionalized PY nanoparticles were identified by the NH3-TPD and CO2-TPD methods. The results demonstrated in Table 6 confirmed that the functionalized PY nanoparticles have different surface basicity. As expected, unmodified PY nanoparticles is clearly very basic showing high uptake of CO2 due to the presence of Na atoms. CO2 chemisorption profile changes with the element used in preparation. Furthermore, as expected PY–H nanoparticles are clearly more acidic showing no affinity for CO2 rather high affinity to NH3.
Table 6 TPD-CO2 and TPD-NH3 analyses of functionalized PY nanoparticles
Functionality |
CO2 (μmol g−1) |
NH3 (μmol g−1) |
Tmax (°C) |
Unmodified PY |
810 |
— |
777 |
PY–H |
0 |
276 |
No affinity for CO2 |
PY–Ca |
26 |
— |
508 |
PY–Ce |
145 |
— |
700 |
PY–Ni |
57 |
— |
200, 863 |
PY–Zr |
438 |
— |
200, 481, 762 |
3.2 Adsorption isotherms
To validate the findings on the characteristic studies of different-sized and surface-modified PY nanoparticles and to better understand their adsorption properties, macroscopic solution phase adsorption isotherms of VO-79 molecule were performed to quantify surface coverage on these different nanoparticles.
3.2.1 Effect of nanoparticle size. Fig. 7 shows the amount of VO-79 adsorbed onto different-sized PY nanoparticles at 25 °C. For fair comparison purposes, the adsorption results were presented on a normalized BET surface area basis (μmol m−2). To further understand this adsorption behavior, the experimental isotherm data were fitted to the Sips model, also known as “Langmuir–Freundlich” isotherm, as expressed by eqn (3). |
 | (3) |
where Qe is the number of moles of VO-79 adsorbed per surface area of the dried nanoparticles (μmol m−2), Ce is the equilibrium concentration of VO-79 in the supernatant (μmol L−1), Qm is the maximum adsorption capacity for complete monolayer coverage (μmol m−2), Ks is the equilibrium constant of adsorption reaction related to the adsorption affinity (L μmol−1)ns, ns is the Sips constant related to the heterogeneity factor (unitless). The non-linear Chi-square analysis (χ2) was used to evaluate the goodness of fitting results.52 Table 7 lists the estimated values of the model parameters and χ2. All of the Sips model parameters and the non-linear Chi-square analyses were preformed using OriginPro 8 SR4 software Version 8.0951. As seen in Fig. 7, an excellent agreement between the Sips model and the experimental data was achieved, and this was also indicated by the low values of χ2 shown in Table 7.
 |
| Fig. 7 Macroscopic solution adsorption isotherms of VO-79 onto different-sized pyroxene nanoparticles. Experimental conditions are: nanoparticles dose, 10 g L−1; shaking rate, 200 rpm; contact time, 24 h; and temperature, 25 °C. The symbols are experimental data, and the solid lines are from the Sips model (eqn (3)). | |
Table 7 Estimated Sips isotherm constants for the adsorption of VO-79 over different-sized pyroxene nanoparticles at temperature of 25 °C
Particle size (nm) |
Sips model parameters |
Ks ± 0.002 (L μmol−1)ns × 102 |
Qm ± 0.060 (μmol m−2) |
ns ± 0.180 (unitless) |
χ2 |
10 |
0.16 |
0.26 |
1.34 |
5.33 × 10⁻⁶ |
21 |
0.15 |
0.25 |
1.23 |
5.00 × 10⁻⁵ |
34 |
2.13 |
0.99 |
0.65 |
1.06 × 10⁻⁴ |
54 |
1.77 |
0.93 |
0.84 |
2.41 × 10⁻⁵ |
62 |
0.97 |
0.60 |
0.72 |
2.64 × 10⁻⁵ |
99 |
0.13 |
0.09 |
1.61 |
1.33 × 10⁻⁴ |
As seen in Fig. 7, for all cases, the PY nanoparticles succeeded in removing VO-79. The adsorption of VO-79 increased at low equilibrium concentration and further gradually increased at high concentration, suggesting that PY nanoparticles have a high sorption affinity for VO-79 even at low concentration. VO-79 comprises polar carbonyl groups, hydrogen bonding to the surface and structural backbone of PAHs plus alkyl side chains. Either carbonyl group or PAHs can interact with the exposed iron on PY nanoparticle surface. The non-polar alkyl side chains are not expected to interact with the PY polar surface. Nonetheless, they may interact between different VO-79 molecules and produce some of the ordering as the intermolecular π–π interactions in the solid film of VO-79 are enhanced by poor solvent producing H-type aggregates arrangement of VO-79 as proposed by Shi et al.53 These nanoaggregates are composed of PAHs that tend to form short cylinders in toluene of less than 11 PAHs monomers.54 The molecules in the H-type aggregates are arranged in a “face-to-face” stacked structure which promote better adsorption.55
As seen, when normalized to BET surface area, there are significant differences in the adsorption of VO-79 molecules from toluene onto different-sized PY nanoparticles. Worth noting here that when the adsorption data is expressed on a mass basis (i.e., μmol g−1), the order of adsorption would be different. However, for developing a mechanistic interpretation of heavy hydrocarbon (e.g., VO-79) adsorption onto nanoparticle surfaces, the surface-area normalized data are the most useful for comparing different nanoadsorbents. The Qmax values showed that PY nanoparticles in the range 30–60 nm have the highest adsorption uptake. Whereas, lesser and fluctuated uptake values are obtained for the other particle sizes. The Sips isotherm model is used to predict the adsorption on heterogeneous system circumventing the limitation of the rising adsorbate concentration associated with Freundlich isotherm model.56 The value of ns in the Sips model plays a major role in determining the interaction type between VO-79 and the surface of PY nanoparticles. It is in particular related to the existence of lateral interactions between adsorbed molecules which is not considered in the Langmuir theory.57 Thus, the ns value for PY-34 is 0.65, where 0 < ns < 1 would correspond to the system heterogeneity.57 Unexpectedly, particle sizes 34 nm and 54 nm have the highest adsorption capacities (position of plateau) and affinity (initial slope of the isotherm curve) when compared to the other particle sizes with higher surface areas. Nonetheless, PY-34 cannot be stated as an optimum particle size as there is no clear trend for the adsorption behavior of the other particle sizes. The most likely explanation of this result is that the particle shape could impart such behavior of PY nanoparticles, as the shape of the particle is rod-like in the range between 30 and 60 nm. Concurrently, less hydroxyl surface content provides more chances for the VO-79 molecules to be adsorbed and attached on the surface active sites of PY nanoparticles. Hence, the effect of high hydroxylation of the surface in the PY nanostructure smaller than the range of 30–60 nm would impact the adsorption capacity of PY nanoparticles. These findings are in excellent agreement with our group recent study on effect of nanosize of NiO nanoparticle on adsorption of quinolin-65.42 Worth noting here that the as prepared nano-pyroxenes showed markedly higher values of adsorption capacity for VO-79 molecules when compared to conventional adsorbent, macroporous kaolin.58
3.2.2 Effect of surface and structural modification. Fig. 8 shows the experimental adsorption isotherms of VO-79 onto different functionalized PY nanoparticles together with the Sips model fitting. The agreement between Sips model and the experimental data was achieved, as seen in Fig. 8 and indicated by the low values of χ2 (Table 8). Clearly, modifying the PY nanoparticle surface or structure by different functionalities would double the adsorption uptake, where PY–H nanoparticles have the highest adsorption affinity and capacity.
 |
| Fig. 8 Macroscopic solution adsorption isotherms of VO-79 onto different functionalized pyroxene nanoparticles. Experimental conditions are: nanoparticles dose, 10 g L−1; shaking rate, 200 rpm; contact time, 24 h; and temperature, 25 °C. The symbols are experimental data, and the solid lines are from the Sips model (eqn (3)). | |
Table 8 Estimated Sips isotherm constants for the adsorption of VO-79 over functionalized PY nanoparticles at temperature of 25 °C
Modified PY |
Sips model parameters |
Ks ± 0.002 (L μmol−1)ns × 102 |
Qm ± 0.080 (μmol m−2) |
ns ± 0.124 (unitless) |
χ2 |
PY–H |
0.39 |
1.35 |
1.13 |
5.56 × 10⁻⁴ |
PY–Ca |
0.21 |
1.25 |
1.20 |
7.11 × 10⁻⁴ |
PY–Ni |
0.06 |
0.99 |
1.44 |
4.36 × 10⁻⁴ |
PY–Ce |
0.22 |
0.89 |
1.18 |
4.05 × 10⁻⁴ |
PY–Zr |
0.28 |
0.69 |
1.14 |
2.06 × 10⁻⁴ |
The unmodified PY nanoparticles have only Lewis type acidity. Hence, incorporating Brønsted acid sites by ion exchange with protons modified the surface of PY nanoparticles31 and increased its acidity, and consequently, doubled its adsorption capacity. Moreover, as confirmed by the TPD results having an acidic surface will attract VO-79 molecule which has oxygen anchoring sites that will interact with the proton sites on the surface of the PY nanoparticles.
Fig. 9a shows the surface (001) with the original sodium ions present on the surface. The sodium ions on this surface are located in the middle of the “pockets” generated by the oxygen and silicon atoms. Replacing the sodium by calcium is peculiar because two sodium atoms must leave the surface for one calcium atom to be exchanged because of the 2+ charge, and thus, there are empty “pockets” when calcium is exchanged as can be seen in Fig. 9b. This behavior seems interesting as it looks like that the iron atoms below are more exposed than when sodium atoms cover all the pockets. Finally, for the case of protons (Fig. 9c), each sodium atom is replaced by a proton, however, protons are very small and they tend to bond with one of the oxygen closer to the iron, which is giving the negative charge to the structure, making the “pockets” to be open and the iron atoms more accessible. The presence of these open “pockets” giving iron more area of exposition may explain why the PY–H and PY–Ca nanoparticles samples showed the best VO-79 uptake (Fig. 8), indicating in this way the importance of surface morphology, topology and chemical composition towards the adsorption of selective organic molecules as in the case of VO-79 and aegirine. Further, the adsorption capacity of the VO-79 over functionalized PY nanoparticles decreases in the order of PY–H > PY–Ca > PY–Ni > PY–Ce > PY–Zr. The ns value for PY–H nanoparticles is 1.13 where ns > 1, suggesting that the system is not fully Langmuirian.57 By having a meticulous comparison on macroscopic adsorption isotherms between Fig. 7 and 8 along with the Sips model parameters for unmodified PY nanoparticles (PY-34 from Table 7) and all other functionalized PY nanoparticles (Table 8), it is obvious that the adsorption uptake has been significantly improved by the surface or structural modification of PY nanoparticles.
 |
| Fig. 9 CPK (001) optimized surface structures of aegirine drawn with the BIOVIA Builder module.24 (a) Surface (001) with original sodium atoms; (b) surface (001) with calcium replacing the original sodium atoms and (c) surface (001) with protons replacing the original sodium atoms. Green atoms represent sodium, bright blue atoms represent calcium, red atoms represent oxygen, blue atoms represent iron, yellow atoms represent silicon, and white atoms represent hydrogen. | |
3.2.3 Effect of heat-treating time. Temperature is a fundamental factor to accelerate the crystallization under the hydrothermal conditions during the synthesis of adsorbent and catalyst.31 As previously mentioned in Section 3.1.2, heat-treating times have no significant effect on the particle sizes of produced PY nanoparticles at different heat-treating times, in agreement with previous studies on heat treating effect. To further investigate the effect of heat-treating time on the synthesis of PY nanoparticles, batch adsorption of VO-79 over PY nanoparticles prepared at different heat-treating times were performed at two different initial concentrations of VO-79. The results are described in Fig. 10. As anticipated, VO-79 adsorption onto PY nanoparticles was not impacted with the heat-treating regardless of its initial concentration, probably due to the similar particle sizes of prepared PY nanoparticles obtained at different heat-treating times. This confirms that there is no sintering time effect during synthesis. These findings highlight the advantage of synthesizing stabilized PY nanoparticles with a large window of time for their crystallization enhancing the probability of scale up of such nanotechnological materials.
 |
| Fig. 10 Synthesis heat-treating time effect of PY nanoparticles on adsorption of VO-79. Experimental conditions are: initial concentrations of VO-79, 140 and 700 μmol L−1; nanoparticles dose, 10 g L−1; shaking rate, 200 rpm; contact time, 24 h; and temperature, 25 °C. | |
4. Conclusions
The development of simple, environmental, and low cost silicate-based nanoparticles will be an alternative for other metal oxide-based nanoparticles and will be promising for the future in situ unconventional oil upgrading. Identifying how the particles size, shape, and functionality play role on adsorption capacity of pyroxene (PY) nanoparticles, these nanoparticles can be redesigned to maximize their adsorption efficiency. PY nanoparticles were synthesized with different particle sizes, surface and structural functionalities, and synthesis times. Consequently, the prepared PY nanoparticles were applied for the adsorptive removal of VO-79 toluene-based solutions. The in-house prepared different-sized and surface-structural-modified PY nanoparticles were characterized by different characterization techniques like XRD, BET, FTIR, TGA, TPD-CO2, TPD-NH3, XPS, SEM and HRTEM. The macroscopic adsorption isotherms of VO-79 onto different nanoparticles were conducted and described by the Sips isotherm model. The adsorption capacity of PY nanoparticles in the range between 30 and 60 nm was the highest among the different particle sizes (on a surface area basis). On the other hand, surface protonation of PY nanoparticles had doubled the adsorption capacity. Heat-treating times had no significant effect on the particle sizes of produced PY nanoparticles and the posterior adsorption of VO-79. On the basis of the promising parametrized findings presented in this study, we believe that the futuristic applications of PY nanoparticles will be favorable for in situ adsorption of asphaltenes from crude oil matrix.
Acknowledgements
The authors are grateful to the Natural Sciences and Engineering Research Council of Canada (NSERC), Nexen-CNOOC Ltd, and Alberta Innovates-Energy and Environment Solutions (AIEES) for the financial support provided through the NSERC/NEXEN/AIEES Industrial Research Chair in Catalysis for Bitumen Upgrading. Also, the contribution of facilities from the Canada Foundation for Innovation, the Institute for Sustainable Energy, Environment and Economy, the Schulich School of Engineering and the Faculty of Science at the University of Calgary are greatly appreciated. A special acknowledgement to Dr Josefina Scott for performing XPS analysis, Dr Agenis Aguero for providing metal analysis, Dr Azfar Hassan for thorough elaborations on TPD test, Dr Chris Debuhr for access to the Instrumentation Facility for Analytical Electron Microscopy at the University of Calgary and Dr Tobias Fürstenhaupt for access to the Microscopy and Imaging Facility of the Health Science Center at the University of Calgary which receives support from the Canadian Foundation for Innovation and the Alberta Science and Research Authority.
References
- G. A. Olah, Angew. Chem., Int. Ed., 2005, 44, 2636–2639 CrossRef CAS PubMed.
- S. Shafiei and R. A. Salim, Energy Policy, 2014, 66, 547–556 CrossRef CAS.
- A. García-Olivares and J. Ballabrera-Poy, Technol. Forecast. Soc. Change, 2015, 90, 587–598 CrossRef.
- I. E. Agency, World Oil Demand, https://www.iea.org/oilmarketreport/tables/, accessed July 20th, 2015.
- N. N. Nassar, in Applications of Nanomaterials for Water Quality, Future Science Ltd, 2013, pp. 52–65 Search PubMed.
- S. Betancur, J. C. Carmona, N. N. Nassar, C. A. Franco and F. B. Cortés, Ind. Eng. Chem. Res., 2016, 55(21), 6122–6132 CrossRef CAS.
- Y. Li and G. A. Somorjai, Nano Lett., 2010, 10, 2289–2295 CrossRef CAS PubMed.
- C. E. Galarraga and P. Pereira-Almao, Energy Fuels, 2010, 24, 2383–2389 CrossRef CAS.
- A. Vasquez, Synthesis, characterization and model reactivity of ultra dispersed catalysts for hydroprocessing, M.Sc. thesis, University of Calgary, http://www.ezproxy.lib.ucalgary.ca/login?url=http://search.proquest.com.ezproxy.lib.ucalgary.ca/docview/304898856?accountid=9838, accessed June 21st, 2015.
- R. Hashemi, N. N. Nassar and P. Pereira Almao, Energy Fuels, 2014, 28, 1338–1350 CrossRef CAS.
- R. Hashemi, N. N. Nassar and P. Pereira Almao, Energy Fuels, 2014, 28, 1351–1361 CrossRef CAS.
- R. Hashemi, N. N. Nassar and P. Pereira Almao, Energy Fuels, 2013, 27, 2194–2201 CrossRef CAS.
- N. N. Nassar, S. Betancur, S. Acevedo, C. A. Franco and F. B. Cortés, Ind. Eng. Chem. Res., 2015, 54, 8201–8211 CrossRef CAS.
- C. A. Franco, N. N. Nassar, M. A. Ruiz, P. Pereira-Almao and F. B. Cortés, Energy Fuels, 2013, 27, 2899–2907 CrossRef CAS.
- C. A. Franco, M. M. Lozano, S. Acevedo, N. N. Nassar and F. B. Cortés, Energy Fuels, 2016, 30, 264–272 CrossRef CAS.
- N. N. Nassar, A. Hassan and G. Vitale, Appl. Catal., A, 2014, 484, 161–171 CrossRef CAS.
- N. N. Nassar, A. Hassan, G. Luna and P. Pereira-Almao, Catal. Today, 2013, 207, 127–132 CrossRef CAS.
- A. Hassan, F. Lopez-Linares, N. N. Nassar, L. Carbognani-Arambarri and P. Pereira-Almao, Catal. Today, 2013, 207, 112–118 CrossRef CAS.
- I. V. Chernyshova, S. Ponnurangam and P. Somasundaran, J. Am. Chem. Soc., 2011, 133, 9536–9544 CrossRef CAS PubMed.
- I. V. Chernyshova, S. Ponnurangam and P. Somasundaran, J. Catal., 2011, 282, 25–34 CrossRef CAS.
- Z. Wen, K. Madhavi, G. C. David and C. Yongsheng, Nanotechnology, 2010, 21, 355103 CrossRef PubMed.
- G. Rubasinghege, R. W. Lentz, M. M. Scherer and V. H. Grassian, Proc. Natl. Acad. Sci. U. S. A., 2010, 107, 6628–6633 CrossRef CAS PubMed.
- A. Navrotsky, Int. J. Quantum Chem., 2009, 109, 2647–2657 CrossRef CAS.
- V. H. Grassian, J. Phys. Chem. C, 2008, 112, 18303–18313 CAS.
- I. V. Chernyshova, M. F. Hochella Jr and A. S. Madden, Phys. Chem. Chem. Phys., 2007, 9, 1736–1750 RSC.
- N. N. Nassar, A. Hassan and P. Pereira-Almao, Energy Fuels, 2011, 25, 3961–3965 CrossRef CAS.
- M. Nobuo, Can. Mineral., 1989, 27, 143–156 Search PubMed.
- R. Stalder, A. Karimova and J. Konzett, Contributions to Mineralogy and Petrology, Beitr. Mineral. Petrogr., 2015, 169, 38 Search PubMed.
- R. M. Thompson, R. T. Downs and G. J. Redhammer, Am. Mineral., 2005, 90, 1840–1851 CrossRef CAS.
- M. Cameron, Am. Mineral., 1981, 66, 1–50 CAS.
- G. Vitale, Iron Silicate Nano-Crystals as Potential Catalysts or Adsorbents for Heavy Hydrocarbons Upgrading, Ph.D. thesis, University of Calgary, http://www.theses.ucalgary.ca/handle/11023/557, accessed January 27th, 2015.
- F. López-Linares, L. Carbognani, M. F. González, C. Sosa-Stull, M. Figueras and P. Pereira-Almao, Energy Fuels, 2006, 20, 2748–2750 CrossRef.
- A. El-Qanni, N. N. Nassar, G. Vitale and A. Hassan, J. Colloid Interface Sci., 2016, 461, 396–408 CrossRef CAS PubMed.
- B. M. Studio, BIOVIA Materials Studio Modeling and Simulation Software Version 7.0, Dassault Systemes, http://wwwaccelrys.com/products/materials-studio/, accessed Febreuary 19th, 2015 Search PubMed.
- C. Corporation, ChemDraw V14 Structural Drawing Software, http://www.cambridgesoft.com/support/DesktopSupport/Documentation/ChemDrawPlugin/, accessed Dcember 20th, 2015 Search PubMed.
- M. S. Cameron, C. T. Prewitt and J. J. Papike, Am. Mineral., 1973, 85, 594–618 Search PubMed.
- JADE V 7.5.1 XRD, Pattern Processing Identification & Quantification, https://www.jadeworld.com/developer-center/download-jade/, accessed January 14th, 2014 Search PubMed.
- J. Laugier and B. Bochu, CELREF v.3 Program for Unit Cell Refinement, http://www.ccp14.ac.uk/tutorial/lmgp/celref.htm, accessed November 2nd, 2015 Search PubMed.
- N. N. Nassar, A. Hassan and P. Pereira-Almao, Energy Fuels, 2011, 25, 1017–1023 CrossRef CAS.
- R. Mueller, H. K. Kammler, K. Wegner and S. E. Pratsinis, Langmuir, 2003, 19, 160–165 CrossRef CAS.
- M. Abboud, M. Turner, E. Duguet and M. Fontanille, J. Mater. Chem., 1997, 7, 1527–1532 RSC.
- N. N. Marei, N. N. Nassar and G. Vitale, Phys. Chem. Chem. Phys., 2016, 18, 6839–6849 RSC.
- G. J. Redhammer, G. Amthauer, G. Roth, G. Tippelt and W. Lottermoser, Am. Mineral., 2006, 91, 1271–1292 CrossRef CAS.
- A. Decarreau, S. Petit, P. Vieillard and N. Dabert, Eur. J. Mineral., 2004, 16, 85–90 CrossRef CAS.
- S. Saedy, M. Haghighi and M. Amirkhosrow, Particuology, 2012, 10, 729–736 CrossRef CAS.
- E. Aghaei and M. Haghighi, Powder Technol., 2015, 269, 358–370 CrossRef CAS.
- J. Yu, G. Wang, B. Cheng and M. Zhou, Appl. Catal., B, 2007, 69, 171–180 CrossRef CAS.
- C. K. Shearer and L. M. Larsen, Am. Mineral., 1994, 79, 340–352 CAS.
- J. F. Williams, Annual Report of the Geological Survey of Arkansas, Arkansas, USA, 1891 Search PubMed.
- E. Murad, Norw. J. Geol., 2006, 86, 435–438 CAS.
- C. X. D. Cappus, D. Ehrlich, B. Dillmann, C. A. Ventnce Jr, K. Al Shamery, H. Kuhlenbeck and H.-J. Freund, Chem. Phys., 1993, 177, 533–546 CrossRef.
- D. C. Montgomery and G. C. Runger, Applied statistics and probability for engineers, John Wiley & Sons, New York, 4th edn, 2006 Search PubMed.
- M.-M. Shi, Y. Chen, Y.-X. Nan, J. Ling, L.-J. Zuo, W.-M. Qiu, M. Wang and H.-Z. Chen, J. Phys. Chem. B, 2011, 115, 618–623 CrossRef CAS PubMed.
- J. D. Cyran and A. T. Krummel, J. Chem. Phys., 2015, 142, 212435 CrossRef PubMed.
- H. Liu, L. Shen, Z. Cao and X. Li, Phys. Chem. Chem. Phys., 2014, 16, 16399–16406 RSC.
- K. Y. Foo and B. H. Hameed, Chem. Eng. J., 2010, 156, 2–10 CrossRef CAS.
- M. Choimet, A. Tourrette and C. Drouet, J. Colloid Interface Sci., 2015, 456, 132–137 CrossRef CAS PubMed.
- M. F. González, C. S. Stull, F. López-Linares and P. Pereira-Almao, Energy Fuels, 2007, 21, 234–241 CrossRef.
Footnote |
† Electronic supplementary information (ESI) available: Effect of nanosized and surface-structural-modified nano-pyroxene on adsorption of violanthrone-79. See DOI: 10.1039/c6ra05838h |
|
This journal is © The Royal Society of Chemistry 2016 |
Click here to see how this site uses Cookies. View our privacy policy here.