DOI:
10.1039/C6RA05648B
(Paper)
RSC Adv., 2016,
6, 35295-35304
Facile preparation of hyaluronic acid-modified Fe3O4@Mn3O4 nanocomposites for targeted T1/T2 dual-mode MR imaging of cancer cells†
Received
3rd March 2016
, Accepted 1st April 2016
First published on 4th April 2016
Abstract
We report a facile approach to synthesizing hyaluronic acid (HA)-modified Fe3O4@Mn3O4 nanocomposites (NCs) for targeted T1/T2 dual-mode magnetic resonance (MR) imaging of cancer cells. In this work, branched polyethyleneimine (PEI)-coated Fe3O4@Mn3O4 NCs (Fe3O4@Mn3O4-PEI NCs) were first synthesized via a one-pot hydrothermal route, followed by modification of HA on the particle surface via PEI amines. The formed Fe3O4@Mn3O4-PEI-HA NCs were well characterized via different techniques. Our results manifest that the formed Fe3O4@Mn3O4-PEI-HA NCs possess good water dispersibility, colloidal stability, cytocompatibility in the studied concentration range, and targeting specificity to CD44 receptor-overexpressing cancer cells. Due to the coexistence of Fe3O4 and Mn3O4 in the particles, the Fe3O4@Mn3O4-PEI-HA NCs display relatively high r2 (143.26 mM−1 s−1) and r1 (2.15 mM−1 s−1) relaxivities, and can be used as an efficient nanoprobe for targeted T1/T2 dual-mode MR imaging of cancer cells in vitro. The developed Fe3O4@Mn3O4-PEI-HA NCs may hold great promise to be used as a nanoplatform for theranostics of different biological systems.
Introduction
Early-stage diagnosis of cancer is critical to decrease the death rate.1 The presently used diagnostic techniques include magnetic resonance (MR) imaging,2–4 computed tomography (CT) imaging,5–7 optical imaging,8,9 ultrasonic (US) imaging,10,11 and position emission tomography (PET) imaging,12,13 etc. Although each imaging modality has its own advantages, single mode imaging usually fails to provide complete and accurate information of the diseases.14,15 Therefore, it is strongly recommended to develop dual mode or multi-mode imaging techniques for disease diagnosis with improved accuracy, such as T1/T2-weighted MR imaging,16–19 MR/CT imaging,20–22 MR/optical imaging,23,24 MR/US imaging,25–27 and MR/PET imaging.28,29
For high quality molecular imaging applications, contrast agents are generally required. For instance, gadolinium (Gd)- or manganese (Mn)-based nanodevices have been widely studied for T1-weighted MR imaging;30–32 superparamagnetic iron oxide (Fe3O4) nanoparticles (NPs) are used as ideal probes for T2-weighted MR imaging;33,34 gold (Au) NPs have received much attention as contrast agents for CT imaging;35,36 and quantum dots have been designed for optical imaging.37,38 Currently, multifunctional nanocomposites (NCs) consisting of different imaging components have been proposed as molecular probes for dual- or multi-mode imaging applications. As an example, Yang et al.39 developed a multifunctional Gd-labeled Fe3O4 NPs for targeted T1- and T2-weighted dual-mode MR imaging of tumors. An et al.40 synthesized hollow silica nanospheres with a size of 400 nm and conjugated them with Gd(III) complexes and arginine–glycine–aspartic acid peptide for targeted MR/US dual-modal imaging of tumors. In our previous work,41,42 we fabricated Fe3O4@Au NC particles via the combination of layer-by-layer self-assembly process and dendrimer chemistry for dual-mode MR/CT imaging applications. These prior successes witnessed the rapid development of imaging probes for biomedical applications. However, preparation of multifunctional NCs for dual mode accurate disease diagnosis still remains an open area and offer great challenges.
Recently, we developed a facile one-pot hydrothermal route to synthesize Fe3O4 NPs,43 3-aminopropyltriethoxysilane (APTS)-coated Fe3O4 NPs,44 and polyethyleneimine (PEI)-coated Fe3O4 NPs (Fe3O4-PEI NPs).45 Especially, the formed Fe3O4-PEI NPs can be further modified with targeting ligands folic acid (FA) or hyaluronic acid (HA) for targeted MR imaging of tumors overexpressing FA receptors (FAR) or CD44 receptors, respectively.46–48 Further, the hydrothermal route can be extended to synthesize Fe3O4@Au composite NPs or gadolinium hydroxide (Gd(OH)3)-doped Fe3O4 NPs for highly efficient in vivo dual-mode MR/CT and T1/T2-weighted MR imaging, respectively.49,50 Recently, manganese oxide (Mn3O4) NPs were well developed as contrast agents for T1-weighted MR imaging applications because of their high relaxivities and good biocompatibility.3,51 In addition, it has been reported that Mn3O4 NPs can be prepared by a facile hydrothermal route.52,53 It is reasonable to speculate that Fe3O4@Mn3O4 NCs may also be prepared by a hydrothermal route for T1/T2-weighted MR imaging applications.
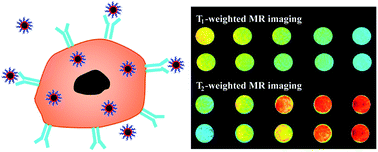
In this present work, we present a facile hydrothermal method to synthesize PEI-coated Fe3O4@Mn3O4 NCs. The PEI-coated Fe3O4@Mn3O4 NCs were then conjugated with targeting ligand HA for targeted T1- and T2-weighted dual-mode MR imaging applications (Scheme 1). The formed Fe3O4@Mn3O4-PEI-HA NCs were characterized via different techniques. The cytotoxicity of the NCs, the binding specificity of the Fe3O4@Mn3O4-PEI-HA NCs to CD44 receptor-overexpressing cancer cells, and the potential to use the NCs for T1- and T2-weighted MR imaging of cancer cells in vitro were investigated in detail. To our knowledge, this is the first report related to the development of Fe3O4@Mn3O4-PEI-HA NCs via a hydrothermal method for dual mode T1- and T2-weighted MR imaging of cancer cells.
 |
| Scheme 1 Schematic representation of the synthesis of the Fe3O4@Mn3O4-PEI-HA NCs. | |
Experimental
Materials
Branched PEI (Mw = 25
000) was supplied by Sigma-Aldrich (St. Louis, MO). HA (Mw = 31
200) was obtained from Zhenjiang Dong Yuan Biotechnology Corporation (Zhenjiang, China). 1-Ethyl-3-[3-dimethylaminopropyl]carbodiimide hydrochloride (EDC) and N-hydroxysuccinimide (NHS) were purchased from J&K Chemical Ltd. (Shanghai, China). HeLa cells (a human cervical carcinoma cell line) were from Institute of Biochemistry and Cell Biology, the Chinese Academy of Sciences (Shanghai, China). Dulbecco's modified Eagle medium (DMEM), fetal bovine serum (FBS), penicillin, and streptomycin were obtained from Jinuo Biomedical Technology (Hangzhou, China). Ferrous chloride tetrahydrate (FeCl2·4H2O), manganese acetate (MnAc·4H2O), dimethyl sulfoxide (DMSO) and all other chemicals and solvents were from Sinopharm Chemical Reagent Co., Ltd. (Shanghai, China) and used as received. 3-(4,5-Dimethylthiazol-2-yl)-2,5-diphenyltetrazolium bromide (MTT) was acquired from Shanghai Sangon Biological Engineering Technology & Services Co., Ltd. (Shanghai, China). Water in all experiments was purified using a Milli-Q Plus 185 water purification system (Millipore, Bedford, MA) with a resistivity higher than 18.2 MΩ cm.
Synthesis of Fe3O4@Mn3O4-PEI NCs
The Fe3O4@Mn3O4-PEI NCs were prepared through a previously reported hydrothermal route with some modifications.45,50 Briefly, FeCl2·4H2O (0.10 g, 0.50 mmol) and MnAc·4H2O (1.55 g, 6.33 mmol) were first co-dissolved in water (7.75 mL). Then, ammonium hydroxide (6.25 mL) was added into the above mixture under vigorous magnetic stirring and the suspension was left stirring in the air atmosphere for 40 min. After that, the reaction mixture together with an aqueous solution of PEI (0.50 g dissolved in 5 mL water) was transferred into a 50 mL autoclave (KH-50 autoclave, Shanghai Yuying Instrument Co., Ltd., Shanghai, China). The reaction mixture was blended thoroughly and then sealed. After reaction at 160 °C for 16 h, the autoclave was cooled down to room temperature. The product was collected by magnetic separation, washed with water for several times, and then dispersed in DMSO or water (9 mg mL−1) for further use.
Synthesis of Fe3O4@Mn3O4-PEI-HA NCs
The conjugation of HA onto the surface of Fe3O4@Mn3O4-PEI NCs was performed according to our previous work.47 Briefly, 5 mL of DMSO solution containing EDC (4.80 mg) and NHS (2.90 mg) was added dropwise into an aqueous solution of HA (78.12 mg, 5 mL) under vigorous magnetic stirring. After 3 h, the activated HA was added dropwise into a DMSO solution of Fe3O4@Mn3O4-PEI NCs (45 mg, 5 mL). The reaction mixture was continuously shaken for 3 days, then the product was collected by magnetic separation and sequentially washed with DMSO and water for several times. Finally, the formed Fe3O4@Mn3O4-PEI-HA NCs were redispersed in 15 mL water and stored at 4 °C for further use.
Characterization techniques
X-ray diffraction (XRD) was performed using a Rigaku D/max 2550 PC X-ray diffractometer (Tokyo, Japan) equipped with a Cu Kα radiation (λ = 0.154056 nm, 40 kV, 200 mA) in the scan range (2θ) of 10° to 90°. A Malvern Zetasizer Nano ZS model ZEN3600 (Worcestershire, UK) equipped with a standard 633 nm laser was used to measure the surface potential and hydrodynamic size of the particles. Thermal gravimetric analysis (TGA) was carried out on a TG 209 F1 (NETZSCH Instruments Co., Ltd., Bavaria, Germany) thermogravimetric analyzer under nitrogen from 30 °C to 800 °C at a rate of 20 °C min−1. TEM images were taken using a JEOL 2010F transmission electron microscopy (JEOL, Tokyo, Japan) operating at 200 kV and the samples were prepared by dropping 7 μL of the water suspension onto a carbon-coated copper grid and left until dried. A Leeman Prodigy inductively coupled plasma-atomic emission spectroscopy (ICP-AES) system (Hudson, NH) was used to analyze the element concentration of the solution. The T1/T2 relaxation times of the particle suspension with different Fe concentrations (0.005–0.08 mM) or Mn concentrations (0.0125–0.2 mM) in water were measured by a 0.5 T NMI20-Analyst NMR Analyzing and Imaging system (Shanghai Niumag Corporation, Shanghai, China). The parameters were set as follows: CPMG sequence, point resolution = 156 mm × 156 mm, section thickness = 0.6 mm, TR = 600 ms, TE = 160 ms, number of excitation = 1 for T1-weighted MR imaging, and CPMG sequence, point resolution = 156 mm × 156 mm, section thickness = 0.6 mm, TR = 4000 ms, TE = 60 ms, number of excitation = 1 for T2-weighted MR imaging. The relaxivity (r1 and r2) was calculated by a linear fitting of the inverse relaxation time as a function of the Fe or Mn concentration.
Cell culture
HeLa cells overexpressing CD44 receptors were cultured in DMEM supplemented with 10% heat-inactivated fetal bovine serum (FBS), penicillin (100 U mL−1), and streptomycin (100 μg mL−1) at 37 °C and 5% CO2. HeLa cells grown in normal HA-free DMEM overexpressed high-level CD44 receptors (denoted as HeLa-HCD44 cells), while HeLa cells pre-treated with 2.0 mM free HA for 2 h or longer overexpressed low-level CD44 receptors (denoted as HeLa-LCD44 cells). Unless otherwise stated, the term of HeLa cells always represents the HeLa-HCD44 cells.
Cytotoxicity assay
MTT assay was carried out to determine the cytotoxicity of the Fe3O4@Mn3O4-PEI-HA NCs. HeLa cells were seeded into 96-well plates with 200 μL fresh medium at a density of 1 × 10⁴ cells per well and cultured at 37 °C and 5% CO2 overnight. The next day, the medium was discarded and cells were incubated with fresh medium containing PBS (control) or Fe3O4@Mn3O4-PEI-HA NCs at different Mn concentrations (0.2–2.0 mM) or Fe concentrations (0.03–0.32 mM) for 24 h. Then, MTT (5 mg mL−1, in 20 μL phosphate buffered saline (PBS)) was added to each well, and the cells were further incubated at 37 °C for 4 h. Then the medium was discarded carefully and 200 μL of DMSO was added into each well to dissolve the formazan crystals. The absorbance of each well was measured at 570 nm using a Thermo Scientific Multiskan MK3 ELISA reader (Thermo scientific, Waltham, MA). The cells cultured in normal medium without supplement of MTT were used as the sample blank to eliminate the effect of particles on the absorbance. The relative cell viability was calculated according to the equation of “Cell viability = (ODsample − ODsample blank)/(ODcontrol − ODcontrol blank) × 100%”. Five parallel wells for each sample were measured to report the mean and standard deviation. Likewise, the morphology of cells after treated with the Fe3O4@Mn3O4-PEI-HA NCs at different Mn concentrations (0–2.0 mM) for 24 h was also observed by phase contrast microscopy (Leica DM IL LED inverted phase contrast microscope) with a magnification of 200 × for each sample.
In vitro cellular uptake assay
To qualitatively confirm the uptake of the Fe3O4@Mn3O4-PEI-HA NCs by HeLa cells, Prussian blue staining of cells was performed according to our previous work.45 Briefly, HeLa-HCD44 or HeLa-LCD44 cells were seeded into 24-well plates at a density of 2 × 10⁵ cells per well, and cultured for 12 h to bring the cells to confluence. Thereafter, the medium in each well was replaced with fresh medium containing the Fe3O4@Mn3O4-PEI-HA NCs at different Mn concentrations (0, 0.6, or 1.0 mM). After being continuously incubated for 6 h, the cells were washed 3 times with PBS, fixed with formaldehyde solution (2.5%) at 4 °C for 15 min, and stained with Prussian blue reagent at 37 °C for 30 min. The images of the stained cells were taken by phase contrast microscopy with a magnification of 200× for each sample.
ICP-AES was also used to quantitatively assay the in vitro cellular uptake of the Fe3O4@Mn3O4-PEI-HA NCs by HeLa-HCD44 or HeLa-LCD44 cells. Both kinds of cells were seeded into 12-well plates at a density of 2 × 10⁵ cells per well and cultured overnight to lead the cells to adherence. Then, the medium was replaced with fresh medium containing the Fe3O4@Mn3O4-PEI-HA NCs at different Mn concentrations (0–0.6 mM) and the cells were further incubated for 6 h. Afterwards, the medium was removed carefully and the cells were washed 3 times with PBS, treated with trypsin, suspended in fresh medium, and counted by hemocytometry. The remaining cells were collected by centrifugation at 1000 rpm for 5 min and lysed with 1.0 mL aqua regia solution for 24 h. The Mn content was determined by ICP-AES after the samples were diluted 2 times with PBS.
In vitro targeted T1/T2 MR imaging of cancer cells
HeLa-HCD44 or HeLa-LCD44 cells were seeded into 6-well plates at a density of 2 × 10⁶ cells per well and then cultured at 37 °C and 5% CO2 for 12 h. After discarding the medium, the cells were incubated with 2 mL fresh DMEM containing the Fe3O4@Mn3O4-PEI-HA NCs at the Mn concentration of 0, 0.1, 0.2, 0.4, 0.8 mM or Fe concentration of 0, 0.0175, 0.035, 0.07, 0.14 mM for 6 h. Next, the cells were washed with PBS for 3 times, treated with trypsin, collected by centrifugation, and resuspended in 1 mL PBS (containing 0.5% agarose) before MR imaging. Both T1- and T2-weighted MR images were acquired using a 1.5 T Signa HDxt superconductor clinical MR system (GE Medical Systems, Milwaukee, WI). The parameters were set as follows: point resolution = 156 mm × 156 mm, section thickness = 0.6 mm, TR = 500 ms, TE = 8.6 ms, and number of excitation = 1 for T1-weighted MR imaging. To perform T2-weighted MR imaging, the parameters were set as follows: point resolution = 156 mm × 156 mm, section thickness = 0.6 mm, TR = 3000 ms, TE = 90 ms, and number of excitation = 1.
Statistical analysis
One-way ANOVA analysis was carried out to evaluate the significance of the experimental data. A p value of 0.05 was chosen as the significance level, and the data were indicated with (*) for p < 0.05, (**) for p < 0.01, and (***) for p < 0.001, respectively.
Results and discussion
Synthesis and characterization of Fe3O4@Mn3O4-PEI-HA NCs
Hydrothermal method has been conveniently used to prepare Fe3O4-PEI NPs or Fe3O4@Au composite NPs for MR imaging of different biological systems.48 Herein, via the same hydrothermal approach, Fe3O4@Mn3O4-PEI NCs were formed, followed by modification of HA via EDC chemistry (Scheme 1). XRD was firstly carried out to confirm the crystalline structure of the formed Fe3O4@Mn3O4-PEI NCs (Fig. 1a). The diffraction peaks at 18.33, 29.60, 34.72, 42.62, 52.90 and 61.67° well match the (111), (220), (311), (400), (422) and (440) planes of Fe3O4 crystals (JCPDS card no. 19-0629). In addition, the peaks at 18.01, 31.20, 32.34, 35.91, 44.50, 50.10, 54.00, 56.03, 58.50, 59.64, 64.20, 65.70, 67.62, 69.81, 73.10, 74.12, 77.60, 80.51, 84.96, 86.40 and 88.11° represent the (101), (200), (103), (211), (220), (105), (312), (303), (321), (224), (400), (323), (411), (305), (420), (413), (404), (316), (431), (415) and (512) planes of the Mn3O4 crystals (JCPDS card no. 24-0734). The results of XRD pattern confirmed the formation of Fe3O4@Mn3O4 NCs.
 |
| Fig. 1 (a) XRD pattern of the Fe3O4@Mn3O4-PEI NCs; (b) TGA curves of the Fe3O4@Mn3O4-PEI and Fe3O4@Mn3O4-PEI-HA NCs. | |
HA is known to be an efficient target for CD44 receptors overexpressed on the surface of cancer cells,54 and HA with a larger Mw has a better targeting ability than the one with a lower Mw.47 Herein, HA with an Mw of 31
200 was chosen to be modified onto the surface of the Fe3O4@Mn3O4-PEI NCs. TGA was used to quantitatively characterize the weight loss of the NCs before and after the modification (Fig. 1b). It is clear that the Fe3O4@Mn3O4-PEI NCs have a weight loss of 6.70% due to the PEI coating. After further HA modification, the weight loss of the Fe3O4@Mn3O4-PEI-HA NCs increases to 8.79%. Hence, the HA modification can be deduced to be 2.09%. The surface modification of HA was also confirmed by zeta potential and dynamic light scattering (DLS) measurements (Table 1). The positive surface potential of the Fe3O4@Mn3O4-PEI NCs (30.93 ± 0.21 mV) switches to be negative after conjugation of HA to form the Fe3O4@Mn3O4-PEI-HA NCs (−20.37 ± 0.25 mV).47 In addition, the hydrodynamic size of the Fe3O4@Mn3O4-PEI-HA NCs was determined to be 292.47 ± 10.68 nm, which is much larger than that of the Fe3O4@Mn3O4-PEI NCs (213.86 ± 9.77 nm) before HA modification.
Table 1 The surface potential, hydrodynamic size, and polydispersity index (PDI) of the Fe3O4@Mn3O4-PEI and Fe3O4@Mn3O4-PEI-HA NCs. Data are provided as mean ± S.D. (n = 3)
Sample |
Surface potential (mV) |
Hydrodynamic size (nm) |
PDI |
Fe3O4@Mn3O4-PEI NCs |
30.93 ± 0.21 |
213.86 ± 9.77 |
0.28 ± 0.03 |
Fe3O4@Mn3O4-PEI-HA NCs |
−20.37 ± 0.25 |
292.47 ± 10.68 |
0.37 ± 0.02 |
TEM was used to characterize the morphology of the Fe3O4@Mn3O4-PEI-HA NCs (Fig. 2a and b). Clearly, the NCs possess a spherical or quasi-spherical shape with a mean size of 23.6 ± 6.5 nm. Some aggregated or interconnected particles can be observed in the TEM image. This is likely due to the TEM sample preparation process that includes an air-drying step of the aqueous suspension of the samples. The air drying process often leads to the aggregation or interconnection of the particles, especially for Fe3O4 NPs or Fe3O4-based composite NPs synthesized in aqueous phase.49 In addition, the size measured by TEM is much smaller than the hydrodynamic size measured by DLS in water. This is because TEM measures a single core particle in a dry state, while DLS measures the sizes of large clusters of particles in aqueous solution that may be composed of many single particles.47,50 High-resolution TEM image clearly reveals the crystal lattices of metallic oxide and transparent polymer shell (Fig. 2c). What's more, energy-dispersive spectroscopy (EDS) demonstrates the existence of Fe, Mn and O elements in the products (Fig. 2d). The elemental composition of the Fe3O4@Mn3O4-PEI-HA NCs was further analyzed by ICP-AES, where the Mn/Fe molar ratio was estimated to be 5.73
:
1. Combining the results of TGA, we can calculate that the relative amount of Fe3O4, Mn3O4, PEI and HA is 13.70%, 77.51%, 6.70% and 2.09% in the NCs, respectively. It should be pointed out that the Fe3O4@Mn3O4-PEI-HA NCs still display a strong magnetic property even if the content of Fe3O4 is very low, since they can be easily collected by a magnet in several minutes (Fig. S1†).
 |
| Fig. 2 TEM image (a), size distribution histogram (b), high-resolution TEM image (c), and EDS spectrum (d) of the Fe3O4@Mn3O4-PEI-HA NCs, respectively. | |
Prior to biological imaging applications, we checked the colloidal stability of the Fe3O4@Mn3O4-PEI-HA NCs by DLS (Fig. S2†). The hydrodynamic size of the NCs in water does not have obvious change over a period of 15 days. Besides, after exposing the Fe3O4@Mn3O4-PEI-HA NCs to water, PBS, or cell culture medium for 15 days, they are still colloidally stable and no precipitate occurs (Fig. S3†). All of these results suggest that the prepared Fe3O4@Mn3O4-PEI-HA NCs possess an excellent colloidal stability, which is amenable for MR imaging applications.
MR relaxivity measurements
Because of the favorable biocompatibility, high detection accuracy and high T2 relaxivity, Fe3O4 NPs have been used as contrast agents for T2-weighted MR imaging.48 On the other hand, Mn3O4 NPs have been reported to be a desired positive contrast agent for T1-weighted MR imaging.3 As expected, the prepared Fe3O4@Mn3O4-PEI-HA NCs may be used as a dual mode contrast agent for both T1- and T2-weighted MR imaging applications.
To explore the T1-weighted imaging performance, MR phantom studies of the Fe3O4@Mn3O4-PEI-HA NCs dispersed in water at different Mn concentrations were investigated (Fig. 3). As shown in Fig. 3a, the MR signal intensity increases as a function of the Mn concentration (0.0125–0.2 mM). The r1 relaxivity of the Fe3O4@Mn3O4-PEI-HA NCs was calculated to be 2.15 mM−1 s−1 after linear fitting of the inverse T1 relaxation time (1/T1) versus Mn concentration (Fig. 3b). It should be noted that the r1 relaxivity of the NCs is much higher than that of the previously reported Mn3O4 NPs,3,55,56 likely due to the synergistic effect of Fe3O4 and Mn3O4 on the r1 relaxivity in this situation.
 |
| Fig. 3 Color T1-weighted images (a) and linear fitting of 1/T1 (b) of the Fe3O4@Mn3O4-PEI-HA NCs with different Mn concentrations. The color bar from blue to red indicates the gradual increase of MR signal intensity. | |
To demonstrate the potential to use the NCs for T2-weighted MR imaging, MR phantom studies of the NCs as a function of Fe concentration was also carried out (Fig. 4). T2-Weighted MR images (Fig. 4a) reveal that the brightness of the MR image becomes darker with the increase of the Fe concentration. Meanwhile, the T2 relaxation rate (1/T2) increases linearly with the Fe concentration, and the slope (r2 relaxivity) is calculated to be 143.26 mM−1 s−1 (Fig. 4b). Considering the high r1 and r2 relaxivities, the developed Fe3O4@Mn3O4-PEI-HA NCs may be used as a contrast agent for dual mode T1/T2 MR imaging. It is interesting to note that the Mn/Fe molar ratio was optimized by varying the weight of precursors to have a better T1- and T2-weighted MR imaging performance. If the Mn/Fe molar ratio was higher than 5.73, the NCs displayed a reduced r2 relaxivity. Similarly, lowering the Mn/Fe molar ratio than 5.73 resulted in a reduced r1 relaxivity.
 |
| Fig. 4 Color T2-weighted images (a) and linear fitting of 1/T2 (b) of the Fe3O4@Mn3O4-PEI-HA NCs with different Fe concentrations. The color bar from red to blue indicates the gradual decrease of MR signal intensity. | |
Cytotoxicity assay
We next evaluated the cytotoxicity of the developed Fe3O4@Mn3O4-PEI-HA NCs via MTT viability assay of HeLa cells (Fig. 5). The cell viability displays a concentration-dependent effect and the viability of HeLa cells still remains above 80% even at the Mn concentration up to 2.0 mM. Our data clearly indicates that the Fe3O4@Mn3O4-PEI-HA NCs are non-cytotoxic in the given concentration range.
 |
| Fig. 5 MTT assay of HeLa cell viability after treatment with PBS (control) and the Fe3O4@Mn3O4-PEI-HA NCs at different Mn concentrations (a) and different Fe concentrations (b) for 24 h. | |
In addition, the morphology of HeLa cells treated with the Fe3O4@Mn3O4-PEI-HA NCs at different Mn concentrations for 24 h was observed by phase contrast microscopy to further assess the cytotoxicity of the NCs (Fig. S4†). Clearly, the cells display a healthy morphology after treatment with the Fe3O4@Mn3O4-PEI-HA NCs at the given concentrations, similar to the control cells treated with PBS. Taken together with the results of MTT assay, we can safely conclude that the Fe3O4@Mn3O4-PEI-HA NCs have an excellent cytocompatibility in the given concentration range.
Cellular uptake assay
The modification of HA onto the NCs is expected to render the NCs with targeting specificity to CD44 receptor-expressing cancer cells. The specific cellular uptake of the Fe3O4@Mn3O4-PEI-HA NCs by HeLa-HCD44 cells was confirmed by Prussian blue staining (Fig. 6). In contrast to control cells treated with PBS that do not display blue staining (Fig. 6a and d), cells treated with the Fe3O4@Mn3O4-PEI-HA NCs display the blue staining, and the staining is more obvious with the increase of Mn concentration for both HeLa-HCD44 and HeLa-LCD44 cells (Fig. 6b, c, e and f). More importantly, HeLa-HCD44 cells display much more obvious blue staining than HeLa-LCD44 cells under the same treatment, especially at the high Mn concentration of 1.0 mM (Fig. 6c and f).
 |
| Fig. 6 Phase contrast microscopic images of the HeLa-HCD44 cells (a–c) and HeLa-LCD44 cells (d–f) after Prussian blue staining. (a)–(c) Panels show the HeLa-HCD44 cells treated with PBS (a), and the Fe3O4@Mn3O4-PEI-HA NCs at the Mn concentration of 0.6 mM (b) or 1.0 mM (c). (d)–(f) Panels show the HeLa-LCD44 cells treated with PBS (d) and the Fe3O4@Mn3O4-PEI-HA NCs at the Mn concentration of 0.6 mM (e) or 1.0 mM (f) for 6 h. The scale bar in each panel represents 100 μm. | |
The targeted cellular uptake of the Fe3O4@Mn3O4-PEI-HA NCs by HeLa-HCD44 cells was further quantitatively confirmed by ICP-AES (Fig. 7). The cellular Mn uptake displays a concentration-dependent manner for both cells, and higher Mn concentration of the NCs leads to an increased Mn uptake in the cells. However, the Mn uptake in the HeLa-HCD44 cells is much higher than that in the HeLa-LCD44 cells at the same Mn concentrations. The enhanced cellular uptake of the NCs should be associated with the grafted HA ligands that can direct the specific targeting of the NCs to HeLa-HCD44 cells via ligand–receptor interaction, in agreement with our previous work.47,54
 |
| Fig. 7 Mn uptake by HeLa-HCD44 and HeLa-LCD44 cells after treated with PBS or Fe3O4@Mn3O4-PEI-HA NCs at the Mn concentration of 0.2, 0.4, or 0.6 mM for 6 h. | |
Targeted MR imaging of cancer cells
We next explored the feasibility to use the NCs as a probe for targeted dual mode T1/T2 MR imaging of cancer cells. We firstly applied them for targeted T1-weighted MR imaging of cancer cells in vitro (Fig. 8). As shown in Fig. 8a, the MR signal intensity increases with the Mn concentration for both cells, however the increasing trend of HeLa-HCD44 cells is much more significant than that of HeLa-LCD44 cells at the same Mn concentrations. This can be further verified by quantitative analysis of the MR signal intensity (Fig. 8b).
 |
| Fig. 8 T1-Weighted MR images (a) and MR signal intensity analysis (b) of HeLa-HCD44 and HeLa-LCD44 cells after treated with the Fe3O4@Mn3O4-PEI-HA NCs at different Mn concentrations for 6 h. | |
Different from T1-weighted MR imaging, the same probe is also able to decrease the MR signal intensity of cancer cells with the Fe concentration in the T2-weighted MR images (Fig. 9a). Thanks to the HA-mediated targeting, HeLa-HCD44 cells display a more significant MR signal intensity dropdown than HeLa-LCD44 cells at the same Fe concentrations. By plotting the MR signal intensity of the cells as function of Fe concentration (Fig. 9b), we can see that the MR signal intensity of both treated cells is much lower than that of the control cells treated with PBS, and the MR signal intensity decreases with the Fe concentration. Compared with HeLa-LCD44 cells, the HeLa-HCD44 cells show a much lower MR signal intensity at the same Fe concentrations. Our results suggest that with the HA-mediated targeting, HeLa-HCD44 cells display enhanced uptake of the NCs, thus allowing for their effective targeted T1/T2 MR imaging.
 |
| Fig. 9 T2-Weighted MR images (a) and MR signal intensity analysis (b) of HeLa-HCD44 and HeLa-LCD44 cells after treated with the Fe3O4@Mn3O4-PEI-HA NCs at different Fe concentrations for 6 h. | |
Conclusion
In summary, we successfully synthesized the Fe3O4@Mn3O4-PEI-HA NCs for targeted T1- and T2-weighted MR imaging of cancer cells. Under a hydrothermal condition, Fe3O4@Mn3O4-PEI NCs can be synthesized using mixed Fe and Mn precursors. Further conjugation of HA via EDC chemistry leads to the formation of the Fe3O4@Mn3O4-PEI-HA NCs with good water dispersibility, colloidal stability, and cytocompatibility in the given concentration range. Because of the co-existence of both Fe3O4 and Mn3O4 in the NCs, the developed probe possess a high r1 (2.15 mM−1 s−1) and r2 (143.26 mM−1 s−1) relaxivities. The developed NCs are able to be used as an effective probe for targeted dual mode T1/T2 MR imaging of cancer cells overexpressing CD44 receptors thanks to the attached HA ligand. The developed Fe3O4@Mn3O4-PEI-HA NCs may hold a great promise to be used for targeted dual mode T1/T2 MR imaging of other CD44 receptor-expressing cancer cells in vitro and in vivo.
Acknowledgements
This research is financially supported by the Science and Technology Commission of Shanghai Municipality (15520711400 for M. Shen), the Sino-German Center for Research Promotion (GZ899, for X. Shi), the Program for Professor of Special Appointment (Eastern Scholar) at Shanghai Institutions of High Learning (for X. Shi), and the Fundamental Research Funds for the Central Universities (for M. Shen).
Notes and references
- R. Siegel, D. Naishadham and A. Jemal, Ca-Cancer J. Clin., 2013, 63, 11–30 CrossRef PubMed.
- X. Shi, S. H. Wang, S. D. Swanson, S. Ge, Z. Cao, M. E. Van Antwerp, K. J. Landmark and J. R. Baker, Adv. Mater., 2008, 20, 1671–1678 CrossRef CAS.
- H. Hu, A. Dai, J. Sun, X. Li, F. Gao, L. Wu, Y. Fang, H. Yang, L. An and H. Wu, Nanoscale, 2013, 5, 10447–10454 RSC.
- X. Hu, Y. Ji, M. Wang, F. Miao, H. Ma, H. Shen and N. Jia, J. Biomed. Nanotechnol., 2013, 9, 976–984 CrossRef CAS PubMed.
- J. Zhang, C. Li, X. Zhang, S. Huo, S. Jin, F.-F. An, X. Wang, X. Xue, C. Okeke and G. Duan, Biomaterials, 2015, 42, 103–111 CrossRef CAS PubMed.
- L. Cheng, J. Liu, X. Gu, H. Gong, X. Shi, T. Liu, C. Wang, X. Wang, G. Liu and H. Xing, Adv. Mater., 2014, 26, 1886–1893 CrossRef CAS PubMed.
- L. Jing, X. Liang, Z. Deng, S. Feng, X. Li, M. Huang, C. Li and Z. Dai, Biomaterials, 2014, 35, 5814–5821 CrossRef CAS PubMed.
- G. Hong, J. T. Robinson, Y. Zhang, S. Diao, A. L. Antaris, Q. Wang and H. Dai, Angew. Chem., 2012, 124, 9956–9959 CrossRef.
- S.-T. Yang, L. Cao, P. G. Luo, F. Lu, X. Wang, H. Wang, M. J. Meziani, Y. Liu, G. Qi and Y.-P. Sun, J. Am. Chem. Soc., 2009, 131, 11308–11309 CrossRef CAS PubMed.
- H. Ke, J. Wang, S. Tong, Y. Jin, S. Wang, E. Qu, G. Bao and Z. Dai, Theranostics, 2014, 4, 12 CrossRef CAS PubMed.
- X. Zhang, Y. Zheng, Z. Wang, S. Huang, Y. Chen, W. Jiang, H. Zhang, M. Ding, Q. Li and X. Xiao, Biomaterials, 2014, 35, 5148–5161 CrossRef CAS PubMed.
- G. Wieser, R. Mansi, A. L. Grosu, W. Schultze-Seemann, R. A. Dumont-Walter, P. T. Meyer, H. R. Maecke, J. C. Reubi and W. A. Weber, Theranostics, 2014, 4, 412 CrossRef CAS PubMed.
- X. Sun, X. Huang, X. Yan, Y. Wang, J. Guo, O. Jacobson, D. Liu, L. P. Szajek, W. Zhu and G. Niu, ACS Nano, 2014, 8, 8438–8446 CrossRef CAS PubMed.
- T. Zhou, B. Wu and D. Xing, J. Mater. Chem., 2012, 22, 470–477 RSC.
- D. Kim, M. K. Yu, T. S. Lee, J. J. Park, Y. Y. Jeong and S. Jon, Nanotechnology, 2011, 22, 155101 CrossRef PubMed.
- K. H. Bae, Y. B. Kim, Y. Lee, J. Hwang, H. Park and T. G. Park, Bioconjugate Chem., 2010, 21, 505–512 CrossRef CAS PubMed.
- G. H. Im, S. M. Kim, D.-G. Lee, W. J. Lee, J. H. Lee and I. S. Lee, Biomaterials, 2013, 34, 2069–2076 CrossRef CAS PubMed.
- D. Niu, X. Luo, Y. Li, X. Liu, X. Wang and J. Shi, ACS Appl. Mater. Interfaces, 2013, 5, 9942–9948 CAS.
- S. Li, C. Shao, W. Gu, R. Wang, J. Zhang, J. Lai, H. Li and L. Ye, RSC Adv., 2015, 5, 33639–33645 RSC.
- J. Zhu, Y. Lu, Y. Li, J. Jiang, L. Cheng, Z. Liu, L. Guo, Y. Pan and H. Gu, Nanoscale, 2014, 6, 199–202 RSC.
- S.-W. Chou, Y.-H. Shau, P.-C. Wu, Y.-S. Yang, D.-B. Shieh and C.-C. Chen, J. Am. Chem. Soc., 2010, 132, 13270–13278 CrossRef CAS PubMed.
- Q. Xiao, W. Bu, Q. Ren, S. Zhang, H. Xing, F. Chen, M. Li, X. Zheng, Y. Hua and L. Zhou, Biomaterials, 2012, 33, 7530–7539 CrossRef CAS PubMed.
- S.-C. Wu, K.-L. Lin, T.-P. Wang, S.-C. Tzou, G. Singh, M.-H. Chen, T.-L. Cheng, C.-Y. Chen, G.-C. Liu and T.-W. Lee, Biomaterials, 2013, 34, 4118–4127 CrossRef CAS PubMed.
- R. Naccache, P. Chevallier, J. Lagueux, Y. Gossuin, S. Laurent, L. Vander Elst, C. Chilian, J. A. Capobianco and M. A. Fortin, Adv. Healthcare Mater., 2013, 2, 1478–1488 CrossRef CAS PubMed.
- B. Xu, H. Dou, K. Tao, K. Sun, J. Ding, W. Shi, X. Guo, J. Li, D. Zhang and K. Sun, Langmuir, 2011, 27, 12134–12142 CrossRef CAS PubMed.
- Z. Liu, T. Lammers, J. Ehling, S. Fokong, J. Bornemann, F. Kiessling and J. Gätjens, Biomaterials, 2011, 32, 6155–6163 CrossRef CAS PubMed.
- W. Liu, S. Wen, L. Jiang, X. An, M. Zhang, H. Wang, Z. Zhang, G. Zhang and X. Shi, Curr. Nanosci., 2014, 10, 543–552 CrossRef CAS.
- D. Patel, A. Kell, B. Simard, B. Xiang, H. Y. Lin and G. Tian, Biomaterials, 2011, 32, 1167–1176 CrossRef CAS PubMed.
- M. Yang, K. Cheng, S. Qi, H. Liu, Y. Jiang, H. Jiang, J. Li, K. Chen, H. Zhang and Z. Cheng, Biomaterials, 2013, 34, 2796–2806 CrossRef CAS PubMed.
- H. Yang, Y. Zhuang, H. Hu, X. Du, C. Zhang, X. Shi, H. Wu and S. Yang, Adv. Funct. Mater., 2010, 20, 1733–1741 CrossRef CAS.
- N. Chen, C. Shao, Y. Qu, S. Li, W. Gu, T. Zheng, L. Ye and C. Yu, ACS Appl. Mater. Interfaces, 2014, 6, 19850–19857 CAS.
- J. Fang, P. Chandrasekharan, X.-L. Liu, Y. Yang, Y.-B. Lv, C.-T. Yang and J. Ding, Biomaterials, 2014, 35, 1636–1642 CrossRef CAS PubMed.
- L.-S. Lin, Z.-X. Cong, J.-B. Cao, K.-M. Ke, Q.-L. Peng, J. Gao, H.-H. Yang, G. Liu and X. Chen, ACS Nano, 2014, 8, 3876–3883 CrossRef CAS PubMed.
- Q. Tian, Q. Wang, K. X. Yao, B. Teng, J. Zhang, S. Yang and Y. Han, Small, 2014, 10, 1063–1068 CrossRef CAS PubMed.
- D. Kim, Y. Y. Jeong and S. Jon, ACS Nano, 2010, 4, 3689–3696 CrossRef CAS PubMed.
- D. Kim, S. Park, J. H. Lee, Y. Y. Jeong and S. Jon, J. Am. Chem. Soc., 2007, 129, 7661–7665 CrossRef CAS PubMed.
- X. Ji, F. Peng, Y. Zhong, Y. Su and Y. He, Colloids Surf., B, 2014, 124, 132–139 CrossRef CAS PubMed.
- J. S. Aaron, A. C. Greene, P. G. Kotula, G. D. Bachand and J. A. Timlin, Small, 2011, 7, 334–341 CrossRef CAS PubMed.
- H. Yang, Y. Zhuang, Y. Sun, A. Dai, X. Shi, D. Wu, F. Li, H. Hu and S. Yang, Biomaterials, 2011, 32, 4584–4593 CrossRef CAS PubMed.
- L. An, H. Hu, J. Du, J. Wei, L. Wang, H. Yang, D. Wu, H. Shi, F. Li and S. Yang, Biomaterials, 2014, 35, 5381–5392 CrossRef CAS PubMed.
- H. Cai, K. Li, M. Shen, S. Wen, Y. Luo, C. Peng, G. Zhang and X. Shi, J. Mater. Chem., 2012, 22, 15110–15120 RSC.
- H. Cai, K. Li, J. Li, S. Wen, Q. Chen, M. Shen, L. Zheng, G. Zhang and X. Shi, Small, 2015, 11, 4584–4593 CrossRef CAS PubMed.
- S. Ge, X. Shi, K. Sun, C. Li, C. Uher, J. R. Baker Jr, M. M. Banaszak Holl and B. G. Orr, J. Phys. Chem. C, 2009, 113, 13593–13599 CAS.
- M. Shen, H. Cai, X. Wang, X. Cao, K. Li, S. H. Wang, R. Guo, L. Zheng, G. Zhang and X. Shi, Nanotechnology, 2012, 23, 105601 CrossRef PubMed.
- H. Cai, X. An, J. Cui, J. Li, S. Wen, K. Li, M. Shen, L. Zheng, G. Zhang and X. Shi, ACS Appl. Mater. Interfaces, 2013, 5, 1722–1731 CAS.
- J. Li, L. Zheng, H. Cai, W. Sun, M. Shen, G. Zhang and X. Shi, Biomaterials, 2013, 34, 8382–8392 CrossRef CAS PubMed.
- J. Li, Y. He, W. Sun, Y. Luo, H. Cai, Y. Pan, M. Shen, J. Xia and X. Shi, Biomaterials, 2014, 35, 3666–3677 CrossRef CAS PubMed.
- J. Li, X. Shi and M. Shen, Part. Part. Syst. Charact., 2014, 31, 1223–1237 CrossRef CAS.
- J. Li, L. Zheng, H. Cai, W. Sun, M. Shen, G. Zhang and X. Shi, ACS Appl. Mater. Interfaces, 2013, 5, 10357–10366 CAS.
- H. Cai, X. An, S. Wen, J. Li, G. Zhang, X. Shi and M. Shen, Part. Part. Syst. Charact., 2015, 32, 934–943 CrossRef CAS.
- Y. Luo, J. Yang, J. Li, Z. Yu, G. Zhang, X. Shi and M. Shen, Colloids Surf., B, 2015, 136, 506–513 CrossRef CAS PubMed.
- L. Dong, Y. Zhong, Z. Shen, T. Zheng and H. Wang, RSC Adv., 2016, 6, 21037–21042 RSC.
- Y. Fan, X. Zhang, Y. Liu, Q. Cai and J. Zhang, Mater. Lett., 2013, 95, 153–156 CrossRef CAS.
- J. Li, Y. Hu, J. Yang, P. Wei, W. Sun, M. Shen, G. Zhang and X. Shi, Biomaterials, 2015, 38, 10–21 CrossRef CAS PubMed.
- C.-C. Huang, N.-H. Khu and C.-S. Yeh, Biomaterials, 2010, 31, 4073–4078 CrossRef CAS PubMed.
- X. Yang, Z. Zhou, L. Wang, C. Tang, H. Yang and S. Yang, Mater. Res. Bull., 2014, 57, 97–102 CrossRef CAS.
Footnote |
† Electronic supplementary information (ESI) available. See DOI: 10.1039/c6ra05648b |
|
This journal is © The Royal Society of Chemistry 2016 |
Click here to see how this site uses Cookies. View our privacy policy here.