Selective hydrogenation of paracetamol to acetamidocyclohexanone with silylated SiO2 supported Pd-based catalysts

Wenjing Songa, Xiuna Liua, Shaoyang Jiangb, Zhou Chena, Weizheng Wenga, I. Rodríguez-Ramosc, Xiaodong Yi*a and Weiping Fanga
aNational Engineering Laboratory for Green Chemical Productions of Alcohols, Ethers and Esters, College of Chemistry and Chemical Engineering, Xiamen University, Fujian 361005, P. R. China. E-mail: xdyi@xmu.edu.cn
bSINOPEC Catalyst CO., LTD, Beijing 100029, P. R. China
cInstituto de Catálisis y Petroleoquímica, CSIC, Marie Curie 2, Cantoblanco, 28049 Madrid, Spain

Received 1st March 2016 , Accepted 20th April 2016

First published on 22nd April 2016


Abstract

A series of catalysts comprising well-distributed Pd nanoparticles incorporated on silylated SiO2 were fabricated by the wet impregnation method and investigated in the selective hydrogenation of paracetamol to 4-acetamidocyclohexanone. The catalysts calcined at different temperatures were characterized by TG, FT-IR, N2 physisorption, TPR and XPS. The results showed that organic modification led to a catalyst surface composed of stable Si–(CH3)3 species even after calcination at 300 °C. Also, changes occurred in the size and electronic properties of the Pd particles through the different amounts of grafted groups on the SiO2 support. The mode of adsorption of the paracetamol molecule was influenced by the quite bulky organic groups on the support, resulting in a significant improvement in selectivity towards 4-acetamidocyclohexanone and preventing full hydrogenation to some extent. The best result was obtained on the silylated Pd catalyst calcined at 500 °C, with 64.9% selectivity to keto at the paracetamol conversion of 60.5%, while the non-silylated SiO2 supported Pd catalyst gave 4-acetamidocyclohexanone selectivity of 29.1% at 53.8% conversion.

1 Introduction

The hydrogenation of substituted phenols to the corresponding alkyl-substituted cyclohexanones and cyclohexanols has generated great interest in the industry and researchers, due to their application in the subsequent manufacture of fine chemicals for the fragrance and detergent industries. Studies are mainly focused on the complete hydrogenation to substituted cyclohexanol,1 although the intermediate product alkylcyclohexanone also plays a significant role in the industry. Cyclohexanone is well known as an important intermediate to produce both caprolactam for Nylon 6 and adipic acid for Nylon 66.2 The 4-acetamidocyclohexanone was prepared as an intermediate in the synthesis of morphine skeleton.3 Generally, these cyclohexanones formed in the hydrogenation reaction of phenols could directly desorb from the catalytic surface or be further obtained through the oxidation of cyclohexanols or cyclohexane.4,5 But the latter route involves two steps, focusing the investigation on the former facile route for one-pot cyclohexanone formation.

As we all know, both the support and the surface metal atoms are involved in determining the performance of catalysts. Traditionally, supported Pd catalysts showed high selectivity to substituted cyclohexanone in the catalytic hydrogenation reaction,6,7 while the hydrogenation of keto was fast for Ru-catalysts and leaded directly to the 4-acetamidocyclohexanols.8 Products of hydrogenolytic cleavage can also be observed with a nickel catalyst.9,10 There are many studies dealing with the hydrogenation of paracetamol to produce acetamidocyclohexanols and the cis/trans stereoselectivity.11,13 However, few studies are concerned with the partial hydrogenation of paracetamol. It is a challenge to obtain a high selectivity. Attempts have been made to relate the selectivity with the nature of the support.12 Addition of basic properties to supports has been investigated and reported to highly improve the partial phenol hydrogenation reaction.14 And organic modifiers (ligands) on metal-based heterogeneous catalysts also was reported to help to enhance the catalytic selectivity to some extent.15,16 With excellent stability and wide accessibility, silica is widely applied as support and the silanized organic groups on the surface can affect the anchor of precious metal and the catalytic performance.17 In the same way, the hydrophilic oxygen-containing groups on the carbon support improve the solubility and act as the site for further chemical derivatization (amidation or esterification).18 Bachiller-Baeza et al.,8,12 after investigating the influence of different supports and promoters on the stereoselective hydrogenation of paracetamol to 4-acetamidocyclohexanol, found that the OH groups on carbon-supported catalysts diminished the activity in the reaction explaining the catalytic performance as a function of the acid–base properties of the catalyst surface. Kim et al.19 increased the activity of SBA-15 supported Co catalysts for the FT synthesis via a hydrophobic silylation of the support, and these groups on SBA-15 enhanced the reducibility of the cobalt oxide species due to the weaker cobalt oxide-support interaction. Besides, Tan et al.20 reported the modification of Al2O3 by a silylant agent which introduces amino functional groups at the surface. The –NH2 group offers ideal host for uniform distribution of Ru metal to improve the dispersion of Ru nanoparticles and favors the formation of electron-rich Ru sites by coordination with the amino ligands. Besides, the different capacity of mpg-C3N4 (polymeric mesoporous graphitic carbon nitride) support to adsorbs phenol and cyclohexanone was suggested to enhance the semihydrogenation rate of phenol on Pd–mpg-C3N4 catalysts.21

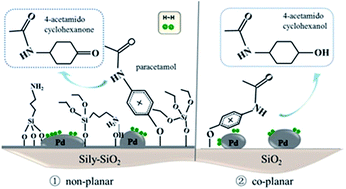
In our present work, we attempt to tune the surface chemical composition of heterogeneous metal catalysts to optimize their catalytic performances. The silylant agent used was 3-aminopropyltriethoxysilane introducing amino groups, and modifying the OH groups at the support surface, which provides sites to anchor the Pd nanoparticles and changes the adsorption way of reactant and products during the reaction. The amount of this silylant agent grafted on the surface of SiO2 was varied by application of different calcination processes. The selective hydrogenation of paracetamol to aromatic ketones was studied over the different silylated SiO2 supported Pd catalysts. The correlation of the catalytic behavior in the reaction with the coverage of SiO2 support by the silylant agent and the availability of H atoms on Pd nanoparticles simultaneously assessed was carried out.

2 Experimental

2.1 Silylation process

The silylated SiO2 was prepared by impregnation of silica gel with the (3-aminopropyl)triethoxysilane (APTES) solution in toluene. 10 g silica gel supplied by Sigma-Aldrich (Davisil, Grade 636, 435 m2 g−1, 35–60 mesh, pore size of 6 nm) was first treated with 100 mL 20 wt% HNO3 at 30 °C for 24 h, followed by washing thoroughly with deionized water until pH = 7 and dried overnight at 110 °C before use. The silica sample was then impregnated with 5% vol APTES dissolved in toluene solution.22 Aliquots of 0.6 g support were suspended in 10 mL toluene with 0.5 mL APTES at room temperature overnight. The silylated support was filtered, washed with ethanol, and then dried at 120 °C for about 4 h.

2.2 Catalyst preparation

3 wt% Pd catalysts were prepared by the wet impregnation method, using 0.02 M H2PdCl4 (the mole ratio of PdCl2 and HCl was 1/2) as the palladium precursor. The silylated SiO2 was then impregnated with the above Pd solutions at room temperature for 24 h. After drying at 120 °C, the catalysts were calcined in air at different temperatures for 2 h. The catalyst samples were designated as Pd/Sily-x, where x represents the calcination temperature. For comparison, the SiO2 treated by HNO3 was also used as the support, and this catalyst heated at 500 °C was named Pd/Si-500.

2.3 Catalyst characterization

Thermogravimetric analysis (TGA) of the catalysts was carried out on TGA Q600-SDT apparatus. The sample powders were heated under an air flow of 100 mL min−1 from 50 to 800 °C at heating rate of 10 °C min−1.

Nitrogen adsorption isotherms were recorded at the temperature of liquid nitrogen using a Micromeritics ASAP 3020 apparatus. Before the analysis, the samples were outgassed at 110 °C. Specific areas were calculated by applying the Brunauer–Emmett–Teller (BET) method to portions of the isotherms within the 0.05 < P/P0 < 0.30 relative pressure range. The total pore volume was calculated from the amount of vapor adsorbed at a relative pressure close to unity assuming that the pores are filled with the adsorbate in the liquid state.

FT-IR spectra of pyridine adsorption were recorded using a Thermo Nicolet Nexus spectrometer equipped with a liquid-nitrogen-cooled MCT detector. The samples were pressed into self-supporting wafers and treated in H2 at 300 °C in an IR cell for 1 h followed by evacuation at 300 °C for 5 min to remove the gas phase H2. After cooling to 100 °C, the samples were exposed to pyridine vapor for 10 min. Then the spectra were recorded after evacuation at high temperatures. The IR spectra were recorded in the spectral range 1700 to 1400 cm−1 with 32 scans and at a resolution of 4 cm−1.

Transmission electron microscope (TEM) experiments were performed using FEI Tecnai 30 high resolution transmission electron microscope (Philips Analytical) operated at an accelerating voltage of 300 kV. All the samples were reduced with H2 at 300 °C and prepared by depositing a drop of diluted suspensions in ethanol on a carbon film coated copper grid before TEM experiments.

Temperature programmed reduction (TPR) analyses were carried out with the GC-TPR apparatus. The samples (50 mg each) were pretreated in a 5% O2/Ar flow of 30 mL min−1 at 300 °C for 1 h and then cooled to about 11 °C with the circulating cooling water. Next 5% H2/Ar (50 mL min−1) was switched and the sample was heated to 500 °C at a rate of 10 °C min−1 until the flat baseline was obtained. The H2 consumption of the catalyst reduction was determined by a thermal conductivity detector (TCD).

X-ray photoelectron spectroscopy (XPS) measurements were made with a Qtac100 spectrometer using the incident radiation Al Ka of 1486.6 eV at 250 W, 20 mA, and 50 eV of pass energy. This system has a prechamber for samples introduction and in situ heat treatment. The samples were reduced at 300 °C in flow of H2 before transferred. The Si 2p binding energy was taken as a charge reference, fixed at 103.3 eV. To quantify the Pd species contents, the obtained XPS spectra were fitted using XPSPEAK41 software. The atomic ratio estimations were done according the peak areas after the background subtraction and corrected relative to the corresponding atomic sensitivity factors.

2.4 Apparatus and procedure for activity tests

The hydrogenation of paracetamol was carried out under 5 MPa H2 pressure in a Parr 4848 autoclave fitted with a magnetically-driven stirrer. After being reduced under flowing hydrogen at 300 °C for 2 h, the Pd catalyst (0.1 g) was transferred in ethanol to the stainless steel reactor that contained a solution of paracetamol (0.214 g 4-acetamidophenol, AR: 99.0%, from Aladdin) in ethanol (weight ratio of substrate and Pd was 71). The autoclave was closed and purged in He several times, heated to 170 °C with He, then pressurized to 5 MPa with H2. The analysis was performed by gas chromatograph equipped with a flame ionization detector operating at 200 °C and a capillary column OV-17 (30 m × 0.32 mm). The injector temperature was set to 200 °C, the following temperature program method was used for column: 150 °C for 5 min and then heated to 250 °C with a ramp rate of 10 °C min−1 and kept at 250 °C for another 7 min. The main products include 4-acetamidocyclohexanols and 4-acetamidocyclohexanone, and the other product is the N-cyclohexylacetamide. The normalization method was used to determine the conversion and selectivity.

3 Results and discussion

3.1 Characterization of the catalysts

The thermal decomposition process of SiO2 supported Pd catalyst was investigated by thermal gravimetry and shown in Fig. 1. The weight loss below 200 °C was related to desorption of physical adsorbed water on SiO2. Comparison of Fig. 1(a)–(c) suggest the weight loss of Pd/Sily-110 catalyst comprised the decomposition of both the silylating agent, and OH groups remaining on the silica surface. A strong exothermic peak was presented around 300 °C with the silylated SiO2, which indicated the decomposition of (3-aminopropyl)triethoxysilane. Comparison of the Fig. 1(b) and (c) indicates the decomposition of OH groups proceed between 300 and 600 °C. The thermogravimetric analysis of Pd/Sily catalysts showed that the Pd/Sily-110 catalyst was covered by the silylant agent while a few APTES existed on the Pd/Sily-500, compared with the full decomposition happened under 800 °C calcination in air.
image file: c6ra05479j-f1.tif
Fig. 1 TG curves and DSC curves of (a) silylated SiO2; (b) Pd/Si catalyst; (c) Pd/Sily-110 and the TG curves of (d) Pd/Sily-300; (e) Pd/Sily-400; (f) Pd/Sily-500; (g) Pd/Sily-800.

The IR spectroscopy was evaluated to gain insight into the structure of silylated SiO2. Methyl groups were incorporated by silylation, as shown in the Fig. 2. The bands at 2963 and 2908 cm−1 represented the stretching vibration of C–H bonds in CH3 and CH2 groups respectively whereas the bands detected at 3366 and 3277 cm−1 were corresponded to primary and secondary amine groups.20,23 It indicated the incorporation of silylant agent on the Pd/Sily catalyst. And the amount of these groups showed a diminished trend with respect to calcination temperature: Pd/Sily-110 > Pd/Sily-500 > Pd/Sily-800. This result strongly coincided with that obtained from TGA.


image file: c6ra05479j-f2.tif
Fig. 2 Evolution of the IR spectra of the Pd catalyst as a function of calcination temperature: (a) Pd/Sily-110; (b) Pd/Sily-500; (c) Pd/Sily-800.

FT-IR spectra of pyridine adsorbed on reduced catalysts were shown in Fig. 3. All the samples only showed the characteristic absorption bands at 1450 cm−1 of pyridine adsorbed on Lewis acid sites and no bands (1540 cm−1) due to pyridine adsorbed on the Brönsted acid sites were observed.24 The intensity of absorption bands for Lewis acid sites (1450 cm−1) on the silylated Pd samples were increased with calcination temperature. These results suggested that the Lewis acidity of catalysts were decreased on silylated Pd samples compared to Pd/Si-500.


image file: c6ra05479j-f3.tif
Fig. 3 FT-IR spectra of pyridine adsorbed and desorbed on (a) Pd/Si-500; (b) Pd/Sily-300; (c) Pd/Sily-400; (d) Pd/Sily-500; (e) Pd/Sily-800 catalysts at 150 °C.

Surface areas calculated by application of the BET method to the isotherms of N2 adsorption are given in Table 1. A gradual increase of the surface area values as the temperature of thermal treatment increases was observed in the samples. This suggests the existence of organic groups coordinated with the OH on the SiO2 which decreased the surface area. Furthermore the surface area value of Pd/Sily-800 was lower due to the effect of the structure of SiO2 after calcination at 800 °C. The pore volume and average pore diameter were smaller than those of non-silylated SiO2 supported Pd catalyst. This finding supports the presence of surface organic residues inside the porosity of SiO2.

Table 1 The properties of Pd catalysts
Cat. SBET/m2 g−1 Volume/cm3 g−1 Pore size/nm d/nm (TEM) Pd 3d5/2 BE (eV) Pd/Si (XPS)
Pd2+ Pd0
Pd/Si-500 399 0.80 6.2 6.1 336.1 334.9 0.01
Pd/Sily-300 374 0.67 5.6 5.2 336.1 334.8 0.06
Pd/Sily-400 377 0.63 5.6 5.3 336.1 334.9 0.03
Pd/Sily-500 383 0.68 6.4 4.4 336.1 334.9 0.04
Pd/Sily-800 379 0.67 5.6 5.4 336.1 335.0 0.01


Much more information about the variation in Pd particle size for the silylated SiO2 supported palladium catalysts during the different calcination processes could be obtained from TEM experiment, as shown in Fig. 4. The dark spots in the images, which represented the Pd nanoparticles of roughly spherical shape, were well distributed on the supports. The particle size distribution obtained by measuring more than 300 individual particles gave a mean particle size on the sample. Pd particles with size of about 4–7 nm were observed in all the catalysts. And Pd/Sily-500 exhibited a smaller particle size of about 4.4 nm compared with the non-silylated SiO2 supported Pd catalyst with 6.1 nm. Upon the APTES modification, palladium precursors were easily adsorbed, and Pd nanoparticles were uniformly embedded in SiO2.25 During the preparation of catalyst, the amine function reacts with the Pd precursor (H2PdCl4) in an simple base–acid reaction, favoring by this way the dispersion of Pd on the support.


image file: c6ra05479j-f4.tif
Fig. 4 TEM micrographs for the reduced Pd/Sily catalysts. (a) Pd/Si-500; (b) Pd/Sily-300; (c) Pd/Sily-400; (d) Pd/Sily-500; (e) Pd/Sily-800.

The interactions between the active phase and the support were examined by temperature-programmed reduction (TPR). This also reflected the reduction behavior of the Pd species of each sample. Some differences of the reduction peaks on Pd catalysts were shown in Fig. 5. The reduction peaks could be assigned to several processes and the reduction temperature changed based on the support.26 The peaks around 40 °C can be attributed to the reactions (1) and (2) for hydrogen consumption by the palladium oxide formed during the calcination, while the negative reduction peak around 80 °C was related to the hydride phase decomposition as shown by the reaction (3).26

 
(1 + 1/2x) + PdaO → PdaHx + H2O (1)
 
1.5H2 + PdcO → PdcH + H2O (2)
 
PdaHx → Pda + 1/2xH2 (3)


image file: c6ra05479j-f5.tif
Fig. 5 H2-TPR profiles of the (a) Pd/Si-500; (b) Pd/Sily-300; (c) Pd/Sily-400; (d) Pd/Sily-500; (e) Pd/Sily-800 samples.

It has been reported that the reduction temperature for the TiO2 supported palladium was below 0 °C and for the uncalcined Pd/Al2O3 the reduction took place between 80 °C and 230 °C. In our case for the SiO2 supported Pd catalyst, the two positive peaks (a large one at 32 °C and a small one at 65 °C) were due to two kinds of Pd oxide, amorphous and crystalline PdO (PdaO and PdcO).27,28 The reduced Pd was highly susceptible to atmospheric oxygen, leading to the amorphous Pd oxide layer, and the contribution from the Pd–Pd coordination shell of the Pd oxide layer was weak relative to the Pd–O shell. On the other hand, all the catalysts exhibited a positive reduction peak, with the maximum at ∼120 °C, after the hydride phase decomposition, which could be ascribed to the reduction of two-dimensional surface complex [PdO]sc.29 The organic modification decreased the interaction between PdO and Si–OH groups, resulting in the redistribution of Pd and the formation of [PdO]sc, while at the higher treatment temperature, the [PdO]sc evolves to PdaO and PdcO species. As seen from the tendency of Pd/Sily-300, the PdaO species might be reduced to metal below 13 °C. And the TCD signal for palladium hydride also enhanced by the increase of amount of PdaO, as treatment temperature increased, resulting the less silicified organic groups on the support, the less disordered PdO clusters formed and the PdO species shifted from amorphous to crystalline.

Besides the hydrogen consumption peak, the negative peak for the palladium hydride (β-PdH) decomposition was also present on the supported Pd catalyst, and the hydride formation was a bulk phenomenon.30,31 The temperature and the amount for the decomposition was reflected by the stability of the hydride phase32 and the particle size,29 respectively. The higher decomposition temperature of the β-PdH indicated the larger crystallites size. This result was in good agreement with that reported by Nag.32 It was suggested that as the order in the Pd lattice increased, the electronic nature of the palladium changed, leading the increase of the binding force holding the hydrogen in the lattice. Besides, Bonarowska33 studied the kind of decomposition peaks, ascribing the 90 °C peak to hydrogen evolution from a massive palladium hydride, and the low-temperature peak (70 °C) to the more finely dispersed Pd. The smaller formation of the β-hydride phase on the silylated catalysts treated at 300 °C or 400 °C was ascribed to the absence of PdaO in the catalyst, due to more formation of disorder PdO on the silylated SiO2.

To obtain information about the valence state of metal on the catalyst surface, we carried out a XPS study. The XPS spectra are shown in Fig. 6. The binding energies were compiled in Table 1. The Pd 3d5/2 peaks line of all the catalysts were split in two components, one at 334.6 eV indicated that palladium was essentially as metallic Pd,34 while the peaks placed at 336.5–336.8 eV were due to the PdO.35,36 Meanwhile, a decrease of Pd/Si atom ratios with higher calcination temperature was observed, and a richer Pd was anchored on the silylated Pd sample.


image file: c6ra05479j-f6.tif
Fig. 6 Pd 3d XPS spectra of catalysts (a) Pd/Si-500 and (b) Pd/Sily-300; (c) Pd/Sily-400; (d) Pd/Sily-500; (e) Pd/Sily-800.

3.2 Catalytic activity

Considering the results previously reported,11 the hydrogenation of paracetamol could follow the consecutive reaction pathways (Scheme 1). The benzene ring of paracetamol is first partially hydrogenated to an enol, which is unstable and isomerizes rapidly to form keto; keto could then be further hydrogenated to form 4-acetamidocyclohexanol. And in the hydrogenation process, some hydrolysis products (N-cyclohexylacetamide) may be obtained. The most interesting feature of the present work was the marked difference in the selectivity to 4-acetamidocyclohexanone obtained under the present experimental conditions with the modified catalysts.
image file: c6ra05479j-s1.tif
Scheme 1 Reaction pathways in the hydrogenation of paracetamol.

The results of the hydrogenation of 4-acetamidophenol are given at Table 2. The activity evolution of two catalysts as a function of time in the reaction is shown in Fig. 7. 4-Acetamidocyclohexanone was the primary product observed, as expected from the nature of the reaction. The selectivity to the intermediate 4-acetamidocyclohexanone decreased with the increasing conversion. This was in agreement with phenol hydrogenation which followed a consecutive reaction pathway.37 The concentration of keto increased with time and decreased after reaching a maximum in both cases. After 4 h reaction, the paracetamol was almost totally converted into acetamidocyclohexanol over Pd/Si-500 catalyst. The deep hydrogenation product is widely used as a bronchosecretolitic agent for the prevention and treatment of asthma, acute and chronic bronchitis.38 But the reaction on Pd/Sily-500 remained at the step of 4-acetamidocyclohexanone with the selectivity of 64.9%. It is deduced that the silylated Pd catalyst is active for the first step but is not active for the second step under the experimental conditions.

Table 2 Catalytic performance on the hydrogenation of paracetamol at 170 °C, 5 MPa H2 in 20 min
Cat. Conv. (%) Selectivitya (%) Keto yield
SK SH SN
a SH, SK, and SN indicate the selectivity to 4-acetamidocyclohexanol, 4-acetamidocyclohexanone and N-cyclohexylacetamide, respectively.
Pd/Si-500 53.8 29.1 69.7 1.2 15.6
Pd/Sily-300 39.5 71.4 26.5 4.1 28.2
Pd/Sily-400 51.9 67.9 29.7 2.4 35.2
Pd/Sily-500 60.5 64.9 32.4 2.7 39.3
Pd/Sily-800 49.7 46.5 52.2 1.3 23.1


image file: c6ra05479j-f7.tif
Fig. 7 Concentration profiles of paracetamol and the products as the function of time on Pd catalysts under reaction conditions: T = 170 °C, PH2 = 5 MPa, Wcat. = 0.1 g, substrate/Pd = 71 wt%, solvent: ethanol. (a) Pd/Si-500; (b) Pd/Sily-500.

As shown in the characterization measurements, at the lower calcination temperature remained the higher amount of functional groups incorporated on SiO2 spheres, leading to the lower conversion in the reaction. As the calcination temperature increases less silylating agent was kept in favor of enhanced activity. The conversion of paracetamol increased with the calcination temperature, passing through a maximum (60.5%) for the catalyst Pd/Sily-500 and dropping for sample treated at higher temperature. The marked difference was the product distribution. 64.9% selectivity to 4-acetamidocyclohexanone was obtained on Pd/Sily-500 compared with 29.1% for Pd/Si-500 catalysts. The specific activity of catalyst did not seem to be greatly affected by the particle size considering the narrow size range of the Pd particles (4–7 nm). This was in accordance to the results previously reported in the hydrogenation of phenol.39,40

The conversion of paracetamol increased with the calcination temperature, passing through a maximum (60.5%) for the catalyst Pd/Sily-500 and dropping for the Pd/Sily-800. This can be ascribed to the adsorption H atom on the Pd metal. From TPR profiles, the palladium hydride species decompose at lower temperature on the Pd/Sily-500, indicating the weaker absorption of H2 on the Pd. The easier desorption of hydrogen facilitate the activity. The hydrogen atom is difficult to desorb from the metal and participate to the hydrogenation reaction, leading to the lower conversion. The silylation process favors the formation of hydride phase on the Pd catalyst. After calcination at higher temperature, the organic groups are reduced on the SiO2 surface and the absorption of H atom on Pd metal is stronger. The stable presence of PdH on the Pd/Sily-800 results in the lower amount of H2 desorption on the Pd, so the conversion was only 49.7% for the Pd/Sily-800 catalyst.

As the selectivity of catalyst is concerned, the structure of the catalyst and the electronic surrounding of metal both played an important role in the adsorption of the reactant and active hydrogen respectively. The TG and FTIR spectra of pyridine adsorption results showed the remained silylating agent decreased the intensity of Lewis acid on the catalysts. And the electronic palladium surrounding was modified by the organic groups on the support. It favored the back donation of electrons to the π* (anti-bonding) of aromatic ring in chemisorbed phenol, making the aromatic ring activated towards hydrogenation.41 On the other hand, in the hydrogenation of phenol, the process selectivity was interpreted in terms of reactant/catalyst interactions where phenol adsorption was viewed as occurring via aromatic π-electron system.42,43 The strong interaction between the aromatic ring and the support favors the formation of cyclohexanol with a coplanar adsorption. On the contrary, phenol can be chemisorbed in a nonplanar form, which facilitates the production of cyclohexanone.44,45 As depicted in Fig. 8, two different adsorption modes adopted by paracetamol on the surface of catalyst via the oxygen atom of the hydroxyl group in the form of phenolate, included the non-planar and the co-planar. The quite bulky sily groups present on the surface of silylated catalysts could hinder the planar adsorption of the paracetamol molecule on the Pd nanoparticles. The planar or non-planar adsorption of paracetamol depends of the amounts of silylated groups on the catalyst surface. Actually, the selectivity to 4-acetamidocyclohexanone decreases when the calcination temperature increases from 300 to 800 °C, as the amount of silylated groups decrease. When the sample was treated at the lower temperature, the APTES anchored on the support impedes the planar adsorption of the paracetamol via O–Pd bonding on the catalyst surface due to steric hindrance, thus preventing them from further hydrogenation.46 The absence of sily groups on Pd/Sily-800 catalyst results in more co-planar aromatic ring adsorption and producing less 4-acetamidocyclohexanone with the 46.5% selectivity. The non-silylated SiO2 supported Pd catalyst favors the co-planar absorption of reactant, obtaining the 4-acetamidocyclohexanol and carrying out full hydrogenation.


image file: c6ra05479j-f8.tif
Fig. 8 The possible structure and hydrogenation route for Pd/SiO2 catalyst.

4 Conclusions

On the basis of the results reported in this paper, it can be concluded that the catalytic behavior of Pd/silylated SiO2 towards the selective hydrogenation of paracetamol to acetamidocyclohexanone is strongly affected by the steric hindrance of bulky sily groups on the support and the electron surroundings of metal active sites (Pd). The surface groups, which can act as the centers to interact with the precursor, are influenced by the silylating agent. Meanwhile, the reducing ability of the catalysts and the stability of the hydride phase could be tuned by different calcination temperatures. The decomposition of Pd–H species influence the hydrogenation activity and positive effect on yield of keto has been identified as due to the steric hindrances of the sily groups on the support. Compared with the Pd/Si-500 without silylation process, the silylated SiO2 produced smaller particles of Pd (Pd/Sily-500) and gave the better selectivity to 4-acetamidocyclohexanone (64.9%) at 60.5% conversion in 20 min.

Acknowledgements

This work is supported by the National Natural Science Foundation of China (21373168, 21473143) and the Science and Technology Foundation of Guangxi (14125008-2-10).

Notes and references

  1. C. Zhao, S. Kasakov, J. He and J. A. Lercher, J. Catal., 2012, 296, 12–23 CrossRef CAS.
  2. I. Dodgson, K. Griffen, G. Barberis, F. Pignataro and G. Tauszik, Chem. Ind., 1989, 24, 830–833 Search PubMed.
  3. H. J. Teuber and C. Tsaklakidis, ChemInform, 1991, 22, 835–837 Search PubMed.
  4. Y. Wang, J. Zhang, X. Wang, M. Antonietti and H. Li, Angew. Chem., Int. Ed., 2010, 49, 3356–3359 CrossRef CAS PubMed.
  5. M. Chatterjee, H. Kawanami, M. Sato, A. Chatterjee, T. Yokoyama and T. Suzuki, Adv. Synth. Catal., 2009, 351, 1912–1924 CrossRef CAS.
  6. Y. Pérez, M. Fajardo and A. Corma, Catal. Commun., 2011, 12, 1071–1074 CrossRef.
  7. F. Zhang and H. Yang, Catal. Sci. Technol., 2015, 5, 572–577 CAS.
  8. B. Bachiller-Baeza, A. Guerrero-Ruíz and I. Rodríguez-Ramos, Appl. Surf. Sci., 2007, 253, 4805–4813 CrossRef CAS.
  9. J. TobiČík and L. Červeny, J. Mol. Catal. A: Chem., 2003, 194, 249–254 CrossRef.
  10. W. Song, Y. Liu, E. Baráth, C. Zhao and J. A. Lercher, Green Chem., 2015, 17, 1204–1218 RSC.
  11. M. Cerro-Alarcón, A. Guerrero-Ruíz and I. Rodríguez-Ramos, Catal. Today, 2004, 93–95, 395–403 CrossRef.
  12. B. Bachiller-Baeza, A. Guerrero-Ruíz and I. Rodríguez-Ramos, J. Catal., 2005, 229, 439–445 CrossRef CAS.
  13. E. Asedegbega-Nieto, B. Bachiller-Baeza, A. Guerrero-Ruíz and I. Rodríguez-Ramos, Appl. Catal., A, 2006, 303, 88–95 CrossRef CAS.
  14. G. Feng, P. Chen and H. Lou, Catal. Sci. Technol., 2015, 5, 2300–2304 CAS.
  15. J. W. Medlin, Acc. Chem. Res., 2013, 47, 1438–1445 Search PubMed.
  16. P. Luksirikul, K. Tedsree, M. G. Moloney, M. L. H. Green and S. C. E. Tsang, Angew. Chem., Int. Ed., 2012, 51, 6998–7001 CrossRef CAS PubMed.
  17. D. Tasis, N. Tagmatarchis, A. Bianco and M. Prato, Chem. Rev., 2006, 106, 1105–1136 CrossRef CAS PubMed.
  18. J. M. Fraile, J. I. García, J. A. Mayoral and E. Vispe, Appl. Catal., A, 2003, 245, 363–376 CrossRef CAS.
  19. D. J. Kim, B. C. Dunn, P. Cole, G. Turpin, R. D. Ernst, R. J. Pugmire, M. Kang, J. M. Kim and E. M. Eyring, Chem. Commun., 2005, 11, 1462–1464 RSC.
  20. J. Tan, J. Cui, G. Ding, T. Deng, Y. Zhu and Y. Li, Catal. Sci. Technol., 2016, 6, 1469–1475 CAS.
  21. Y. Li, X. Xu, P. F. Zhang, Y. T. Gong, H. R. Li and Y. Wang, RSC Adv., 2013, 3, 10973–10982 RSC.
  22. M. V. Cagnoli, S. G. Casuscelli, A. M. Alvarez, J. F. Bengoa, N. G. Gallegos, M. E. Crivello, E. R. Herrero and S. G. Marchetti, Catal. Today, 2005, 107–108, 397–403 CrossRef CAS.
  23. A. Quintanilla, J. Bakker, M. Kreutzer, J. Moulijn and F. Kapteijn, J. Catal., 2008, 257, 55–63 CrossRef CAS.
  24. S. Damyanova, M. L. Cubeiro and J. L. G. Fierro, J. Mol. Catal. A: Chem., 1999, 142, 85–100 CrossRef CAS.
  25. Y. Chen, Z. Guo, T. Chen and Y. Yang, J. Catal., 2010, 275, 11–24 CrossRef CAS.
  26. C. Wang, H. Lin and C. Ho, J. Mol. Catal. A: Chem., 2002, 180, 285–291 CrossRef CAS.
  27. J. Keating, G. Sankar, T. I. Hyde, S. Kohara and K. Ohara, Phys. Chem. Chem. Phys., 2013, 15, 8555–8565 RSC.
  28. J. A. McCaulley, J. Phys. Chem., 1993, 97, 10372–10379 CrossRef CAS.
  29. H. Lieske and J. Volter, J. Phys. Chem., 1985, 89, 1841–1842 CrossRef CAS.
  30. G. M. Tonetto and D. E. Damiani, J. Mol. Catal. A: Chem., 2003, 202, 289–303 CrossRef CAS.
  31. F. Pinna, M. Signoretto, G. Strukul, S. Polizzi and N. Pernieone, React. Kinet. Catal. Lett., 1997, 60, 9–13 CrossRef CAS.
  32. N. K. Nag, J. Phys. Chem. B, 2001, 105, 5945–5949 CrossRef CAS.
  33. M. Bonarowska, J. Pielaszek, W. Juszczyk and Z. Karpinski, J. Catal., 2000, 195, 304–315 CrossRef CAS.
  34. C. E. Gigola, M. S. Moreno, I. Costilla and M. D. Sánchez, Appl. Surf. Sci., 2007, 254, 325–329 CrossRef CAS.
  35. V. A. de la Peña O'Shea, M. C. Alvarez-Galvan, J. Requies, V. L. Barrio, P. L. Arias, J. F. Cambra, M. B. Güemez and J. L. G. Fierro, Catal. Commun., 2007, 8, 1287–1292 CrossRef.
  36. W. E. Moddeman, W. C. Bowling, D. C. Carter and D. R. Grove, Surf. Interface Anal., 1988, 11, 317–326 CrossRef CAS.
  37. G. Neri, A. M. Visco, A. Donato, C. Milone, M. Malentacchi and G. Gubitosa, Appl. Catal., A, 1994, 110, 49–59 CrossRef CAS.
  38. T. Weiser and N. Wilson, Mol. Pharmacol., 2002, 62, 433–438 CrossRef CAS PubMed.
  39. S. Scire, S. Minico and C. Crisafulli, Appl. Catal., A, 2002, 235, 21–31 CrossRef CAS.
  40. S. Scire, C. Crisafulli, R. Maggiore, S. Minico and S. Galvagno, Appl. Surf. Sci., 1996, 93, 309–316 CrossRef CAS.
  41. H. Li, J. Liu and H. Li, Mater. Lett., 2008, 62, 297–300 CrossRef CAS.
  42. E. J. Shin and M. A. Keane, J. Catal., 1998, 173, 450–459 CrossRef CAS.
  43. C. Park and M. A. Keane, J. Colloid Interface Sci., 2003, 266, 183–194 CrossRef CAS PubMed.
  44. J. Zhong, J. Chen and L. Chen, Catal. Sci. Technol., 2014, 4, 3555–3569 CAS.
  45. L. Cheng, Q. Dai, H. Li and X. Wang, Catal. Commun., 2014, 57, 23–28 CrossRef CAS.
  46. C. Minot and P. Gallezot, J. Catal., 1990, 123, 341–348 CrossRef CAS.

This journal is © The Royal Society of Chemistry 2016