
Determination of selective serotonin reuptake inhibitors in biological samples via magnetic stirring-assisted dispersive liquid–liquid microextraction followed by high performance liquid chromatography
A. Golbabanezhadazizia,
E. Ranjbaria,
M. R. Hadjmohammadi*a and
H. Daneshinejadb
aDepartment of Analytical Chemistry, Faculty of Chemistry, University of Mazandaran, Babolsar, Iran. E-mail: hadjmr@umz.ac.ir; Fax: +98 1125342350; Tel: +98 1125342350
bCollege of Chemistry, Shahrood University of Technology, P.O. Box 36155-316, Shahrood, Iran
First published on 11th May 2016
Abstract
This work is the first report of an efficient procedure for the simultaneous determination of five important selective serotonin reuptake inhibitors (SSRIs) in low concentration levels in biological fluids (urine and plasma samples), which is expedient, quick and of low cost. Despite the wide usage of citalopram, paroxetine, fluvoxamine, fluoxetine, and sertraline in the treatment of depression, and in spite of several advantages and developments of dispersive liquid–liquid microextraction (DLLME), there is not any report about the simultaneous preconcentration of these SSRIs using the DLLME technique. A developed mode of the DLLME technique, i.e., magnetic stirring-assisted dispersive liquid–liquid microextraction (MSA-DLLME), was employed and the parameters affecting the extraction process were optimized using a response surface methodology. The extraction method is based on the fast injection of a mixture of 1-octanol (extraction solvent) and methanol (disperser solvent) into the aqueous solution being stirred by a magnetic stirrer to form a cloudy ternary component solvent (aqueous solution, extracting solvent, disperser solvent) system. The potential variables affecting the extraction recovery such as the volume of the extraction and disperser solvents, pH of sample solution, salt addition, vortex time, and stirring rate were considered in the optimization process. A methodology according to a fractional factorial design (26−2) was performed to choose the significant variables for optimization. The significant factors including the volume of the extraction solvent and the pH of the sample solution were then optimized using a central composite design (CCD). A quadratic model between dependent and independent variables was built and the optimum conditions were obtained. Under the optimum conditions, the proposed method was successfully applied for the determination of SSRIs in urine and plasma samples. Linearity (R2 > 0.999) was obtained in the range of 2–1000 and 5–1000 ng mL−1 for urine and 10–5000 and 25–5000 ng mL−1 for the plasma samples. The extraction recoveries were between 75 and 97% and the preconcentration factors of SSRIs in urine and plasma samples were in the range of 14.03 to 17.94 and 2.82 to 3.57, respectively. Finally, the MSA-DLLME method was successfully applied for preconcentration and trace determination of SSRIs in biological matrices.
1. Introduction
Selective serotonin reuptake inhibitors (SSRIs) as a second generation of antidepressants have been introduced as an alternative to tricyclic antidepressants (TCA) through development of fluvoxamine1,2 in 1984. SSRIs have been prescribed for the treatment of a wide range of psychiatric disorders such as depression, anxiety, and obsessive compulsive, post-traumatic and pre-menstrual dysphoric disorders.3 This group of medicines including citalopram (CIT), paroxetine (PAR), fluvoxamine (FLV), fluoxetine (FLU), and sertraline (SER) acts by regulating the levels of neurotransmitter serotonin through the hormonal and neuronal mechanisms.4 The molecular structure and some physical properties of SSRIs are shown in Table 1. SSRIs, being favourable in comparison to their predecessors due to safety and intolerability, are efficacious enough against depression.5 However, the ceaseless usage of this group is prone to cause some detrimental effects like sexual dysfunction, gastrointestinal effects, and disruption of the central nervous system and might be associated with an increased risk of suicidality in patients;6 thus, the therapeutic ranges of these drugs have been reported as: CIT: 30–130; PAR: 70–120; FLV: 150–300; FLU: 120–300 and SER: 10–50 ng mL−1.7 Therapeutic drug monitoring, which is known as a valid tool to individualize and adjust the treatment of patients, helps clinicians considerably decrease the risks of SSRIs' overdose. Therefore, therapeutic studies necessitate the development of sensitive and reliable methods for the determination of SSRIs in bio fluids such plasma and urine samples.2,8![[thin space (1/6-em)]](https://www.rsc.org/images/entities/char_2009.gif) Ko/wa and water solubility of the SSRIs
Ko/wa and water solubility of the SSRIs
Numerous analytical methods have been reported for the quantification of SSRIs in different samples. These procedures include gas chromatography (GC) coupled with mass spectrometry (MS),9–13 high-performance liquid chromatography (HPLC) combined with ultra violet (UV),14,15 fluorescence (FLD)16,17 or diode array detection (DAD)9,18 methods, liquid chromatography (LC) using MS/MS detection,19 thin-layer chromatography (TLC),20 electrophoretic methods like capillary zone electrophoresis (CZE)21 and micellar electrokinetic chromatographic (MEKC).22,23
The development of a simple and reliable technique for preconcentration and isolation of SSRIs from the real biological samples is generally required prior to chromatographic analysis. It would be ascribed to the complex matrix and low concentration of SSRIs in urine and plasma samples. Liquid–liquid extraction (LLE)14,18 and solid phase extraction (SPE)11,15,25 have been widely utilized for preconcentration of SSRIs. The LLE method is expensive, time-consuming, labor-intensive and requiring large volumes of samples and toxic organic solvents. Additionally, SPE suffers from analyte breakthrough when large sample volumes are analysed.26 Microextraction techniques boosting the prospects of sample preparation steps have been used as a clean-up step for SSRIs' analysis. These methods include solid-phase microextraction (SPME),10,27–29 stir bar sorptive extraction (SBSE)30–33 and liquid phase microextraction (LPME).34,35
Dispersive liquid–liquid microextraction (DLLME) is a very popular environmentally favorable sample preparation technique which was introduced by Assadi et al.36 In this method, after the fast injection of an appropriate mixture of the extraction solvent and disperser solvent into the aqueous solution, a cloudy solution is formed; in fact, a ternary component solvent system including the aqueous solution, extracting solvent and disperser solvent is created. After extraction of the analyte from the aqueous sample solution into fine droplets of the extraction solvent, the method is followed by subsequent steps of centrifugation, withdrawing the preconcentrated analyte in the sedimented phase and finally determination via chromatography or spectrometry methods. This method has been extensively used for the extraction of various compounds from different matrices such as pharmaceutical formulations from biological samples.37,38 The DLLME method offers considerable advantages such as: faster operation, easier manipulation, lower consumption of organic extraction solvents, lower extraction time, higher extraction recovery, higher preconcentration factor, cost effective and phase separation using convenient in-use equipment in comparison with conventional extraction methods, specially LLE.39
Until now, the DLLME method has been applied for the isolation and preconcentration of individual SSRIs;40–42 however, the conventional DLLME method uses extraction solvents heavier than water so that the extraction product is collected at the bottom of the conical test tube, which is associated with some problems during its withdrawing, particularly in real sample analysis (owing to the presence of the interfering solids). On the other side, the extraction solvents that are typically consumed in the conventional DLLME method are chlorobenzene, chloroform, carbon tetrachloride, and carbon disulphide, the toxicity of which has been proven. To overcome conventional DLLME problems, novel modes such as magnetic stirring assisted dispersive liquid–liquid microextraction (MSA-DLLME) have been innovated.43 Despite the wide usage of CIT, PAR, FLV, FLU, and SER in the treatment of depression, and in spite of several advantages and developments of DLLME, there is not any report about the simultaneous preconcentration of these important SSRIs by new modes of the DLLME technique.
The MSA-DLLME method has been previously developed in our lab for the extraction of phthalate esters44 and synthetic dyes45 in water samples using an extraction solvent with lower density than water and different homemade cells. The proposed method accrued from the benefits of magnetic stirrer, to facilitate the formation of cloudy solution, leading to the improvement in mass transfer of analytes from the aqueous solution to the extraction solvent. After centrifugation, the extraction product floating on top of the aqueous sample solution was withdrawn using a syringe through the neck of the cell for instrumental analysis.
This work is the first report of a developed mode of the DLLME technique, i.e., MSA-DLLME, for the simultaneous determination of five important selective serotonin reuptake inhibitors (SSRIs) in low concentration levels in biological fluids (urine and plasma samples). An optimization procedure based on a multivariate method was used to optimize the parameters affecting the extraction recovery. In the screening step, a fractional factorial design (26−2) was applied to determine the main effective parameters; then, to optimize the significant parameters, a response surface methodology based on central composite design (CCD) was implemented. Finally, the performance of the method for the analysis of real samples was evaluated, which showed the sufficient specificity and simplicity of the operation for the measurement of trace amounts of SSRIs in urine and plasma samples.
2. Experimental
2.1. Chemicals
All standards of SSRIs including CIT, PAR, FLV, FLU and SER (purity ≥ 98) were from Sigma-Aldrich (Steinheim, Germany). Methanol (MeOH, HPLC-grade), acetonitrile (ACN, HPLC-grade), acetone (Ace, HPLC-grade), 1-octanol (1-Oct), 2-ethyl-1-hexanol (2-EH), dodecane (Dod) and phosphoric acid (PA) were purchased from Merck (Darmstadt, Germany). The water used for the mobile phase was double distilled and deionized. An individual stock solution of each SSRI was prepared in methanol and a standard mixture solution of all target compounds was prepared in methanol at a final concentration of 100 mg L−1. The working solution was prepared via appropriate dilution of the stock solution with distilled water. All of the standard solutions were stored at 4 °C and brought to ambient temperature just prior to use.2.2. Instrumentation and operating condition
The chromatographic analysis was performed on an HPLC system consisting of the 515 solvent delivery system from Waters (Milford, MA, USA), equipped with model 7725i manual injector fitted with a 20 μL loop (Rheodyne, Cotati, CA, USA) and Perkin-ElmerLC-95 UV detector (Norwalk, CT, USA) set at 201 nm. Separation was done utilizing an isocratic elution on a C18 (250 mm × 4.6 mm, 10 μm) column from Dr. Maisch GmbH (Beim Brueckle, Germany). The mobile phase was a mixture of acetonitrile and water (40:60, v/v) containing 0.1% phosphoric acid with a flow rate of 1.0 mL min−1. Adjustment of the pH was done using a model 3030 Jenway pH meter (Bibby Scientific Ltd., Staffordshire, UK). A Hettich centrifuge model MIKRO 220 (Tuttlingen, Germany) was used to accelerate the phase separation.
2.3. Magnetic stirring-assisted dispersive liquid–liquid microextraction
Aliquots of 10.0 mL aqueous sample spiked with 100 ng mL−1 of SSRIs. The pH of the solution was adjusted to 10.2 and then it was mixed with 0.6 g of NaCl. This solution was placed in the handmade cell (Fig. 1) equipped with a capillary neck (0.6 mm i.d.) using a syringe. Subsequently, a mixture of 400 μL of methanol (as the disperser solvent) and 270 μL of 1-octanol (as extraction solvent) was rapidly injected into the sample solution stirring at 1000 rpm for 3.0 min to facilitate the formation of a cloudy state. As soon as the extraction process was completed, the cloudy solution was subjected to centrifugation for 3 min at 1000 rpm to attain appropriate phase separation. A few millilitres of doubly distilled water were added into the cell through the lateral pipe fixed on the side of the extraction cell. Consequently, the floating organic solvent raised into the capillary neck of the cell as a floating phase (Fig. 1). Finally, this product was injected to the HPLC using a 20 μL sample loop. | ||
| Fig. 1 Schematic diagram of the different steps in MSA-DLLME; (a) before injection of extraction and the disperser solvents solution; (b) injection of the extraction and disperser solvents solution, speedy agitation using a magnetic stirrer and formation of a cloudy solution; (c) after centrifugation and phase separation; and (d) after addition of water through the lateral pipe fixed on the side of the extraction cell. | ||
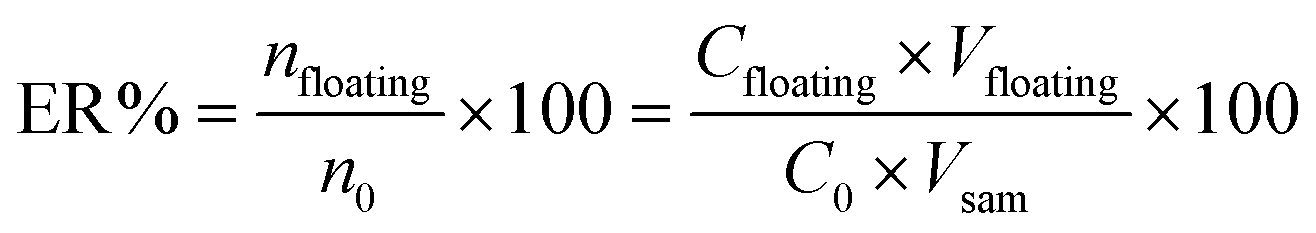
2.4. Calculation of preconcentration factor, extraction recovery and relative recovery
The preconcentration factor (PF) was defined as the ratio between the analyte concentration in the floating phase (Cfloating) and the initial concentration of analyte (C0) in the aqueous sample, as follows:
 | (1) |
The effect of contributing factors on extraction efficiency of SSRIs from standard samples was investigated by extraction recovery (ER). ER% was defined as the percentage of the total analyte (n0) extracted into the floating phase (nfloating). Accordingly, calculation of the extraction recovery, as an analytical response, was carried out using the following equation:
 | (2) |
To compare the extraction efficiencies in the different matrices of the real samples, relative recovery percent (RR%) was obtained from the following equation:
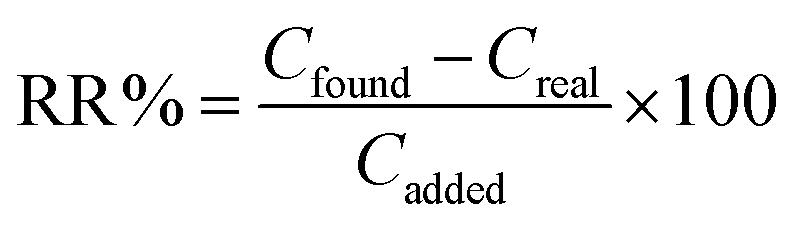 | (3) |
2.5. Statistical methods
To evaluate the potentially effective parameters of MSA-DLLME method, i.e. extraction solvent volume, disperser solvent volume, pH of the sample, salt addition, vortex time and stirring rate were screened using a fractional factorial (26−2) design including a set of 16 experiments were conducted. The main important parameters involving the extraction solvent volume and the pH of the sample solution were then considered to perform a central composite design (CCD). The CCD, being introduced by Box and Wilson for the first time, could be exploited for fitting quadratic polynomial models.46 A CCD includes 2f factorial points (Nf) with 2f star points (Nα) and one or more central points (N0) at the center of the experimental region to obtain properties such as rotatability or orthogonality, resulting in fitted quadratic polynomials.47 Therefore, the total number of CCD experiments (N) is determined by the following equation:| N = Nf + Nα + N0 | (4) |
The star points are located at ±α from the centre of the experimental domain. The values of α and N0, needed to ensure the orthogonality and rotatability, were calculated to be equal to ±1.414 and 8 using eqn (5) and (6),48 respectively
 | (5) |
 | (6) |
The extraction of SSRIs needed to be optimized simultaneously, and to obtain one quadratic model (eqn (7)), multiplication of ERs (MER) of these compounds was applied to achieve a compromise among the responses of the analytes.
 | (7) |
2.6. Sample collection and preparation
Urine and plasma samples were provided by a healthy volunteer in our lab. According to the method of Shamsipur et al.49 for the sedimentation of undesirable compounds in the bottom of the conical test tube; these samples were kept frozen at −20 °C before the extraction process. The frozen urine and plasma samples were thawed at room temperature and centrifuged for 10 min at 5000 rpm. Then, supernatants were decanted into a clean glass tube and filtered through a 0.45 μm filter. 5000 μL of filtrated urine and 1000 μL of filtrated plasma were diluted to 10.0 mL. These samples were applied for the extraction process as it is described in Section 2.3.3. Results and discussion
Several factors influence on the efficiency of the MSA-DLLME procedure involving the type of extraction and disperser solvents as well as their volume, pH of sample solution, salt addition, vortex time and stirring rate. At first, the extraction and disperser solvents were selected using one variable at a time; then the optimization of the extraction process was followed by a two-step design (FFD for screening and CCD for optimization).The pH of the sample is a key factor during the LLE process involving analytes that possess an acidic or basic moiety, because the deprotonated form of a weak acid or protonated form of a weak base normally does not extract using an organic solvent as strongly as its neutral form does;50 thus the pH should be investigated. Generally, salt addition enhances the extraction recovery of analytes in LLE based extraction methods. This is due to the fact that the presence of salt reduces the solubility of analytes in water and forces them more to the organic phase which is known as the salting out effect.51,52 At a high speed of stirring, a cloudy state with good stability is formed very well which helps the extraction solvent to be dispersed well among the aqueous solution in the form of very fine droplets, which resulted in good extraction recovery. In miniaturized extraction methods, the extraction time is one of the interesting parameters, and should be studied. The vortex time is defined as an interval time between the injection of the mixture of disperser solvent and extracting solvent, before starting to centrifuge.
3.1. Selection of the extracting solvent and disperser solvent
To obtain a good extraction recovery for MSA-DLLME of SSRIs, the selection of an appropriate mixture of extraction and disperser solvents is of prime importance. The extraction solvent must possess some properties to extract the analytes efficiently comprising: (a) a lower density than water, (b) extraction capability of interesting compounds and (c) low solubility in water. Hence, 1-octanol (density, 0.82 g mL−1), 2-ethylhexanol (density, 0.83 g mL−1) and dodecane (density, 0.75 g mL−1) were investigated for finding the most suitable extraction solvent. The miscibility of the disperser solvent in both the organic phase (extracting solvent) and aqueous phase (sample solution) has a key role in MSA-DLLME. Additionally, a suitable one must disperse the extraction solvent into very fine droplets in the aqueous phase. So acetonitrile, acetone and methanol were tested as disperser solvents in the extraction of SSRIs. For obtaining good efficiency, all combinations using dodecane, 2-ethylhexanol and 1-octanol as extractants with acetone, acetonitrile and methanol as disperser solvents were tried. Results (Fig. 2) revealed that methanol as the disperser solvent and 1-octanol as the extraction solvent provided maximum extraction recoveries (CIT: 68.85; PAR: 87.78; FLV: 63.03; FLU: 82.67 and SER: 87.39%).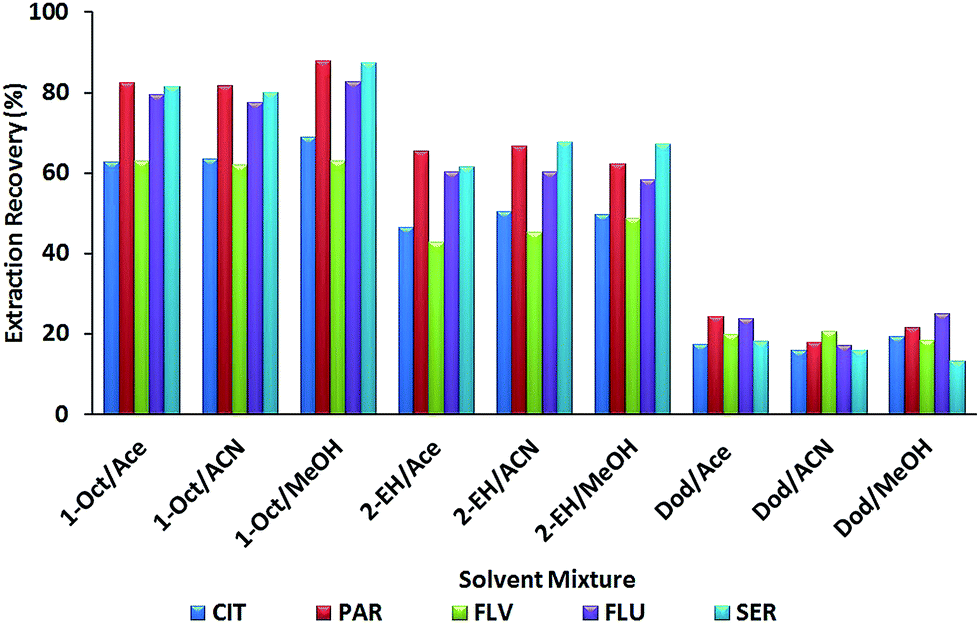 | ||
| Fig. 2 Effect of the kind of extracting and disperser solvent on extraction recovery. Extraction conditions: aqueous sample volume, 10 mL; extracting solvent volume, 250 μL; disperser solvent volume, 400 μL; without salt addition; extraction time, 3 min; stirring rate 1000 rpm. | ||
Therefore, we selected 1-octanol/methanol as a suitable set for subsequent experiments.
3.2. Screening the significant parameters
To assess the influence of variables, a two level FFD was carried out involving 16 (26−2) experiments. Table 2 provides information on the considered variables, symbols and levels of screening. The experiments were run randomly to minimize the effect of uncontrolled variables.48 The effectiveness of variables in the screening experiments is shown in the form of a Pareto chart (see Fig. 3). The Pareto chart is an efficient tool for presenting the results regarding which factor effects have the greatest impact on the dependent variable of interest. The vertical axis represents the main effects, interaction effects and quadratic effects using symbols (introduced in Table 2) and the horizontal axis shows the standardized effect estimate, which can be calculated through dividing the effect by its standard error. The bar lengths in the Pareto chart are proportional to the absolute value of the estimated effects and the vertical line represents 95% of the confidence interval. An effect exceeding this reference line is considered significant with regard to the response. Results indicated that the volume of the extraction solvent (1-octanol) and the pH of sample solution were the most important variables in the extraction of SSRIs, so these parameters were evaluated in the CCD for further assessment. As can be seen in the chart, the disperser solvent volume, salt addition, the vortex time and the stirring rate in their determined range (i.e. 200–400 μL, 2–6% w/v and 3–9 min and 500–1000 rpm) had no significant impact on ER; therefore, for the following experiments, they were fixed at a level based on their sign on the Pareto chart.| Factors | Levels | |
|---|---|---|
| Low (−1) | High (+1) | |
| (X1) extracting solvent volume (μL) | 150 | 350 |
| (X2) disperser solvent volume (μL) | 200 | 400 |
| (X3) pH value | 9 | 12 |
| (X4) salt addition (NaCl concentration; w/v) (%) | 2 | 6 |
| (X5) vortex time (min) | 3 | 9 |
| (X6) stirring rate (rpm) | 500 | 1000 |
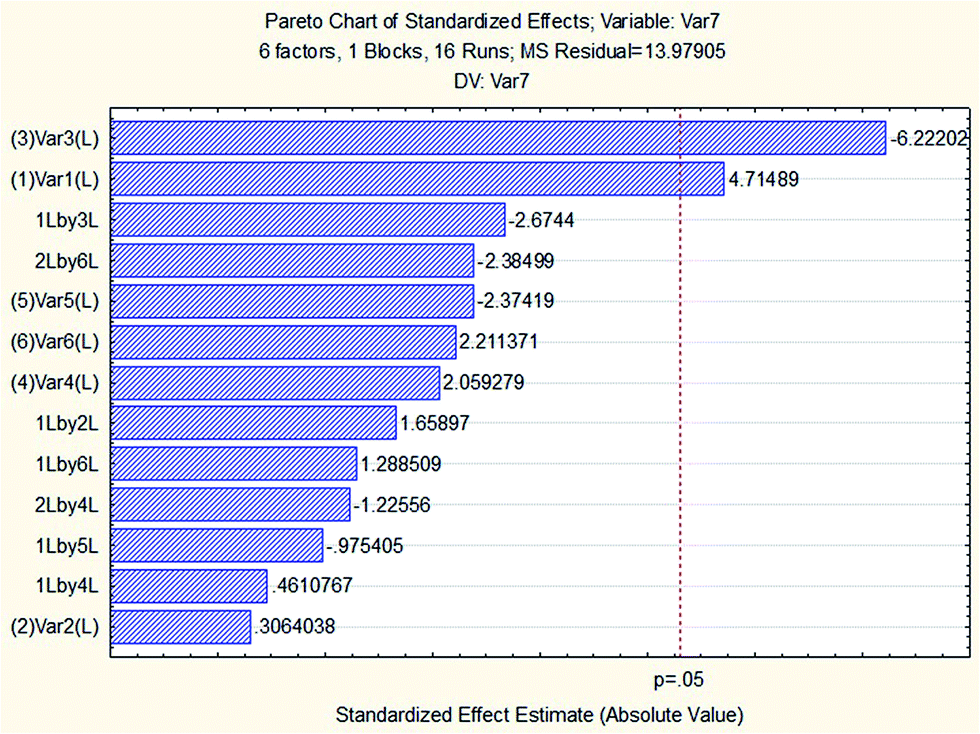 | ||
| Fig. 3 Pareto chart of the standardized effects in the screening process. | ||
3.3. Central composite design
The second step of the experimental design consisted of a CCD and was carried out randomly to eliminate the effects of uncontrollable variables by means of 16 runs (i.e. 24 + (2 × 2) + 8). Table 3 depicts the selected factors from the first step, their symbols, examined levels and design matrix as well as the response of each run. According to the experimental data, a quadratic polynomial model including main effects, the interaction effect and quadratic effects was generated (eqn (8)):| MER = 0.575119 + 0.0817291X1 − 0.236934X12 − 0.068309X2 − 0.212406X22 − 0.051694X1X2 | (8) |
| Factor | Symbol | Level | ||||
|---|---|---|---|---|---|---|
| −1.414 | −1 | 0 | 1 | 1.414 | ||
| Volume of extraction solvent (μL) | (X1) | 109 | 150 | 250 | 350 | 391 |
| pH | (X3) | 8.385 | 9 | 10.5 | 12 | 12.615 |
| Run | Ext. | pH | MER |
|---|---|---|---|
| 1 | −1.00000 | −1.00000 | 0.037638 |
| 2 | −1.00000 | 1.00000 | 0.009228 |
| 3 | 1.00000 | −1.00000 | 0.274397 |
| 4 | 1.00000 | 1.00000 | 0.039210 |
| 5 | −1.41421 | 0.00000 | 0.000056 |
| 6 | 1.41421 | 0.00000 | 0.273771 |
| 7 | 0.00000 | −1.41421 | 0.285984 |
| 8 | 0.00000 | 1.41421 | 0.085956 |
| 9 | 0.00000 | 0.00000 | 0.578941 |
| 10 | 0.00000 | 0.00000 | 0.586368 |
| 11 | 0.00000 | 0.00000 | 0.603960 |
| 12 | 0.00000 | 0.00000 | 0.534653 |
| 13 | 0.00000 | 0.00000 | 0.623762 |
| 14 | 0.00000 | 0.00000 | 0.534653 |
| 15 | 0.00000 | 0.00000 | 0.544554 |
| 16 | 0.00000 | 0.00000 | 0.594059 |
The obtained results were evaluated using ANOVA using STATISTICA 7.0 as they are shown in Table 4. The coefficient of determination (R2) is a measure of the global fit of the model. According to Joglekar and May,53 R2 should be at least 0.80 for a good fit of the model. The obtained R2 was 0.97859 which means that the model can explain the variability in response.48 A p-value < 0.05 in the ANOVA table reveals the statistical significance of an effect at a 95% confidence level. As can be found out from the p-value column, the linear and quadratic terms of the pH (X3 and X32) have the largest influence on the response. The next most significant terms are the linear and quadratic terms of the extraction solvent volume (X1 and X12). The interaction between the factors (X1X3) also showed the significant effect on the response. The “lack of fit (LOF) p-value” of 0.075960 denotes that the LOF is not significant relative to the pure error.
| Factor | Sum of squares | df | MS | F | P value | |
|---|---|---|---|---|---|---|
| X1 | 0.053437 | 1 | 0.053437 | 47.3074 | 0.000236 | Significant |
| X3 | 0.449100 | 1 | 0.449100 | 397.5842 | 0.000000 | Significant |
| X12 | 0.037330 | 1 | 0.037330 | 33.0479 | 0.000699 | Significant |
| X32 | 0.360928 | 1 | 0.360928 | 319.5262 | 0.000000 | Significant |
| X1X3 | 0.010689 | 1 | 0.010689 | 9.4630 | 0.017911 | Significant |
| LOF | 0.012030 | 3 | 0.004010 | 3.5502 | 0.075960 | Not significant |
| Pure error | 0.007907 | 7 | 0.001130 | |||
| Total SS | 0.931423 | 15 |
The relationship between the response and experimental levels of the factors was investigated by drawing MER against two experimental factors in a three-dimensional response surface plot (Fig. 4). Regarding the plotted surface, MER hits a peak at the central region in Fig. 4. This can be attributed to the fact that the extraction capability of the extracting solvent increases with further volume increase of 1-octanol. In line with the extracting solvent volume, the MER increases with increasing the pH of the sample solution. It can be attributed to the basic nature of SSRIs with pKa values of CIT: 9.59; PAR: 10.32; FLV: 9.39, FLU: 10.05; and SER: 9.47;24 thus, alkaline pHs prevent the protonation of analytes which lead to the extraction of the neutral forms of SSRIs from the aqueous phase to the organic solvent (1-octanol) with greater ease. Generally, in the central area, the cloudy state was formed completely, so that the extraction solvent could be well dispersed among the aqueous solution in the form of very little droplets, thereby enhancing the extraction recoveries. A glance at the plot reveals that the negative effect of higher volumes of 1-octanol on MER is attributed to the inadequate dispersion of extraction solvent in aqueous sample solution. Finally, the optimum condition (extraction solvent volume = 270 μL and sample pH = 10.2) of the extraction process was obtained using a grid search program which had been written in Microsoft Office Excel 2010.
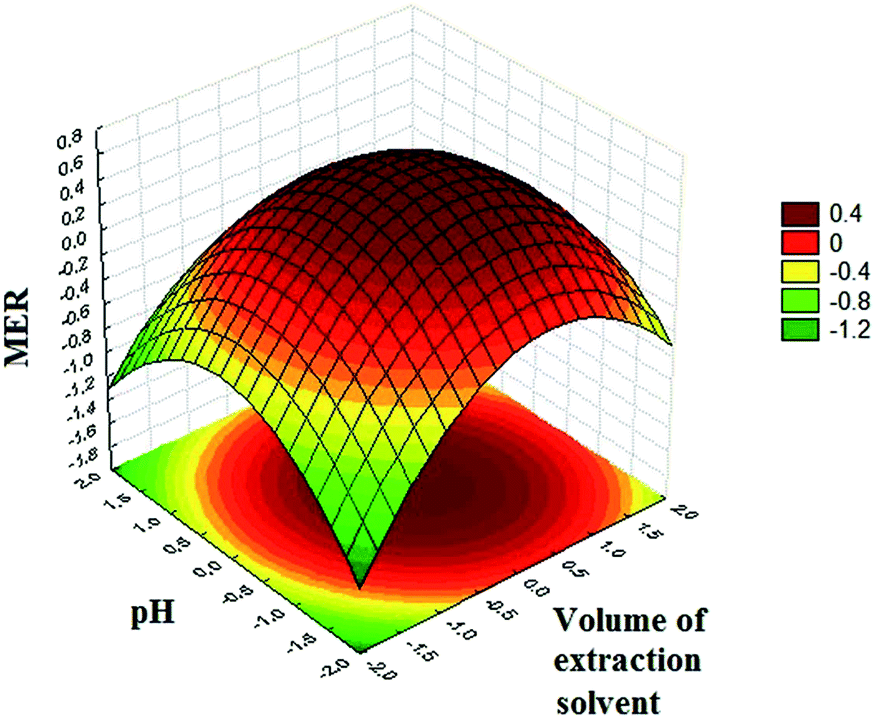 | ||
| Fig. 4 The response surface plot of MER versus: extraction solvent volume vs. pH. | ||
3.4. Analytical performance of the DLLME-HPLC for determination of SSRIs
The analytical performance in terms of linear range (LR), determination coefficient (r2), limit of detection (LOD), limit of quantification (LOQ), extraction recovery (ER) and preconcentration factor (PF) were studied for the MSA-DLLME method in distilled water, urine and plasma samples (Table 5).| Sample | Compound | Therapeutic ranges | LODa,b | LOQa,b | LRa | R2 | Intra-dayc,d | Inter-dayc,d | ||||
|---|---|---|---|---|---|---|---|---|---|---|---|---|
| Concentration found, mean ± SD | ER% ± precision (RSD%) | PF | Concentration found, mean ± SD | ER% ± precision (RSD%) | PF | |||||||
| a (ng mL−1).b n = 10.c n = 5.d Concentration: 50 ng mL−1. | ||||||||||||
| Distilled water | CIT | — | 0.18 | 0.59 | 1–500 | 0.9999 | 41.74 ± 0.50 | 83.48 ± 1.20 | 30.92 | 40.65 ± 1.19 | 81.29 ± 2.93 | 30.11 |
| PAR | — | 0.32 | 1.07 | 2.5–500 | 0.9997 | 48.11 ± 0.71 | 96.23 ± 1.47 | 35.64 | 48.44 ± 0.62 | 96.89 ± 1.28 | 35.88 | |
| FLV | — | 0.53 | 1.77 | 2.5–500 | 0.9999 | 37.56 ± 0.56 | 75.13 ± 1.48 | 27.82 | 37.95 ± 0.63 | 75.90 ± 1.67 | 28.11 | |
| FLU | — | 0.19 | 0.63 | 1–500 | 0.9998 | 46.68 ± 0.48 | 93.37 ± 1.03 | 34.58 | 46.06 ± 0.77 | 92.13 ± 1.68 | 34.12 | |
| SER | — | 0.14 | 0.47 | 1–500 | 0.9998 | 48.14 ± 0.51 | 96.29 ± 1.07 | 35.66 | 47.03 ± 1.14 | 94.06 ± 2.43 | 34.84 | |
| Urine | CIT | — | 0.40 | 1.34 | 2–1000 | 0.9996 | 41.02 ± 0.80 | 82.04 ± 1.96 | 15.19 | 41.42 ± 1.04 | 82.84 ± 2.50 | 15.34 |
| PAR | — | 0.78 | 2.61 | 5–1000 | 0.9997 | 47.85 ± 1.02 | 95.69 ± 2.13 | 17.72 | 47.78 ± 1.65 | 95.56 ± 3.44 | 17.70 | |
| FLV | — | 0.87 | 2.90 | 5–1000 | 0.9999 | 37.88 ± 0.78 | 75.77 ± 2.07 | 14.03 | 38.49 ± 1.17 | 76.99 ± 1.80 | 14.26 | |
| FLU | — | 0.38 | 1.27 | 2–1000 | 0.9998 | 45.28 ± 0.84 | 90.57 ± 1.86 | 16.77 | 45.67 ± 1.13 | 91.35 ± 2.48 | 16.92 | |
| SER | — | 0.30 | 0.99 | 2–1000 | 0.9999 | 48.45 ± 1.24 | 96.90 ± 2.57 | 17.94 | 47.95 ± 0.98 | 95.90 ± 2.05 | 17.76 | |
| Plasma | CIT | 30–130 | 2.16 | 7.22 | 10–5000 | 0.9999 | 41.14 ± 1.24 | 82.27 ± 3.02 | 3.05 | 41.00 ± 1.68 | 81.99 ± 4.10 | 3.04 |
| PAR | 70–120 | 3.77 | 12.57 | 25–5000 | 0.9995 | 47.68 ± 1.34 | 95.35 ± 2.81 | 3.53 | 47.81 ± 0.74 | 95.62 ± 1.54 | 3.54 | |
| FLV | 150–300 | 4.43 | 14.76 | 25–5000 | 0.9997 | 38.39 ± 0.54 | 76.78 ± 1.41 | 2.84 | 38.03 ± 0.83 | 76.06 ± 2.18 | 2.82 | |
| FLU | 120–300 | 2.20 | 7.34 | 10–5000 | 0.9998 | 45.70 ± 0.61 | 91.41 ± 1.32 | 3.39 | 45.38 ± 1.06 | 90.77 ± 2.32 | 3.36 | |
| SER | 10–50 | 1.48 | 4.93 | 10–5000 | 0.9998 | 48.22 ± 0.58 | 96.44 ± 1.19 | 3.57 | 48.14 ± 1.65 | 96.27 ± 3.43 | 3.57 | |
The calibration curves for SSRIs were obtained by spiking the standards directly into distilled water, urine and plasma samples under optimum conditions. Linearity was observed over the range of 1–500 and 2.5–500 ng mL−1 for distilled water, 2–1000 and 5–1000 ng mL−1 for urine and 10–5000 and 25–5000 ng mL−1 for plasma samples in the initial solution with determination coefficients more than 0.999. The limit of detection and quantification, defined as LOD = 3Sb/m and LOQ = 10Sb/m (where Sb is the standard deviation of blank and m is the slope of the calibration graph after preconcentration) were in the ranges of 0.14–4.43 and 0.47 and 14.76 ng mL−1, respectively. As it is shown in Table 5, the obtained LOQs and linear ranges are fitted perfectly in the therapeutic ranges of SSRIs mentioned in literatures.
The intra- and inter-day precision of the method in different spiked real samples were determined as the relative standard deviation (RSD%). Intra-day precision was evaluated using five determinations per concentration in 1 day, while inter-day precision was assessed via five determinations per concentration in different days. The RSD values for 50 ng mL−1 of SSRIs for five replications of extraction process, presented great precision, i.e. 1.03–3.02% for intra-day assays and 1.28–4.10% for inter-day assays.
The PF was defined as the ratio of the concentrations of the analyte in the floating phase (concentration after preconcentration) and in the initial aqueous sample solution (concentration before dilution).
Regarding the results shown in Table 5, and with respect to logKo/w and the water solubility of these SSRIs reported by Kwon et al.24 (Table 1), there is a good agreement between ER% of SSRIs and their logKo/w as well as water solubility. It seems that the water solubility parameter is not a determining factor, in the cases of PAR, FLU and SER. It might be attributed to the fact that salt addition has changed the capability of water for solvation; therefore, despite the lower water solubility of SER rather than PAR, the relatively similar ERs% were obtained for PAR and SER. But in the cases of CIT and FLV, the significant effect of water solubility on their ERs% is obvious; therefore, in spite of the highest logKo/w of CIT with respect to the other SSRIs, its low ER% reveals that the water solubility of CIT (15460 mg L−1) conquers its logKo/w as a determining factor of extraction, in this case. Furthermore, the obtained ER% for FLV is another evidence for this asseveration. FLV's lowest ER% can be related to its very high water solubility and low logKo/w.
3.5. Analysis of real samples using MSA-DLLME-HPLC
Real urine and plasma samples were examined to evaluate the applicability and matrix effects for the extraction and determination of SSRIs using the proposed method. The urine and plasma samples were spiked with SSRIs standards; subsequently, they were extracted using the MSA-DLLME technique and finally the extracts were analyzed via HPLC. Fig. 5a–e show the chromatograms obtained from the SSRIs standards as well as the urine and plasma blanks and spiked samples via MSA-DLLME-HPLC.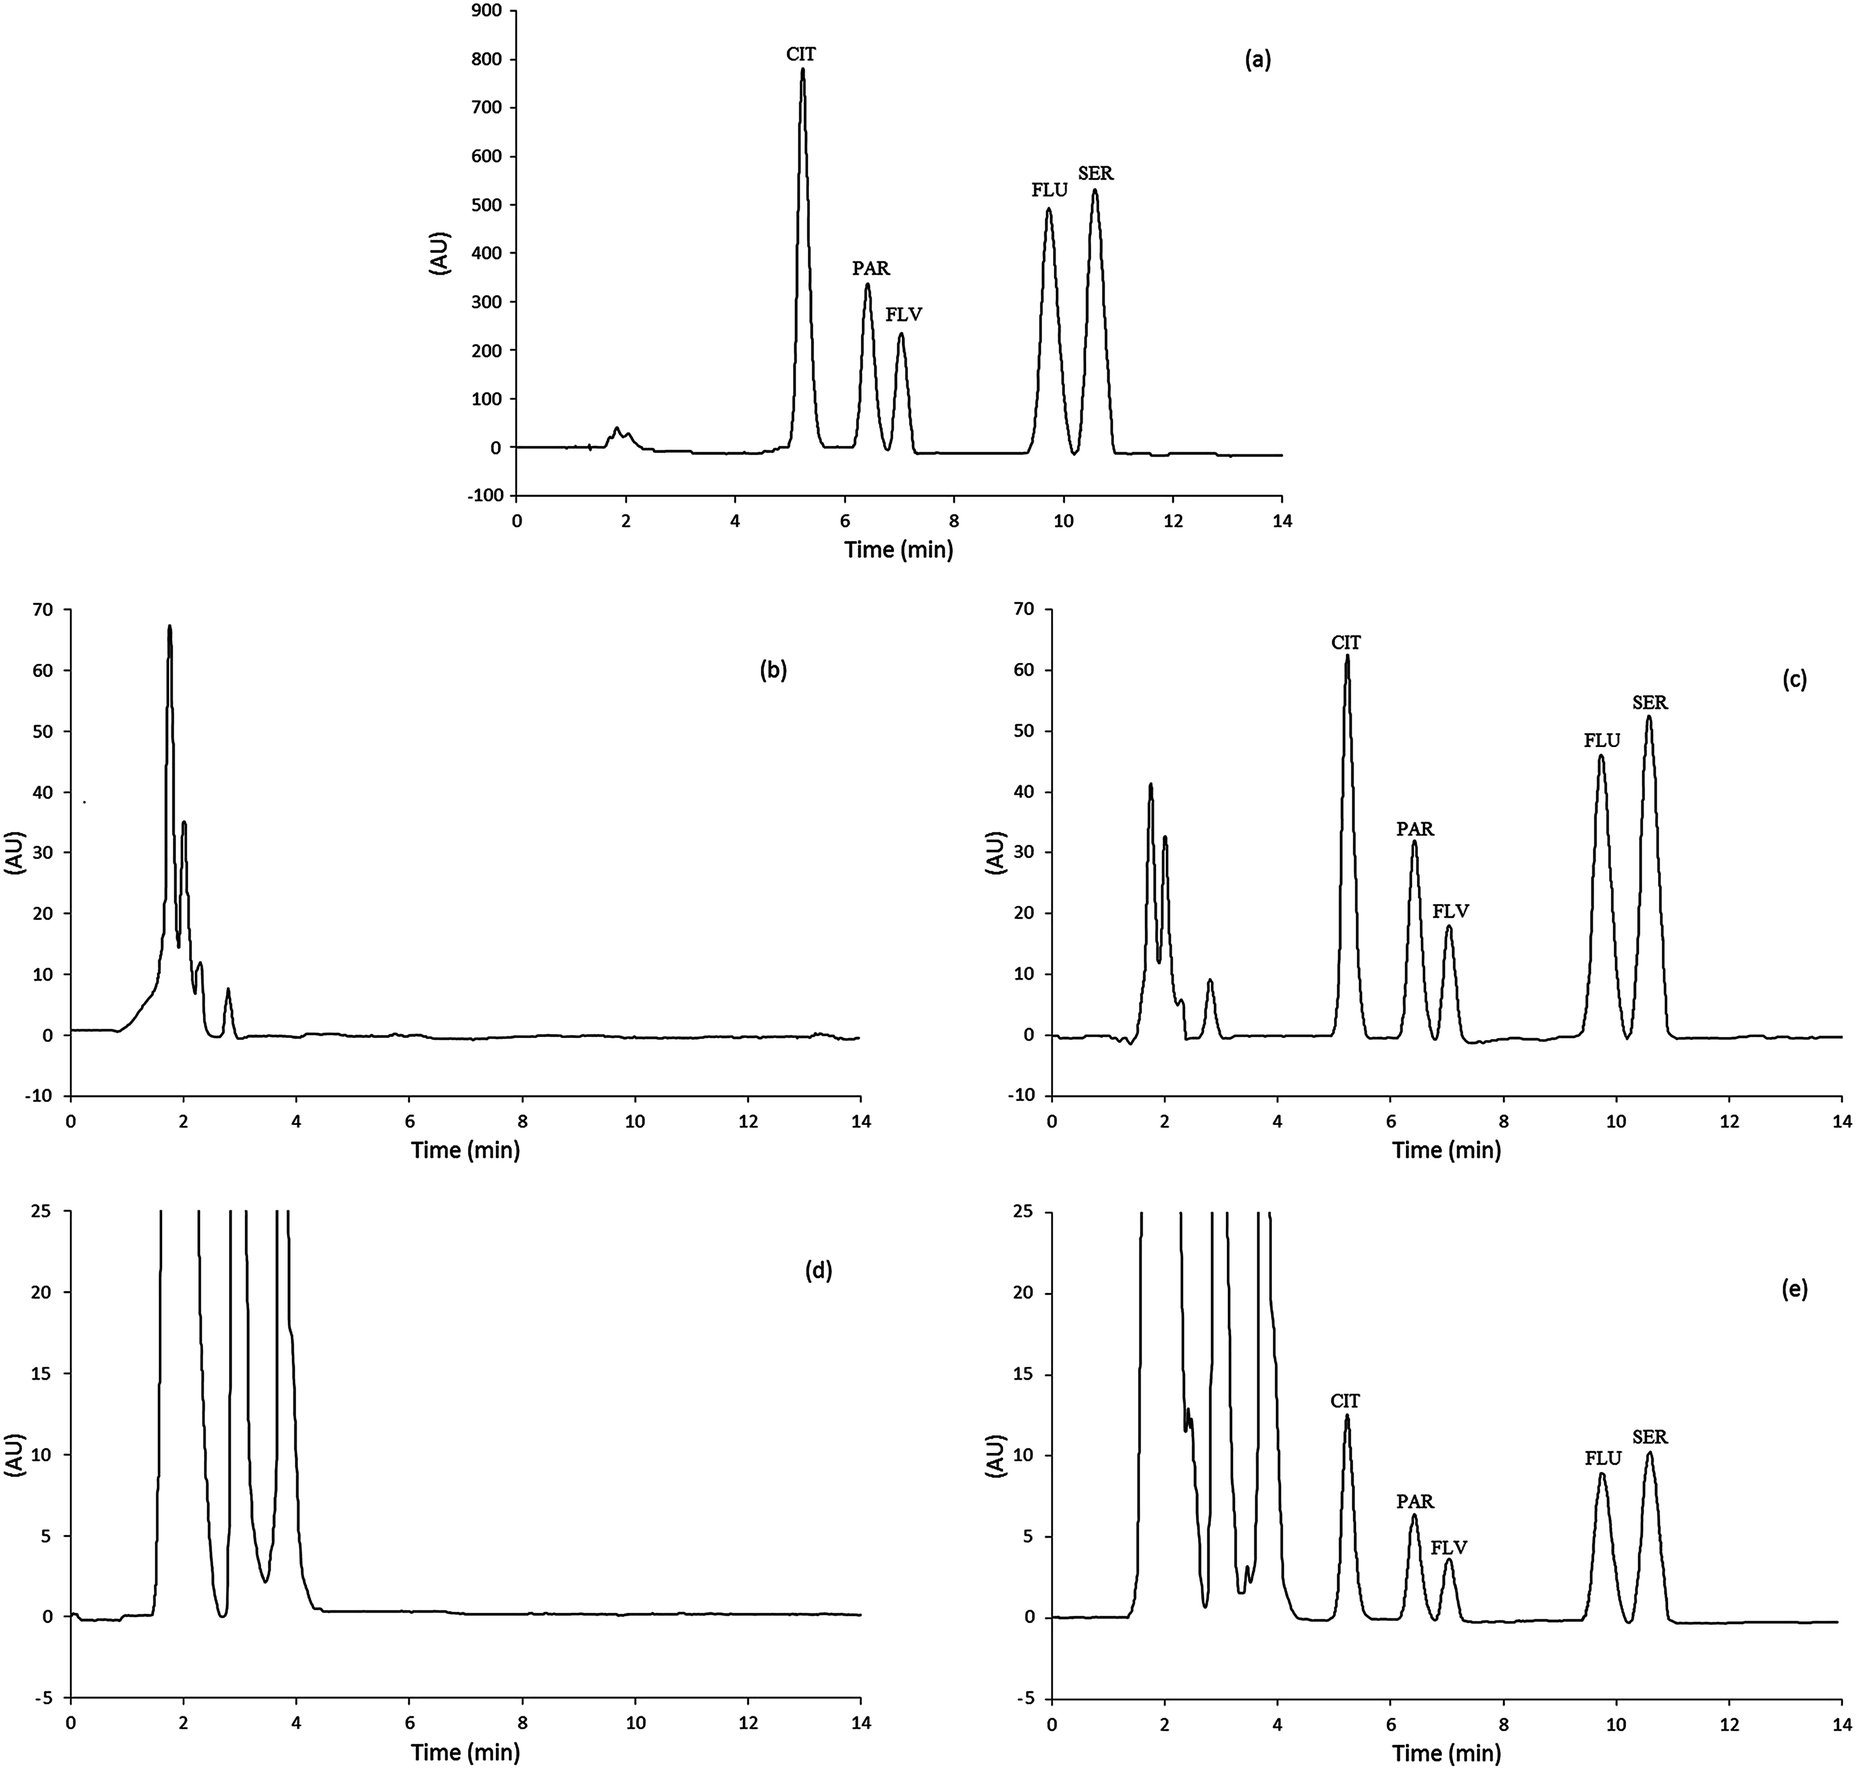 | ||
| Fig. 5 Representative chromatograms of the SSRIs standard solution and real samples: (a) chromatogram of the standard solution of SSRIs with a concentration of 10 mg L−1 after direct injection to the HPLC; (b) chromatogram of the urine sample; (c) urine spiked with 50 ng mL−1 of SSRIs after MSA-DLLME; (d) chromatogram of the plasma sample; and (e) plasma spiked with 50 ng mL−1 of SSRIs after MSA-DLLME; the experimental details are described in the text. | ||
Regarding Table 6, the results of intra-day analysis of urine and plasma samples show the extraction recoveries of SSRIs (RR%) between 75.06% and 96.32% with RSDs less than 3%. The RR% which obtained via three inter-day replicates analysis were between 75.38% and 96.88% with RSDs less than 4%. This indicates that with respect to the complexity of the matrices studied, the values of RR% and RSDs%, obtained using the MSA-DLLME-HPLC-UV method, are in satisfactory agreement with the added amounts of SSRI standards.
| Sample | Compound | Found | Added | Intra-day (n = 3) | Inter-day (n = 3) |
|---|---|---|---|---|---|
| RR% ± RSD% | RR% ± RSD% | ||||
| a The values of added and found amounts for urine and plasma were reported in ng mL−1. | |||||
| Urine | Citalopram | Nd | 75 | 82.46 ± 2.15 | 82.34 ± 2.26 |
| Nd | 300 | 82.35 ± 1.48 | 81.60 ± 2.04 | ||
| Paroxetine | Nd | 75 | 95.03 ± 1.31 | 95.17 ± 1.07 | |
| Nd | 300 | 95.42 ± 1.64 | 96.14 ± 1.88 | ||
| Fluvoxamine | Nd | 75 | 76.43 ± 1.67 | 76.57 ± 2.68 | |
| Nd | 300 | 76.92 ± 1.38 | 77.84 ± 2.59 | ||
| Fluoxetine | Nd | 75 | 91.24 ± 1.56 | 90.59 ± 1.51 | |
| Nd | 300 | 92.07 ± 1.33 | 90.19 ± 1.93 | ||
| Sertraline | Nd | 75 | 95.82 ± 1.47 | 96.20 ± 2.55 | |
| Nd | 300 | 96.09 ± 1.41 | 95.96 ± 2.44 | ||
| Plasma | Citalopram | Nd | 75 | 82.46 ± 1.44 | 81.73 ± 2.18 |
| Nd | 300 | 79.13 ± 1.10 | 81.81 ± 2.01 | ||
| Paroxetine | Nd | 75 | 94.49 ± 1.85 | 95.02 ± 2.63 | |
| Nd | 300 | 96.32 ± 1.91 | 96.09 ± 1.76 | ||
| Fluvoxamine | Nd | 75 | 75.06 ± 1.67 | 75.38 ± 1.80 | |
| Nd | 300 | 77.02 ± 1.89 | 76.78 ± 3.09 | ||
| Fluoxetine | Nd | 75 | 90.66 ± 1.40 | 89.14 ± 2.20 | |
| Nd | 300 | 91.30 ± 1.21 | 90.28 ± 1.40 | ||
| Sertraline | Nd | 75 | 96.02 ± 1.99 | 96.88 ± 2.38 | |
| Nd | 300 | 95.69 ± 2.61 | 96.04 ± 2.08 | ||
4. Conclusions
This work is the first report of a developed mode of the DLLME technique for the simultaneous determination of five important SSRIs in low concentration levels in biological fluids. MSA-DLLME was used to overcome some drawbacks of DLLME such as difficulties associated with conventional DLLME, such as interferences during the withdrawal of the extraction product from the bottom of the conical test tube in real sample analysis as well as usage of chlorinated extraction solvents used in DLLME which are environmentally unfriendly and very toxic. MSA-DLLME combined with HPLC-UV has been developed successfully for the rapid extraction and determination of SSRIs as a group of second generation of antidepressants in different biological matrices including urine and plasma samples. The presented method utilizes an organic extraction solvent lighter than water as well as a homemade cell designed for the precise collection of the extraction product which resulted in several merits like minimum consumption of organic solvents, short extraction time, exact sample clean-up and very simple and inexpensive equipment.In a comparative study which is shown in Table 7, almost in both matrices, the represented method shows the desirable LOD and wider linear range for the quantitative analysis of SSRIs. RSD quantities reveal that the MSA-DLLME provides a precise method for the determination of SSRIs at trace levels by relatively high preconcentration factors. The precision of the proposed method was higher than previous methods and the linearity was in a wide suitable range.
| Method | Matrix (sample volume) | Extractant | Compound | LOQa | LRa | R2 | RSD (%) | PF |
|---|---|---|---|---|---|---|---|---|
| a ng mL−1. | ||||||||
| LLE-HPLC-UV14 | Plasma (1.00 mL) | Hexane + isoamyl alcohol | CIT | 5 | 5–2000 | 0.999 | 2.4 | 3.052 |
| PAR | 10 | 10–2000 | 0.999 | 1.9 | 3.036 | |||
| FLU | 10 | 10–2000 | 0.999 | 2.7 | 2.944 | |||
| SER | 10 | 10–2000 | 0.999 | 2.7 | 3.204 | |||
| SPE-GC-MS11 | Plasma (1.00 mL) | 5% ammonia in methanol | CIT | 10 | 50–125 | 0.999 | 8.4 | 17.04 |
| PAR | 5 | 50–125 | 0.999 | 1.5 | 18.2 | |||
| FLV | 12.5 | 50–125 | 0.999 | 2.1 | 18.8 | |||
| FLU | 12.5 | 50–125 | 0.999 | 5.9 | 18.6 | |||
| SER | 12.5 | 50–125 | 0.999 | 13.2 | 21.2 | |||
| SPME-LC-UV28 | Plasma (250 μL) | Phosphate buffer solution + acetonitrile | CIT | 20 | 20–1200 | 0.999 | 0.70 | 11 |
| PAR | 20 | 20–1200 | 0.999 | 0.37 | 12 | |||
| FLU | 25 | 25–1200 | 0.998 | 0.79 | 12 | |||
| SER | 25 | 25–1200 | 0.998 | 0.70 | 10 | |||
| SBSE-LC-UV32 | Plasma (1.00 mL) | Phosphate buffer solution + acetonitrile | CIT | 20 | 20–500 | 0.9974 | 4.00 | 5 |
| PAR | 30 | 30–500 | 0.9942 | 2.24 | 5 | |||
| FLU | 30 | 30–500 | 0.9980 | 2.97 | 5 | |||
| SER | 50 | 50–500 | 0.9981 | 2.20 | 5 | |||
| HF-LPME-HPLC-UV35 | Plasma (3.67 mL) | n-Dodecane | SER | 2.3 | 5–500 | 0.9969 | 4.9 | 36.1 |
| Present work | Plasma (1.00 mL) | 1-Octanol | CIT | 7.22 | 10–5000 | 0.9999 | 3.02 | 3.05 |
| PAR | 12.57 | 25–5000 | 0.9995 | 2.81 | 3.53 | |||
| FLV | 14.76 | 25–5000 | 0.9997 | 1.41 | 2.84 | |||
| FLU | 7.34 | 10–5000 | 0.9998 | 1.32 | 3.39 | |||
| SER | 4.93 | 10–5000 | 0.9998 | 1.19 | 3.57 | |||
| HF-LPME-HPLC-UV35 | Urine (11.00 mL) | n-Dodecane | SER | 2.3 | 5–500 | 0.9969 | 8.2 | 144.6 |
| DLLME-Spectrofluorimetry40 | Urine (200 μL) | Chloroform | FLU | 9.28 | 10–800 | 0.9993 | <3.00 | 10 |
| Present work | Urine (5.00 mL) | 1-Octanol | CIT | 1.34 | 2–1000 | 0.9996 | 1.96 | 15.19 |
| PAR | 2.61 | 5–1000 | 0.9997 | 2.13 | 17.72 | |||
| FLV | 2.90 | 5–1000 | 0.9999 | 2.07 | 14.03 | |||
| FLU | 1.27 | 2–1000 | 0.9998 | 1.86 | 16.77 | |||
| SER | 0.99 | 2–1000 | 0.9999 | 2.57 | 17.94 | |||
In this work, 1-octanol was used as an extraction solvent with a lower density than water, and has a good chromatographic behaviour in comparison with chlorinated solvents and it can be used for instrumental analysis without any evaporation step. To recapitulate, the feasibility of the suggested method for the extraction of SSRIs from plasma and urine samples shows the special features of MSA-DLLME as a powerful and rapid technique for routine analysis of biological samples. Also, the results demonstrate that, regarding the complexity of the biological matrices like urine and plasma samples, this analytical method is worthy for conducting therapeutic and toxicological studies on patients suffering from depression.
References
- A. Carlsson and D. T. Wong, Life Sci., 1997, 61, 1203 CrossRef CAS PubMed.
- R. Mandrioli, L. Mercolini, M. A. Saracino and M. A. Raggi, Curr. Med. Chem., 2012, 19, 1846–1863 CrossRef CAS PubMed.
- N. Unceta, A. Gómez-Caballero, A. Sánchez, S. Millán, M. C. Sampedro, M. A. Goicolea, J. Sallés and R. J. Barrio, J. Pharm. Biomed. Anal., 2008, 46, 763–770 CrossRef CAS PubMed.
- T. Kosjek and E. Heath, TrAC, Trends Anal. Chem., 2010, 29, 832–847 CrossRef CAS.
- J. M. Ferguson, Primary Care Companion to The Journal of Clinical Psychiatry, 2001, vol. 3, pp. 22–27 Search PubMed.
- Z. Şentürk, C. Saka and İ. Teğin, Rev. Anal. Chem., 2011, 30, 87–122 Search PubMed.
- P. Baumann, C. Hiemke, S. Ulrich, G. Eckermann, I. Gaertner, M. Gerlach, H. J. Kuss, G. Laux, B. Müller-Oerlinghausen, M. L. Rao, P. Riederer and G. Zernig, Pharmacopsychiatry, 2004, 37, 243–265 CrossRef CAS PubMed.
- M.-M. Zheng, S.-T. Wang, W.-K. Hu and Y.-Q. Feng, J. Chromatogr. A, 2010, 1217, 7493–7501 CrossRef CAS PubMed.
- S. M. R. Wille, K. E. Maudens, C. H. Van Peteghem and W. E. E. Lambert, J. Chromatogr. A, 2005, 1098, 19–29 CrossRef CAS PubMed.
- J. Pablo Lamas, C. Salgado-Petinal, C. García-Jares, M. Llompart, R. Cela and M. Gómez, J. Chromatogr. A, 2004, 1046, 241–247 CrossRef CAS.
- S. M. R. Wille, P. Van Hee, H. M. Neels, C. H. Van Peteghem and W. E. Lambert, J. Chromatogr. A, 2007, 1176, 236–245 CrossRef CAS PubMed.
- S. R. Wille, E. De Letter, M. A. Piette, L. Van Overschelde, C. Van Peteghem and W. Lambert, J. Leg. Med., 2009, 123, 451–458 CrossRef PubMed.
- J. J. Berzas Nevado, M. J. Villaseñor Llerena, C. Guiberteau Cabanillas, V. Rodríguez Robledo and S. Buitrago, J. Sep. Sci., 2006, 29, 103–113 CrossRef CAS PubMed.
- W. R. Malfará, C. Bertucci, M. E. Costa Queiroz, S. A. Dreossi Carvalho, M. de Lourdes Pires Bianchi, E. J. Cesarino, J. A. Crippa and R. H. Costa Queiroz, J. Pharm. Biomed. Anal., 2007, 44, 955–962 CrossRef PubMed.
- C. Frahnert, M. L. Rao and K. Grasmäder, J. Chromatogr. B: Anal. Technol. Biomed. Life Sci., 2003, 794, 35–47 CrossRef CAS.
- E. Lacassie, J. M. Gaulier, P. Marquet, J. F. Rabatel and G. Lachâtre, J. Chromatogr. B: Biomed. Sci. Appl., 2000, 742, 229–238 CrossRef CAS.
- A. Lucca, G. Gentilini, S. Lopez-Silva and A. Soldarini, Ther. Drug Monit., 2000, 22, 271–276 CrossRef CAS PubMed.
- G. Tournel, N. Houdret, V. Hédouin, M. Deveaux, D. Gosset and M. Lhermitte, J. Chromatogr. B: Biomed. Sci. Appl., 2001, 761, 147–158 CrossRef CAS.
- A. de Castro, M. d. M. R. Fernandez, M. Laloup, N. Samyn, G. De Boeck, M. Wood, V. Maes and M. López-Rivadulla, J. Chromatogr. A, 2007, 1160, 3–12 CrossRef CAS PubMed.
- T. Gondová, D. Halamová and K. Špacayová, J. Liq. Chromatogr. Relat. Technol., 2008, 31, 2429–2441 CrossRef.
- J. J. B. Nevado and A. M. C. Salcedo, Chromatographia, 2002, 55, 369–373 CAS.
- V. Pucci, S. Fanali, C. Sabbioni and M. A. Raggi, J. Sep. Sci., 2002, 25, 1096–1100 CrossRef CAS.
- X. Zhou, M. He, B. Chen and B. Hu, Analyst, 2015, 140, 1662–1671 RSC.
- J. W. Kwon and K. L. Armbrust, Bull. Environ. Contam. Toxicol., 2008, 81, 128–135 CrossRef CAS PubMed.
- M. Cruz-Vera, R. Lucena, S. Cárdenas and M. Valcárcel, Anal. Bioanal. Chem., 2008, 391, 1139–1145 CrossRef CAS PubMed.
- C. Wang, Q. Wu, C. Wu and Z. Wang, J. Hazard. Mater., 2011, 185, 71–76 CrossRef CAS PubMed.
- B. J. G. Silva, F. M. Lanças and M. E. C. Queiroz, J. Chromatogr. B: Anal. Technol. Biomed. Life Sci., 2008, 862, 181–188 CrossRef CAS PubMed.
- A. R. Chaves, G. Chiericato Júnior and M. E. C. Queiroz, J. Chromatogr. B: Anal. Technol. Biomed. Life Sci., 2009, 877, 587–593 CrossRef CAS PubMed.
- C. Salgado-Petinal, J. P. Lamas, C. Garcia-Jares, M. Llompart and R. Cela, Anal. Bioanal. Chem., 2005, 382, 1351–1359 CrossRef CAS PubMed.
- C. Fernandes, P. Jiayu, P. Sandra and F. M. Lanças, Chromatographia, 2006, 64, 517–521 CAS.
- A. R. Chaves, S. M. Silva, R. H. C. Queiroz, F. M. Lanças and M. E. C. Queiroz, J. Chromatogr. B: Anal. Technol. Biomed. Life Sci., 2007, 850, 295–302 CrossRef CAS PubMed.
- L. P. Melo, A. M. Nogueira, F. M. Lanças and M. E. C. Queiroz, Anal. Chim. Acta, 2009, 633, 57–64 CrossRef CAS PubMed.
- C. Fernandes, E. Van Hoeck, P. Sandra and F. M. Lanças, Anal. Chim. Acta, 2008, 614, 201–207 CrossRef CAS PubMed.
- A. F. F. Oliveira, E. C. de Figueiredo and Á. J. dos Santos-Neto, J. Pharm. Biomed. Anal., 2013, 73, 53–58 CrossRef CAS PubMed.
- A. Esrafili, Y. Yamini and S. Shariati, Anal. Chim. Acta, 2007, 604, 127–133 CrossRef CAS PubMed.
- M. Rezaee, Y. Assadi, M.-R. Milani Hosseini, E. Aghaee, F. Ahmadi and S. Berijani, J. Chromatogr. A, 2006, 1116, 1–9 CrossRef CAS PubMed.
- E. Ranjbari, A.-A. Golbabanezhad-Azizi and M. R. Hadjmohammadi, Talanta, 2012, 94, 116–122 CrossRef CAS PubMed.
- A. Jouyban, M. H. Sorouraddin, M. A. Farajzadeh, M. H. Somi and R. Fazeli-Bakhtiyari, Talanta, 2015, 134, 681–689 CrossRef CAS PubMed.
- P. Biparva, E. Ranjbari and M. R. Hadjmohammadi, Anal. Chim. Acta, 2010, 674, 206–210 CrossRef CAS PubMed.
- A. Bavili Tabrizi and A. Rezazadeh, Adv. Pharm. Bull., 2012, 2, 157–164 Search PubMed.
- S.-W. Huang, M.-M. Hsieh and S. Y. Chang, Talanta, 2012, 101, 460–464 CrossRef CAS PubMed.
- A. A. Alizadeh Nabil, N. Nouri and M. A. Farajzadeh, Biomed. Chromatogr., 2015, 29, 1094–1102 CrossRef CAS PubMed.
- P.-P. Zhang, Z.-G. Shi, Q.-W. Yu and Y.-Q. Feng, Talanta, 2011, 83, 1711–1715 CrossRef CAS PubMed.
- E. Ranjbari and M. R. Hadjmohammadi, Talanta, 2012, 100, 447–453 CrossRef CAS PubMed.
- E. Ranjbari and M. R. Hadjmohammadi, Talanta, 2015, 139, 216–225 CrossRef CAS PubMed.
- G. E. P. Box and K. B. Wilson, Journal of the Royal Statistical Society. Series B (Methodological), 1951, vol. 13, pp. 1–45 Search PubMed.
- R. H. Myers, D. C. Montgomery and C. M. Anderson-Cook, Response surface methodology: process and product optimization using designed experiments, John Wiley & Sons, 2009 Search PubMed.
- E. D. Morgan, Chemometrics: experimental design, Wiley, New York, 1995 Search PubMed.
- M. Shamsipur and N. Fattahi, J. Chromatogr. B: Anal. Technol. Biomed. Life Sci., 2011, 879, 2978–2983 CrossRef CAS PubMed.
- E. Ranjbari, P. Biparva and M. R. Hadjmohammadi, Talanta, 2012, 89, 117–123 CrossRef CAS PubMed.
- M. I. Leong and S. D. Huang, J. Chromatogr. A, 2008, 1211, 8–12 CrossRef CAS PubMed.
- L. Fu, X. Liu, J. Hu, X. Zhao, H. Wang and X. Wang, Anal. Chim. Acta, 2009, 632, 289–295 CrossRef CAS PubMed.
- A. M. Joglekar and A. T. May, Cereal Foods World, 1987, 32, 857–868 Search PubMed.
| This journal is © The Royal Society of Chemistry 2016 |