Electrical properties, conduction mechanism and modulus of diphosphate compounds
Y. Ben Taher*a,
N. Moutiab,
A. Oueslatia and
M. Gargouria
aCondensed Matter Laboratory, University of Sfax, Faculty of Sciences, B.P. 1171, 3000 Sfax, Tunisia. E-mail: youssef.btaher@yahoo.fr; Tel: +216 20 194 469
bLaboratoire de Physique des Matériaux et des Nanomatériaux Appliquée à l'Environnement, Faculté des Sciences de Gabès, Tunisia
First published on 7th April 2016
Abstract
Rubidium aluminium diphosphate was synthesized by a conventional solid-state technique and its conduction properties determined by impedance spectroscopy. X-ray diffraction analysis indicated the formation of a single-phase monoclinic structure (space group P21/c). The AC conductivity was determined using impedance spectroscopy over the frequency and temperature ranges of 40 Hz to 7 MHz and 400–700 K, respectively. The real and imaginary parts of the complex impedance were well-fitted to the equivalent circuit model and the frequency dependence of the AC conductivity followed Jonscher's law. The close values of the activation energies obtained from the relaxation time and the grain conductivity (σg) indicated that transport could be modelled by a hopping mechanism, probably dominated by the movement of Rb+ cations. The correlated barrier hopping model was used to describe the dominant conduction mechanism. A single relaxation peak was observed in the imaginary part of the modulus suggesting the grain response of the system.
1. Introduction
Since the first characterization of KAlP2O7 by d'Yvoire,1 much research has been devoted to the MIMIIIP2O7 type diphosphates. The interest in these compounds comes from both fundamental and applied fields of research and has included their structural characterization and potential technological applications. Some of these compounds have magnetic2,3 and catalytic4,5 properties and they have been proposed as solid electrolytes for rechargeable alkaline batteries6,7 and as nanoparticles for the decontamination and remediation of water.8 The study of phosphates became very popular after the development of the NASICON group of fast ionic conductors.9,10 We have previously reported the electrical properties of MAlP2O7 (M = K, Ag, Na) compounds.11–13 In the study reported here, we investigated MAlP2O7, including its electrical and dielectric properties, using impedance spectroscopy to determine the conduction mechanism. MAlP2O7 can be distinguished by its crystal structure. The structural arrangement consists of corner-sharing AlO6 octahedra and P2O7 diphosphate groups; the three-dimensional framework delimits the tunnels where the monovalent ions reside. RbAlP2O7 has a tunnel structure in which the Rb ions reside, which may explain the good conductivity of this compound.We investigated the electrical properties and conduction mechanism of RbAlP2O7 using impedance spectroscopy to determine the conduction and dielectric relaxation mechanisms. There has been no previously published report of the DC and AC electrical conductivities of RbAlP2O7. The information on conductivity provided by this study may be important in practical applications.
2. Experimental
RbAlP2O7 was synthesized by a conventional solid-state reaction. Stoichiometric quantities of Rb2CO3, Al2O3 and NH4H2PO4 were ground thoroughly and mixed. The homogenized powder was calcined at 573 K for 8 h to eliminate NH3, CO2 and H2O. The resulting product was reground, pelletized into cylindrical pellets and heated from room temperature to 1073 K for 8 h.The products were confirmed by XRD. The XRD pattern of the material was recorded at room temperature using a Phillips PW 1710 powder diffractometer with Cu Kα radiation at 1.5418 Å over a wide range of Bragg angles (10° ≤ 2α ≤ 65°). A pellet about 8 mm in diameter and 1.1 mm thick was used for electrical conductivity measurements with 3 T cm−2 uniaxial pressures. The measurements were performed using an Agilent 4294A impedance analyser (two platinum electrodes and evaporation sputtering). The temperature range was 500–700 K.
3. Results and discussion
3.1. Powder X-ray analysis
 | ||
| Fig. 1 Rietveld refinement for RbAlP2O7: experimental data are shown in red; calculated data in black; difference between them in blue; and Bragg positions in green. | ||
Profile refinement started with the scale and background parameters, followed by the unit cell parameters. All the reflection peaks were indexed to a monoclinic structure with the space group P21/c. The refined unit cell parameters of the compound were: a = 7.401 Å (3), b = 9.921 Å (4), c = 8.224 Å (3) and β = 105.611° (7).
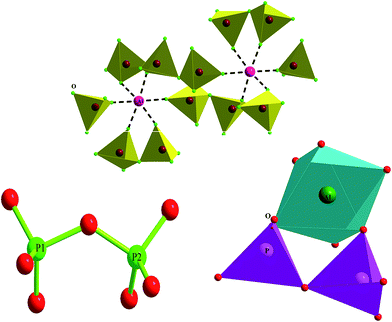
A view of the structure along the [110] direction is shown in Fig. 2. Rubidium aluminium diphosphate is composed of [P2O7] and [AlO6] groups. The [P2O7]4− anion consists of a pair of corner-sharing PO4 groups and the Al3+ cations are bonded to six oxygen atoms. Each octahedron is linked to five different P2O7 groups (Fig. 2). The AlO6 octahedra bridge the diphosphate anions, forming a three-dimensional network with a tunnel filled by Rb+ cations (Fig. 2). This arrangement is expected to promote ionic mobility.
The P2O7 diphosphate anion is characterized by a P–O–P angle of 127.8° (10) and the P–O bond ranges from 1.49 (2) to 1.68 (2) Å. The AlO6 octahedra are characterized by an Al–O bond ranging from 1.93 (1) Å to 1.98 (1) Å.
3.2. Impedance analysis and equivalent circuit
Impedance spectroscopy is the most reliable technique with which to study the electrical properties and processes of materials. It gives a direct correlation between the response of a real system and an idealized model circuit composed of discrete electrical components.14 It helps to separate grain and grain boundaries contributions in the transport properties of the materials.Fig. 4 shows the complex impedance plane plots of RbAlP2O7 at different temperatures. In the temperature range explored, the complex plot consists of a depressed semi-circle. The decentralization is indicative of a non-Debye-type relaxation process and the material obeys Cole–Cole formalism.15 The point of intercept on the real axis shifts towards the origin of the complex impedance spectrum, indicating a decrease in the resistive properties of this material. The presence of single semi-circular arcs indicates that the electrical processes in the material are a result of contributions from the bulk material16 and thus it can be modelled as an equivalent electrical circuit consisting of a parallel combination of a bulk resistance (Rg) and a bulk capacitance (CPEg). The impedance of the constant phase element is
 | (1) |
 | ||
| Fig. 4 Nyquist plots and equivalent circuit model of RbAlP2O7. The solid curves are fitted to the equivalent circuit elements. | ||
| T (K) | R (kΩ) | Q (μF) | α |
|---|---|---|---|
| 500 | 856 | 0.145 | 0.944 |
| 520 | 696 | 0.163 | 0.932 |
| 540 | 549 | 0.147 | 0.944 |
| 560 | 445 | 0.142 | 0.949 |
| 580 | 365 | 0.172 | 0.933 |
| 600 | 300 | 0.172 | 0.933 |
| 620 | 256 | 0.164 | 0.939 |
| 640 | 214 | 0.172 | 0.936 |
| 660 | 168 | 0.188 | 0.931 |
| 680 | 137 | 0.187 | 0.932 |
| 700 | 107 | 0.201 | 0.928 |
The expressions of the real and imaginary components of the impedance related to the equivalent circuit are:
 | (2) |
Fig. 5 shows the variation of Z′ as a function of frequency at different temperatures. The solid line represents best fit to experimental data according to eqn (2). The value of Z′ decreases with frequency followed by plateau-type behaviour in the high-frequency region. The decrease in Z′ with increasing temperature and frequency indicates the possibility of an increase in the AC conductivity with increasing temperature and frequency.17
The coincidence of the Z′ values at high frequencies for all temperatures indicates a possible release of the space charge as a result of a reduction in the resistive behaviour of the material with increasing temperature.18
Fig. 6a shows the variation in the imaginary part of the impedance Z′′ as a function of frequency at different temperatures. The solid line represents the best fit to the experimental data according to eqn (3). The nature of the variation in Z′′ with frequency is characterized by: (1) the appearance of peaks at a particular frequency; (2) a decrease in the height of the peaks with increasing temperature; (3) a marked asymmetry in the pattern of the peaks; and (4) merging of the spectra at higher frequencies. In addition, the frequency ωmax (corresponding to the maximum value of Z′′) gives the most probable relaxation time τ from the condition ωmaxτ = 1. Such behaviour therefore indicates the presence of relaxation in the system.19 A similar observation was made by Ben Taher et al.20 for AgAlP2O7. The excellent agreement between the experimental (scatter) and theoretical curve (line) indicates that the equivalent circuit describes the compound–electrolyte interface reasonably well.
 | ||
| Fig. 6 (a) Variation of imaginary part of the impedance as a function of frequency at various temperatures. (b) Variation of ln(τ) versus 1000/T. | ||
Fig. 6b shows the plot of the relaxation time τ = 1/ωmax as a function of the inverse of the absolute temperature. The linear behaviour of the relaxation time is in close agreement with the Arrhenius relation τ = τ0![[thin space (1/6-em)]](https://www.rsc.org/images/entities/char_2009.gif) exp(−Ea/kBT), where Ea is the activation energy, kB is the Boltzmann constant and T is the absolute temperature. The obtained activation energy (Ea) estimated from the Arrhenius plot is 0.85 eV.
exp(−Ea/kBT), where Ea is the activation energy, kB is the Boltzmann constant and T is the absolute temperature. The obtained activation energy (Ea) estimated from the Arrhenius plot is 0.85 eV.
The grain conductivity was obtained from (Rg) by the relation:
 | (3) |
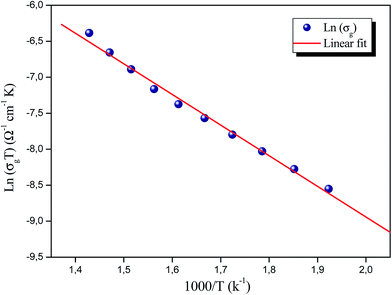
The thermal evolution of the conductivity of grains, ln(σgT) versus 1000/T, is shown in Fig. 7, indicating an Arrhenius-type behaviour. The activation energy was 0.87 eV. This value is similar to the activation energy deduced from the relaxation time plot, suggesting that the relaxation process and the conductivity can be ascribed to the same effect and that the charge carriers have to overcome the same energy barrier in both conduction and relaxation processes.21 This close resemblance indicates that the mobility of the charge carriers is probably due to a hopping mechanism dominated by the motion of the Rb ions.
The only conduction pathway is along tunnels parallel to the c-direction and the modest ionic conductivity of this material is determined by the dimensions of the tunnel sections. The bottleneck widths of the tunnels vary from 5.055 to 6.988 Å (Fig. 8) and thus they are smaller than the geometrical size of Rb, corresponding to (2 × rRb+) = 2 × 1.52 = 3.04 Å. We concluded that the transport properties in this material are a result of the movement of Rb+ ions along the c-direction.
3.3. Conductivity study
AC measurements are important in any study of an electrical compound as they give relevant information about properties such as conductivity. The AC conduction is also helpful in identifying the nature of the conduction mechanism. Fig. 9 shows the frequency variation of AC conductivity at different temperatures for RbAlP2O7. The conductivity pattern can be divided into two parts. The conductivity is almost independent of frequency in the low frequency region and shows a plateau region that characterizes the direct conductivity resulting from the displacement of charge carriers.22 At higher frequencies the AC conductivity increases in parallel with the increase in frequency and obeys the power law Aωs. The point at which the change in slope occurs is known as the hopping frequency19 and this shifts towards higher frequencies with increasing temperature. This indicates the presence of a hopping type mechanism for conduction in this material.21The observed conductivity curves can be described by Jonscher's law:23
| σac = σdc + Aωs | (4) |
3.4. Investigation of the theory of the conduction mechanism
To determine the most probable conduction mechanism for the AC conductivity of the sample, a model is proposed that takes into account the various theoretical models correlating the conduction mechanism of AC conductivity with the s(T) behaviour.26According to previously published work, the following theoretical models have been proposed to correlate the conduction mechanism of AC conductivity with the s(T) behaviour.
• The non-overlapping small polaron tunnelling conduction mechanism, in which the exponent s increases with increasing temperature.11,25
• The correlated barrier hopping (CBH) model, in which s decreases with increasing temperature.20,26
• The overlapping large polaron tunnelling conduction mechanism, in which the exponent s is both temperature and frequency dependent and s decreases with increasing temperature to a minimum value and then increases as the temperature increases further.27
• The quantum mechanical tunnelling conduction mechanism,28 in which the exponent s is almost equal to 0.8 and increases slightly with increasing temperature or is independent of temperature.
In this instance, s decreases with increasing temperature. The temperature dependence of s is plotted in Fig. 10. This suggests that the CBH model is the most appropriate model to characterize the conduction mechanism in RbAlP2O7. The CBH model has been used for many diphosphate materials.20,29 In the CBH model, the conduction occurs via a single polaron (or bipolaron) hopping process over the Coulomb barrier separating two defect centres. Using the CBH model, the binding energy was computed from the following relation:26
 | (5) |
 | (6) |
Fig. 10 shows the variation of (1 − s) as a function of temperature; the fit of this curve was used to calculate the value of Wm (the binding energy of the carrier in its localized sites), which was equal to 0.52 eV.
These above results can be easily explained using a modified CBH model. According to this model:30
 | (7) |
| NNP = NT |
for single polaron hopping, where Ueff is the effective correlation energy (correlation between electrons and phonons).
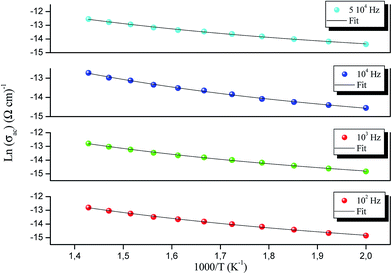
The AC conductivity of this sample can be satisfactorily explained by considering only one conduction mechanism (single polaron). Fig. 11 shows the temperature dependence of the AC conductivity in RbAlP2O7. It is clear that the AC conductivity varied exponentially with temperature because the ln(σac) vs. 1000/T plots are straight lines. Fig. 11 clearly shows that the theoretical calculations fit well with the experimental data. The values of the CBH model parameters have been adjusted to fit the calculated graphs of ln(σac) versus 1000/T to the experimental curves.
The hopping distance Rω is given by:32
 | (8) |
Fig. 12 shows that Rω increases with increasing temperature. For a fixed temperature, Rω decreases with the increase in angular frequency. This behaviour is in harmony with the increase in the conductivity as the frequency increases. The increase in temperature contributes thermal energy to the polaron, which then moves and facilitates the jump because of the inter-chain interaction that occurs.
The values of Rω are of the order of the interatomic spacing. The distance Rb–Rb in the direction (001) was 4.3 Å and therefore we can deduce that the conduction process occurs by the movement of Li+ along c-axis tunnels.
The results of this experimental study are compared with previous work in Table 2. Good ionic conduction was obtained compared with ABIIIP2O7 studies.
| Compound [reference] | σ600 K (Ω cm)−1 | Conduction mechanism |
|---|---|---|
| a CBH, correlated barrier hopping; NSPT, non-overlapping small polaron tunnelling. | ||
| NaAlP2O7 (ref. 12) | 7.16 × 10⁻⁶ | Simple hopping |
| KAlP2O7 (ref. 11) | 8.67 × 10⁻⁷ | NSPT |
| AgAlP2O7 (ref. 20) | 8.73 × 10⁻⁵ | CBH |
| LiAlP2O7 (ref. 7) | 8.76 × 10⁻⁶ | NSPT and CBH |
| RbAlP2O7 [this work] | 5.24 × 10⁻⁶ | CBH |
3.5. Modulus study
Formalism of the electric modulus is used to study the electrical relaxation process and is suitable for extracting electrode polarization. The complex electric modulus M is defined by the reciprocal of the complex permittivity ε (M = 1/ε), which can be described as:13| M = M′ + jM′′ |
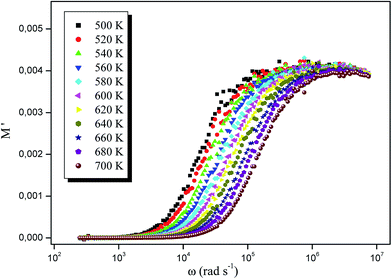
Fig. 13 and 14 shows the real and imaginary parts of the modulus, respectively, at different temperatures RbAlP2O7. Fig. 13 shows that the real modulus M′ is dispersed as the frequency increases and tends to saturate at M∞ at higher frequencies. The small value of M′ in the low frequency region facilitates the migration of ion conduction.33
 | ||
| Fig. 13 Variation in the real part of the modulus as a function of angular frequency at different temperatures. | ||
 | ||
| Fig. 14 Variation in the imaginary part of the modulus as a function of angular frequency at various temperatures. | ||
Fig. 14 shows that M′′ has a single relaxation peak centred at the dispersion region of M′ and is associated with the grain effect. The region to the left of the peak is the place at which the Rb+ ions are mobile over long distances. The region to the right is the place at which the ions are spatially confined to their potential wells.34
The movement of the charge carriers becomes faster as the temperature is increased, leading to a decreased relaxation time and a consequent shift in the peak value of M′′ towards higher frequencies. This behaviour suggests that the relaxation is thermally activated and charge carrier hopping is taking place.33
An alternative method has been proposed by Bergman et al.35 and the imaginary part of the complex electric modulus in the frequency domain was simulated as:
 | (9) |
4. Conclusion
RbAlP2O7 was synthesized using a solid-state technique. Structural investigation using XRD confirmed that the powder had a monoclinic structure of space group P21/c. It was concluded from the impedance data that this compound can be modelled by the simple equivalent circuit with R parallel to CPE. The AC conductivity spectra obeyed Jonscher's universal power law, whereas the DC conductivity showed a typical Arrhenius conductivity. An investigation of the ionic conductivity resulting from the mobility of Rb ions within the structure was carried out. A CBH-type model successfully explained the behaviour of the exponent.References
- F. d'Yvoire, Bull. Soc. Chim. Fr., 1962, 1224 Search PubMed.
- D. Maspoch, D. Ruiz-Molina and J. Veciana, Chem. Soc. Rev., 2007, 36, 770 RSC.
- M.-H. Whangbo, D. Daí and H.-J. Koo, Dalton Trans., 2004, 3019 RSC.
- J. M. M. Millet and J. C. Vedrine, Appl. Catal., 1991, 76, 209 CrossRef CAS.
- P. Bonnet, J. M. M. Vedrine, C. Leclercq and J. C. Vedrine, J. Catal., 1996, 158, 128 CrossRef CAS.
- A. Daidouh, M. L. Veiga, C. Pico and M. Martinez-Ripoll, Acta Crystallogr., Sect. C: Cryst. Struct. Commun., 1997, 53, 167 Search PubMed.
- Y. Ben Taher, A. Oueslati, K. Khirouni and M. Gargouri, Mater. Res. Bull., 2016, 78, 148 CrossRef CAS.
- E. Ordoñez Regil, N. García González and S. M. Barocio, Am. J. Anal. Chem., 2012, 3, 512 CrossRef.
- H. Y. P. Hong, Mater. Res. Bull., 1976, 11, 173 CrossRef CAS.
- J. B. Goodenough, Fast ionic conductors, in UNESCO Course in Materials Science, Erice, Italy, April 1980 Search PubMed.
- Y. Ben Taher, A. Oueslati and M. Gargouri, Ionics, 2015, 21, 1321 CrossRef CAS.
- Y. Ben Taher, R. Hajji, A. Oueslati and M. Gargouri, J. Cluster Sci., 2015, 26, 1279 CrossRef CAS.
- Y. Ben Taher, A. Oueslati, K. Khirouni and M. Gargouri, J. Cluster Sci., 2015, 26, 1655 CrossRef CAS.
- B. Louati, F. Hlel and K. Guidara, J. Alloys Compd., 2009, 486, 299 CrossRef CAS.
- U. Intatha, S. Eitssayeam, J. Wang and T. Tunkasiri, Curr. Appl. Phys., 2010, 10, 21 CrossRef.
- S. Selvasekarapandian and M. Vijaykumar, Mater. Chem. Phys., 2003, 80, 29 CrossRef CAS.
- S. Selvasekarapandian and M. Vijaykumar, Mater. Chem. Phys., 2003, 80, 29 CrossRef CAS.
- M. Ram, Phys. B, 2010, 405, 602 CrossRef CAS.
- F. I. H. Rhouma, F. I. H. Rhouma, A. Dhahri, J. Dhahri, H. Belmabrouk and M. A. Valente, Solid State Commun., 2012, 152, 1874 CrossRef CAS.
- Y. Ben Taher, A. Oueslati, N. K. Maaloul, K. Khirouni and M. Gargouri, Appl. Phys. A: Mater. Sci. Process., 2015, 120, 1537 CrossRef CAS.
- M. Sassi, A. Bettaibi, A. Oueslati, K. Khirouni and M. Gargouri, J. Alloys Compd., 2015, 649, 642 CrossRef CAS.
- M. S. Jayswal, D. K. Kanchan, P. Sharma and N. Gondaliya, Mater. Sci. Eng., B, 2013, 178, 775 CrossRef CAS.
- R. Bargougui, Y. Ben Taher, A. Oueslati, F. Hlel and S. Ammar, J. Mater. Sci.: Mater. Electron., 2014, 25, 5241 CrossRef CAS.
- A. Zaafouri, M. Megdiche and M. Gargouri, J. Alloys Compd., 2014, 584, 152 CrossRef CAS.
- S. Nasri, M. Megdiche and M. Gargouri, Ceram. Int., 2016, 42, 943 CrossRef CAS.
- Y. Ben Taher, A. Oueslati and M. Gargouri, J. Alloys Compd., 2016, 668, 206 CrossRef CAS.
- M. Megdiche, C. Perrin-pellegrino and M. Gargouri, J. Alloys Compd., 2014, 584, 209 CrossRef CAS.
- M. Ben Bechir, K. Karoui, M. Tabellout, K. Guidara and A. Ben Rhaiem, J. Appl. Phys., 2014, 115, 153708 CrossRef.
- S. Nasri, M. Megdiche and M. Gargouri, Phys. B, 2014, 451, 120 CrossRef CAS.
- A. Zolanvari, N. Goyal and S. K. Tripathi, Pramana, 2004, 63, 617 CrossRef CAS.
- G. Singh, N. Goyal, G. S. S. Saini and S. K. Tripathi, ac conductivity in a-Ge–Se–Bi glasses, J. Non-Cryst. Solids, 2007, 353, 1322 CrossRef CAS.
- A. Jellibi, I. Chaabane and K. Guidara, Phys. E, 2016, 80, 155 CrossRef CAS.
- A. Karmakar and A. Ghosh, Curr. Appl. Phys., 2012, 12, 539 CrossRef.
- A. Dhahri, F. I. H. Rhoumaa, J. Dhahri, E. Dhahri and M. A. Valente, Solid State Commun., 2011, 151, 738 CrossRef CAS.
- R. Bergman, J. Appl. Phys., 2000, 88, 1356 CrossRef CAS.
| This journal is © The Royal Society of Chemistry 2016 |


