Sensitive NO sensor based CdS microparticles assembled by nanoparticles
Lilan Zhanga,
Hao Wanga,
Wei Guo*b and
Jianmin Ma*a
aSchool of Physics and Electronics, Hunan University, Changsha, China. E-mail: nanoelechem@hnu.edu.cn
bCollege of Chemistry and Chemical Engineering, Anyang Normal University, Anyang, China. E-mail: guowei810807@163.com
First published on 25th April 2016
Abstract
In this work, cadmium sulfide (CdS) microparticles are prepared via an ionothermal route. The structure of the as-synthesized CdS microparticles is investigated by X-ray diffraction (XRD), scanning electron microscopy (SEM) and transmission electron microscopy (TEM). To investigate the sensing properties of the as-synthesized CdS microparticles, several gases are tested on the CdS sensor. The results show that the as-synthesized CdS microparticles have higher sensitivity towards NO than other gases (CH4, CO, H2, H2S and SO2), indicating good selectivity for detecting NO.
1 Introduction
With the rapid development of modern industry, toxic and hazardous gas pollution has become a serious issue. As a gas detecting tool, which converts the information of gas composition and concentration to electrical or optical signal information, gas sensors gradually have drawn great attention.1–3 A lot of materials have been used as gas sensitive materials.4,5 Many efforts have focused on the development of sensing semiconductor materials, such as WO3, SnO2, TiO2, Fe2O3 and ZnO.6–15 However, the sensors based on metal oxides always need high operational temperatures ranges from 300 °C to 500 °C for achieving good detection results, which limits the practical application of gas sensors. Thus, developing high-performance sensitive materials are highly needed.CdS is an important II–VI group compound semiconductor with a wide range of applications, due to its wider band gap (2.4 eV), excellent transport properties, good thermal stability and strong photoelectric effect to visible light.16–18 In recent years, it has also been used to detect gases.19–25 To date, a series of CdS nanostructures, such as nanoparticles, nanowires, nanorods, nanobelts and microspheres, have been prepared by many methods.26–32
Ionic liquids have been widely used in different fields because of their thermal stability and tunable properties.33–35 Compared with traditional hydrothermal methods, ionic liquids-related methods can affect the morphology of nanocrystals in the chemical reactions.36–38 In this work, we have successfully synthesized CdS microparticles assembled by nanoparticles by an ionothermal method. Moreover, we found that the as-synthesized CdS sensors showed excellent selectivity to toxic NO gas, and the excellent stability.
2 Experimental
2.1 Ionothermal synthesis of CdS microparticles
All the chemicals were of analytical grade and used without any further purification. In a typical synthesis of CdS microparticles, 5 mmol sulfur and 5 mmol cadmium acetate, were dispersed to 4 g ionic liquid (1-butyl-2,3-dimethyl imidazolium chloride), and 1 mL hydrazine hydrate (80%) was added under mild magnetic stirring at room temperature for 30 minutes. The obtained homogeneous solution was transferred into a 20 mL stainless-steel autoclave and maintained at 180 °C for 24 h. After being cooled to room temperature naturally, and the resultant was collected and washed 6 times alternately with ethanol and distilled water. Finally, the products were dried at 80 °C in oven for 12 h.2.2 Characterization
The structure of CdS microparticles were investigated using X-ray diffraction (XRD) with CuKa radiation (λ = 1.5418 Å). A scanning rate of 0.05° s−1 was applied to record the pattern and XRD data were collected over the range 20–70 at room temperature. The size and morphology of the materials were characterized by scanning electron microscopy (SEM) and transmission electron microscopy (TEM) with an accelerating voltage of 15 kV and 200 kV respectively.2.3 Sensor fabrication
The conventional cylindrical ceramic tube sensor was use as detection device. A certain amount of CdS gas sensitive material was dispersed in terpineol and formed yellow slurry by continuous grinding for 4 hours. Then, the slurry was coated onto an ceramic tube with a diameter of 1 mm and length of 4 mm, positioned with two round Au electrodes and four Pt wires on each end of the tube. A Ni–Cr alloy filament was inserted into the ceramic tube and used as a heater by tuning the heating voltage. Finally, we heat the sensors for different temperature by adjusting the heating voltage.3 Results and discussion
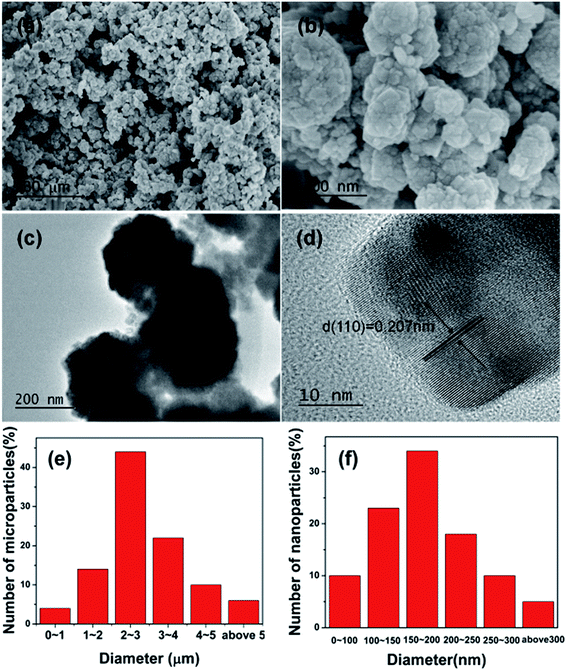
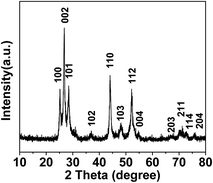
The phase purity, morphology, and structure of CdS microparticles were determined by XRD, SEM, TEM, and high-resolution (HR) TEM. Fig. 1 shows the XRD patterns of the as-synthesized CdS microparticles. It is clear that the XRD peaks can be well indexed to the phase of CdS (JCPDS Card #41-1049). The figure showed that the strong peak at 24.8°, 26.5°, 28.2°, 43.7° and 51.8° could be assigned to the five most important reflections (100), (002), (101), (110), and (112), respectively. No other diffraction peaks corresponding to impurities were observed, which indicate the high purity of the as-synthesized products.The morphology and structure of the as-synthesized CdS microparticles were characterized by SEM and TEM. Fig. 2a shows that the as-synthesized CdS sample is composed of microparticles. The microparticles are irregular in shape with a sizes ranging from 0 μm to 7 μm and with an average size of 2.9 μm. In order to understand the size of the microparticles clearly, we selected about 100 particles, and made a histogram. As is shown in Fig. 2e, more than 90% of the microparticles present a size comprised between 1 μm and 5 μm. The microparticles have a rough surface, as these microparticles are composed of quantitative CdS nanoparticles. Fig. 2b shows a higher resolution SEM image where further indicates that the as-synthesized CdS microparticles is assembled by small CdS nanoparticles. Moreover, the size of CdS nanoparticles is approximately 100 to 250 nm (Fig. 2f) with an average particle size of 190 nm. The TEM image in Fig. 2c further shows CdS microparticles are assembled by nanoparticles. According to the HRTEM image given in Fig. 2d, lattice fringe is about 0.207 nm, which corresponds to the (110) plane of the crystal structure. The result matches well with XRD pattern and indicates that the nanoparticles from CdS microparticles have good crystallinity. The ionothermal methods afford the high crystallization of nanocrystals owing to unique solvent media, as reported by many literature.39–41
 | ||
| Fig. 2 (a and b) SEM images and (c and d) TEM images of the as-synthesized CdS microparticles. (e and f) Size distribution of the CdS microparticles and nanoparticles. | ||
The reaction mechanism of semiconductor gas sensor is based on that the gas sensitive materials react with reducing gas or oxidation gas and result in the resistance change of the material. The electron transfer would occur between semiconductor materials and gas molecules causing the formation of oxygen ions O2−, O− and O2− when the O2 molecules were adsorbed on semiconductor materials surface. The surface reactions could be written as follow:
| O2(gas) + e− → O2(ads)− | (1) |
| O2(gas) + 2e− → 2O(ads)− | (2) |
| O(ads)− + e− → O(ads)2− | (3) |
When CdS is exposed in air, the sensor will lose electrons due to the adsorption of oxygen. It will lead to the reducing of O2 valence, and the increasing of sensor resistance, until both of them reach a balance. NO is a strongly oxidizing gas. When it is exposed in NO, gas sensitive material will interact with the NO and lost electrons along with the rising of resistance again.
| NO(gas) + e− → NO(ads)− | (4) |
Eventually, we turn this change into electrical signals, such as sensitivity, to achieve the purpose of testing. The gas sensitivity is defined as S = Rgas/Rair, in which Rgas is the resistances of the sensor in the gas being test, and Rair is the resistances of the sensor in the air.42
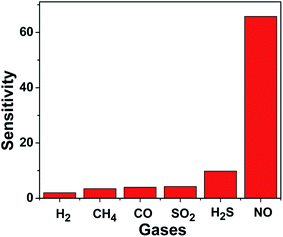
NO detection is of paramount importance in pollutants emitted by industrial and recycling processes. Therefore, we evaluated the NO gas sensing ability of the CdS microparticles and compared its performance with other gases. Fig. 3 shows the response of as-synthesized CdS sensors towards different gases with 30 ppm at the working temperature of 180 °C. One can find that the CdS sensor has an obvious higher sensitivity towards NO (65.80) than other gases, such as H2 (2.02), CH4 (3.49), CO (3.99), SO2 (4.26) and H2S (9.87). The adsorption of other gases are weakly along with the low sensitivity, but the adsorption to NO is unusually strong. On the other hand, the excellent sensing properties of CdS nanoparticles are likely to be the result of the small nanoparticles that can provide a relatively high surface area. It means that more NO molecules can be absorbed in the surface of CdS, capture a large number of electrons from the surface and lead to a unique test results.
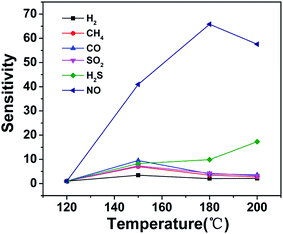
To study the gas-sensing behaviors of CdS sensors, a series of experiments were carried out by varying the operating temperature to get the optimum temperature. Fig. 4 shows the response–temperature profiles of CdS sensors towards 30 ppm of different gases. Obviously, when the temperature is below 120 °C, the sensor has no reaction for all gases, including NO gas. Gas adsorption on the surface of the CdS is not intense, cannot cause larger change of resistance due to the low working temperature. At the same time, the response of NO begins to increase and reaches maximum 214.4 at 180 °C, and then decreases with further improving operating temperature. Therefore, the optimum operating temperature of the CdS sensor to NO was about 180 °C. This may be due to the strong interaction between NO and CdS at 180 °C, leading to the large resistance changes. Compared with NO gas, the sensitivity of the other gases almost can be ignored. It shows that the as-obtained CdS sensor possesses excellent selectivity to NO at 180 °C.
As shown in Fig. 5, the response values increase with increasing NO concentration from 0.5 to 200 ppm. The corresponding responses of CdS sensor are 2.34 for 0.5 ppm, 9.03 for 1 ppm, 35.10 for 5 ppm, 38.71 for 10 ppm, 65.80 for 30 ppm, 82.03 for 100 ppm, 121.10 for 150 ppm and 214.40 for 200 ppm, respectively. With the increase of NO concentration, the sensitivity of the gas also increases. Moreover, a calibration curve was applied to show the linear relationship between the sensitivities and concentrations (Fig. 5 inset). The linear regression equation can be simply expressed as y = 0.796x + 30.04, where x is the concentration (ppm) and y is the gas sensitivity. The regression coefficient of the linear equation is 0.796. From the linear equations, we can know that it may not apply to the low concentration of NO, but for the high concentration detection it may be more accurate. When the concentrations are lower than 5 ppm, there is greater error between the experimental testing results and calculated values. However, with the increase of concentration, the calculated values are more consistent with the experimental results. Therefore, there is good linearity relation between the high concentration and sensitivity. The response surpasses 200 when the CdS sensor exposes 200 ppm NO. It confirms the high sensitivity of CdS microparticles assembled by nanoparticles towards NO.
In order to further understand the characteristics of the NO sensing, we investigated the dynamic responses of CdS sensor. Fig. 6a and b show the typical dynamic response curves of the sensor to NO as a function of concentration varying from 1 to 200 ppm at three different temperatures. The variations in resistance for the different concentration of NO were observed in Fig. 6a. The resistance value of the sensor increased drastically and soon from air to NO media. After that, the CdS sensor was taken out from the NO, the resistance of the sensor decreased, and restored to its original value. The behavior of sensor is similar when sensor is introduced in the higher concentration of NO. In Fig. 6, one can see that there is an obvious response value, and the resistance of the sensor is rising constantly with the increase of NO, when the sensor is exposed to the NO. Fig. 6b shows the corresponding sensitivity versus different concentrations. In the response characteristics, the response time is defined as the time required for a sensor to reach 90% of its maximum response.43 The response time to 1 ppm NO is about 13 s at 180 °C as shown in Fig. 6c, which are even better than other gases at the same concentration. Similarly in the recovery characteristics, the recovery time is defined as the time required for a sensor to return to 90% of the original baseline signal upon removal of the target gas. The observed recovery time is 37 s. The sensor has a short response and recovery time apparently. The results means that the sensor can realize a fast adsorption and desorption process of gas molecules, which effectively shorten the time of gas detection, has a vital significance in the actual gas detection.
As an important indicator of the sensor, the stability of sensors plays an important role. Fig. 7 demonstrates the stability characteristics of CdS sensor. The picture shows the change of corresponding sensitivity value of the sensor with the change of time. The sensor maintains its initial response value without a clear decrease or increase on ten continuous sense detecting to 1 ppm NO at 180 °C within 1200 s. The sensor is detected in the air and a certain concentration of NO, and the change of the sensitivity value is less than 2, which illustrates the excellent stability and recovery properties of CdS sensor.
4 Conclusions
In summary, we have successfully synthesized CdS microparticles assembled by small nanoparticles via an ionothermal route. The gas sensing properties of CdS microparticles reveal the excellent selectivity and sensitivity for NO at the low temperature, and show good stability and shorter response (13 s) time at the same time. The CdS sensors in our work demonstrate the potential application for the NO detection in future.Acknowledgements
This work was financially supported by the National Natural Science Foundation of China (Grant No. 51302079).References
- J. E. Johnson, J. A. Shaw, R. Lawrence, P. W. Nugent, L. M. Dobeck and L. H. Spangler, J. Appl. Remote. Sens., 2012, 6, 063612 CrossRef.
- J. Gu and C.-L. Yang, J. Pet. Sci. Eng., 2010, 73, 233–237 CrossRef CAS.
- A. Safitri, X. Gao and M. S. Mannan, J. Loss Prev. Process Ind., 2011, 24, 138–145 CrossRef CAS.
- J. M. Pedrosa, C. M. Dooling, T. H. Richardson, R. K. Hyde, C. A. Hunter, M. T. Martín and L. Camacho, Langmuir, 2002, 18, 7594–7601 CrossRef CAS.
- J. M. Pedrosa, C. M. Dooling, T. H. Richardson, R. K. Hyde, C. A. Hunter, M. T. Martín and L. Camacho, J. Mater. Chem., 2002, 12, 2659–2664 RSC.
- M.-W. Ahn, K.-S. Park, J.-H. Heo, J.-G. Park, D.-W. Kim, K. J. Choi, J.-H. Lee and S.-H. Hong, Appl. Phys. Lett., 2008, 93, 263103 CrossRef.
- Y. Liu, Y. Jiao, Z. Zhang, F. Qu, A. Umar and X. Wu, ACS Appl. Mater. Interfaces, 2014, 6, 2174–2184 CAS.
- L. Zhu, D. Zhang, Y. Wang, C. Feng, J. Zhou, C. Liu and S. Ruan, RSC Adv., 2015, 5, 28105–28110 RSC.
- Y. Chen, L. Zhu, C. Feng, J. Liu, C. Li, S. Wen and S. Ruan, J. Alloys Compd., 2013, 581, 653–658 CrossRef CAS.
- T. Kida, A. Nishiyama, Z. Hua, K. Suematsu, M. Yuasa and K. Shimanoe, Langmuir, 2014, 30, 2571–2579 CrossRef CAS PubMed.
- K. Suematsu, Y. Shin, N. Ma, T. Oyama, M. Sasaki, M. Yuasa, T. Kida and K. Shimanoe, Anal. Chem., 2015, 87, 8407–8415 CrossRef CAS PubMed.
- C. Wang, X. Cheng, X. Zhou, P. Sun, X. Hu, K. Shimanoe, G. Lu and N. Yamazoe, ACS Appl. Mater. Interfaces, 2014, 6, 12031–12037 CAS.
- N. Ma, K. Suematsu, M. Yuasa, T. Kida and K. Shimanoe, ACS Appl. Mater. Interfaces, 2015, 7, 5863–5869 CAS.
- K. Suematsu, Y. Shin, Z. Hua, K. Yoshida, M. Yuasa, T. Kida and K. Shimanoe, ACS Appl. Mater. Interfaces, 2014, 6, 5319–5326 CAS.
- M. Esmaili and A. Habibi-Yangjeh, Chin. J. Catal., 2011, 32, 933–938 CrossRef CAS.
- D. Shvydka, J. Drayton, A. Compaan and V. Karpov, Appl. Phys. Lett., 2005, 87, 123505 CrossRef.
- S.-L. Fu, T.-S. Wu and M.-P. Houng, Sol. Energy Mater., 1985, 12, 309–317 CrossRef CAS.
- I. Ferrer and P. Salvador, J. Appl. Phys., 1989, 66, 2568–2577 CrossRef CAS.
- W. Kim, M. Baek and K. Yong, Sens. Actuators, B, 2016, 223, 599–605 CrossRef CAS.
- J. Zhai, L. Wang, D. Wang, H. Li, Y. Zhang, D. Q. He and T. Xie, ACS Appl. Mater. Interfaces, 2011, 3, 2253–2258 CAS.
- X. Fu, J. Liu, Y. Wan, X. Zhang, F. Meng and J. Liu, J. Mater. Chem., 2012, 22, 17782–17791 RSC.
- B. Raut, M. Chougule, S. Nalage, D. Dalavi, S. Mali, P. Patil and V. Patil, Ceram. Int., 2012, 38, 5501–5506 CrossRef CAS.
- L. Zhu, Y. Wang, D. Zhang, C. Li, D. Sun, S. Wen, Y. Chen and S. Ruan, ACS Appl. Mater. Interfaces, 2015, 7, 20793–20800 CAS.
- B. Raut, P. Godse, S. Pawar, M. Chougule and V. Patil, J. Mater. Sci.: Mater. Electron., 2012, 23, 956–963 CrossRef CAS.
- L. Yadava, R. Verma and R. Dwivedi, Sens. Actuators, B, 2010, 144, 37–42 CrossRef CAS.
- C. C. Nascimento, G. R. Andrade, E. C. Neves, C. D. A. E. S. Barbosa, L. P. Costa, L. S. Barreto and I. F. Gimenez, J. Phys. Chem. C, 2012, 116, 21992–22000 CAS.
- A. Giberti, D. Casotti, G. Cruciani, B. Fabbri, A. Gaiardo, V. Guidi, C. Malagù, G. Zonta and S. Gherardi, Sens. Actuators, B, 2015, 207, 504–510 CrossRef CAS.
- N. Sonawane, K. Gurav, R. Ahire, J. Kim and B. Sankapal, Sens. Actuators, A, 2014, 216, 78–83 CrossRef CAS.
- T. Fu, Mater. Res. Bull., 2013, 48, 1784–1790 CrossRef CAS.
- S. Rengaraj, S. Venkataraj, S. H. Jee, Y. Kim, C.-w. Tai, E. Repo, A. Koistinen, A. Ferancova and M. Sillanpää, Langmuir, 2010, 27, 352–358 CrossRef PubMed.
- D. Li, J. Zhang, X. Wang, B. Huang and Q. Xiong, Nano Lett., 2014, 14, 4724–4728 CrossRef CAS PubMed.
- L. Liu, M.-Q. Sun, H. Zhang, Q. Yu, M. Li, Y. Qi, C. Zhang, G. Gao, Y.-J. Yuan and H. Zhai, Nano Lett., 2016, 16, 688–694 CrossRef CAS PubMed.
- J. Holbrey and K. Seddon, Clean Products and Processes, 1999, 1, 223–236 Search PubMed.
- P. Wasserscheid and W. Keim, Angew. Chem., 2000, 39, 3772–3789 CrossRef CAS.
- M. C. Buzzeo, R. G. Evans and R. G. Compton, ChemPhysChem, 2004, 5, 1106–1120 CrossRef CAS PubMed.
- A. Taubert, Angew. Chem., 2004, 116, 5494–5496 CrossRef.
- Y. Zhou and M. Antonietti, J. Am. Chem. Soc., 2003, 125, 14960–14961 CrossRef CAS PubMed.
- Y. J. Zhu, W. W. Wang, R. J. Qi and X. L. Hu, Angew. Chem., 2004, 116, 1434–1438 CrossRef.
- E. R. Cooper, C. D. Andrews, P. S. Wheatley, P. B. Webb, P. Wormald and R. E. Morris, Nature, 2004, 430, 1012–1016 CrossRef CAS PubMed.
- E. R. Parnham, P. S. Wheatley and R. E. Morris, Chem. Commun., 2006, 380–382 RSC.
- Y. Zhou and M. Antonietti, Chem. Mater., 2004, 16, 544–550 CrossRef CAS.
- X. Lai, J. Li, B. A. Korgel, Z. Dong, Z. Li, F. Su, J. Du and D. Wang, Angew. Chem., 2011, 123, 2790–2793 CrossRef.
- Y. Zhang, J. Li, G. An and X. He, Sens. Actuators, B, 2010, 144, 43–48 CrossRef CAS.
| This journal is © The Royal Society of Chemistry 2016 |


