Dragon's blood-aided synthesis of Ag/Ag2O core/shell nanostructures and Ag/Ag2O decked multi-layered graphene for efficient As(III) uptake from water and antibacterial activity
Mokhtar Ali Armaniac,
Ahmed Abu-Talebc,
Nagarjuna Remalli†
a,
Maaged Abdullahc,
Vadali V. S. S. Srikanth*a and
Nitin K. Labhasetwar*b
aSchool of Engineering Sciences and Technology (SEST), University of Hyderabad, Hyderabad 500046, India. E-mail: vvsssse@uohyd.ernet.in; Tel: +91-40-23134453
bCSIR-National Environmental Engineering Research Institute (CSIR-NEERI), Nehru Marg, Nagpur 440020, India. E-mail: nk_labhsetwar@neeri.res.in; Tel: +91-712-2249753
cFaculty of Engineering and Information Technology, Taiz University, Taiz 6803, Yemen
First published on 20th April 2016
Abstract
There has been a great interest to engineer surface characteristics of nanomaterials that are useful for various environmental applications. In this context, synthesis of nanomaterials using green methods is of great significance. Herein, new, easy, rapid and environmentally benign synthesis protocols to obtain Ag/Ag2O core/shell and Ag/Ag2O decorated multi-layered graphene (MLG) nanostructures are reported. The end products are obtained with the aid of “Dragon's blood”, a resin extracted from the bark of the mysterious tree, Dracaena cinnabari. Dragon's blood has a variety of antioxidant flavonoids and tannins, amongst many other constituents, which act as reducing and stabilizing agents. Ag/Ag2O core/shell and Ag/Ag2O decorated MLG nanostructures exhibited excellent adsorption characteristics in removing arsenite (As(III)) ions from water. The nanostructures also showed strong activity against E. coli and S. aureus bacteria.
Introduction
Core/shell nanostructures are a class of materials, which exhibit unique surface properties, while avoiding aggregation and corrosion and being stable and compatible in different environments.1 These nanostructures are useful in catalysis, solid state reactions, biomedical and environmental applications.1e,2 Two of the prominent environmental applications are: (i) removal of hazardous materials from water and (ii) killing of pathogens in water. In this context, research on Ag-based material systems has gained great importance. For example, Ag coated on activated alumina3 and Ag2O-grafted titanate nanolamina4 were used to remove hazardous materials from water through adsorption, whilst Ag exhibits a very strong antibacterial activity.5 Lately, graphene-based composites have also emerged as excellent materials for the abovementioned environmental applications.6 Even though the potential use of Ag-based materials and graphene composites in environmental applications has been demonstrated, there are lacunae with regards to their synthesis. For instance, even though the synthesis methods7 of Ag/Ag2O core/shell nanoparticles are well-established, they often involve time- and energy-consuming steps.One good idea to easily synthesize nanostructures is to use plant extracts in the synthesis procedures.8 However, the synthesis of core/shell nanostructures with the aid of plant extracts is probably difficult owing to the complexity of the active functional groups in the extracts. Herein, environmentally benign synthesis protocols using Dragon's blood, a resin extracted from the bark of the tree Dracaena cinnabari, for obtaining Ag/Ag2O core/shell and Ag/Ag2O decorated multi-layered graphene (MLG) nanostructures are reported. Moreover, reported herein are the nanostructures' excellent adsorption characteristics in removing arsenite (As(III)) ions from water and their strong antibacterial activity against E. coli and S. aureus bacteria. The rationale for using Dragon's blood in this study is as follows: Dragon's blood has a variety of antioxidant flavonoids9 and tannins and dracophane.10 It has been traditionally used in the preparation of medicines to treat human ailments.11 It also exhibited antibacterial activity against Gram-positive and -negative bacteria,12 while it was found to be safe for humans.13 To the best of our knowledge, despite its known chemical composition and other properties, its use in the synthesis of materials has not been explored.
Results and discussion
Morphological, structural and phase characteristics
Ag/Ag2O core/shell nanostructures (named S1) and two Ag/Ag2O decorated MLG nanostructures (Ag/Ag2O/0.1MLG and Ag/Ag2O/0.3MLG with different amounts of MLG, named S2 and S3, respectively) are synthesized, characterized and tested in the study (see Experimental section).Fig. 1a and b show the transmission electron micrograph and electron diffraction pattern, respectively, of Ag/Ag2O core/shell nanostructure (S1). The micrograph shows that the particles are quasi-spherical (∼20 nm in diameter). The ring type electron diffraction pattern indicates that the sample is polycrystalline in nature. The diffraction signals (Fig. 1b) are indexed to face-centred cubic (FCC) Ag and Ag2O phases present in the sample. Fig. 1c, a high resolution transmission electron micrograph, depicts the lattice image of the core, indicating that it is crystalline, while the particle is covered with a ∼4 nm shell, most plausibly an oxide layer. A crystal twin (the long linear dark feature in Fig. 1c) that is typical14 of Ag nanoparticles is also observed.
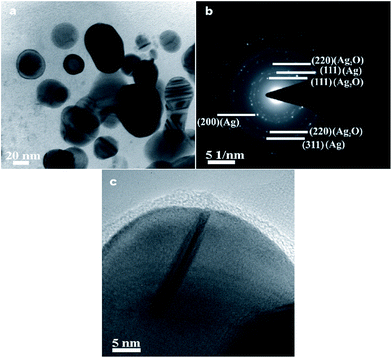 | ||
| Fig. 1 (a) Transmission electron micrograph, (b) electron diffraction pattern and (c) high resolution transmission electron micrograph of Ag/Ag2O core/shell nanostructures (S1). | ||
Transmission electron micrographs and the corresponding electron diffraction patterns of S2 and S3 are shown in Fig. 2. The micrographs (Fig. 2a and c) show well-distributed nanoparticles (∼3–5 nm in diameter) on the electron-transparent MLG sheets in both S2 and S3. In Fig. 2b, high intensity diffraction rings are indexed to {111}, {200}, {220}, {311} and {222} crystal planes of FCC Ag, whilst the rest of the discontinued rings are indexed to {111}, {220}, {311} crystal planes of FCC Ag2O. In Fig. 2d, low intensity discontinuous diffraction rings are indexed to {111}, {220} and {311} crystal planes of FCC Ag, whereas high intensity diffraction spots are indexed to {10−10}, {01−10} and {11−20} crystal planes of hexagonal MLG. The repetition of diffraction spots, with a constant angular difference, variation in intensity of inner and outer hexagonal diffraction spots and the presence of 12 spots in each ring instead of 6 spots (Fig. 2d), indicate the presence of layered graphene.15 Similar observations were not made in the case of S2 (Fig. 2b) due to either poor intensity of diffraction spots or improper diffraction conditions. Moreover, the quantity of MLG in S2 is lesser in comparison to that in S3 and therefore the quantity may not be sufficient enough to show strong diffraction signals. The same effect (the absence of MLG diffraction peaks) was observed in the X-ray diffraction (XRD) pattern of S2 (Fig. 3a). Nonetheless, other complementary studies showed the presence of MLG.
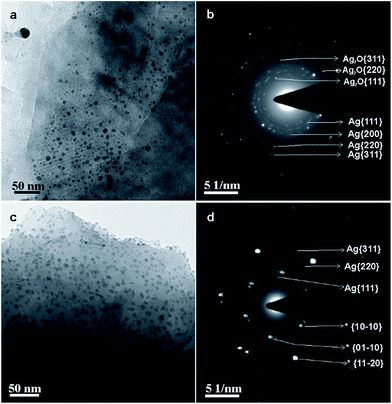 | ||
| Fig. 2 (a) Transmission electron micrograph and (b) electron diffraction pattern of S2; (c) transmission electron micrograph and (d) electron diffraction pattern of S3. | ||
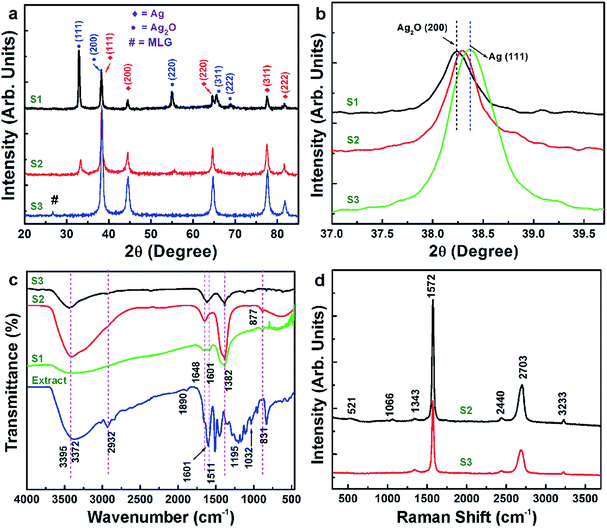 | ||
| Fig. 3 (a) X-ray diffractograms, (b) (111) Bragg reflection and (c) FTIR spectra of S1, S2 and S3 and Dragon's blood extract. (d) Raman spectra of S2 and S3. | ||
XRD patterns of all the samples are shown in Fig. 3a. In the case of S1, the diffraction peaks that appeared at 2θ equal to 38.22°, 44.45°, 64.6°, 77.45° and 81.6° are indexed to (111), (200), (220), (311) and (222) crystal planes of FCC Ag, respectively. The other peaks that appeared at 2θ equal to 32.8°, 38.3°, 54.9°, 56.5° and 68.7° are indexed to (111), (200), (220), (311) and (222) crystal planes of FCC Ag2O, respectively. In the case of S2, low intensity diffraction peaks from Ag2O were observed in addition to those from Ag. In the case of S3, the diffraction peaks corresponding to Ag and MLG only are observed. These results are highly consistent with the electron diffraction results. The electron diffraction and XRD results clearly indicate that use of a greater amount of MLG during the synthesis of Ag/Ag2O decorated MLG nanostructures (as in the case of S3) prevents Ag2O formation. Furthermore, the broader Ag XRD peaks in the case of S2 and S3 (in comparison to the same in S1) indicates that the nanoparticles are constituted by ultrafine grains. From the above presented observations, it is clear that the appropriate amount of MLG in the reaction (and therefore appropriate number of electrons participating in the reduction reaction) helps in efficient reduction to Ag, which maintains its post-synthesis structure stability. Fig. 3b shows the magnified XRD peaks in the 2θ range of 37–40° for all three samples under discussion. The figure clearly shows the evolution of (111) Ag in the case of S2 and S3 in comparison to (002) Ag2O in the case of S1.
Fig. 3c shows Fourier transform infrared (FTIR) spectra of S1, S2 and S3 in comparison with the extract's spectrum, which shows several absorption bands, indicating the complexity of the functional groups present in the resin. Bands at 2932 and 1890 cm−1 are attributed to C–H and C![[double bond, length as m-dash]](https://www.rsc.org/images/entities/char_e001.gif) O stretching vibrations, respectively. Other bands commonly attributed to the presence of C–H, CHO, C
O stretching vibrations, respectively. Other bands commonly attributed to the presence of C–H, CHO, C![[double bond, length as m-dash]](https://www.rsc.org/images/entities/char_e001.gif) O, COOH, N–H, and OH functional groups in the extract are indicated in the spectrum.9,10
O, COOH, N–H, and OH functional groups in the extract are indicated in the spectrum.9,10
The absorption bands (Fig. 3c) observed in the case of S1, S2 and S3 are quite similar. The broad band in the spectral region of 3000–3600 cm−1 is an indication of the presence of amino and hydroxyl groups in the samples.16 The band shift from 3372 cm−1 (in the case of extract) to higher wavenumber in the case of S1–S3 indicates that the hydroxyl and amino groups in the extract aided the formation of Ag/Ag2O particles. The weak band at ∼1648 cm−1 is assigned to the carbonyl stretching groups in the samples.16a,17 It is observed that the intensity of this band is high in the case of S2 and S3, indicating that the corresponding functional groups are adsorbed onto the MLG surfaces during the synthesis of the samples. A strong band observed at ∼1601 cm−1 in the case of the extract is absent in the case of S1–S3, indicating that the corresponding functional groups (carbonyl-related) have been consumed during the formation of Ag/Ag2O particles. The strong band at 1382 cm−1 corresponding to the stretching vibration of the C–N bond in aromatic amines is present in samples S1, S2 and S3. This band is absent in the case of the extract. This observation is also an indication of the participation of functional groups in the extract in not only the formation of Ag/Ag2O particles, but also in retaining certain structure stabilizing groups that are different from those participating the reduction reactions. The band at ∼877 cm−1 is assigned to Ag–O bonds18 in the case of S1 and S2. This band is not observed in the case of S3 complementing well with the electron diffraction and XRD results, which showed the absence of Ag2O in S3.
Fig. 3d shows Raman spectra of S2 and S3. Raman bands' characteristics observed herein are similar to our previous studies on MLG19 confirming the presence of MLG in S2 and S3. The characteristics are also similar to other classical studies on layered graphene.20 Nonetheless, a brief description on the Raman bands' characteristics of S2 and S3 is presented here. The typical Raman bands, namely, D-, G- and 2D-bands are observed at ∼1343, ∼1572 and ∼2703 cm−1, respectively, indicating the presence of MLG in the samples. The low intensity of the D-band is an indication of low defects in MLG. The appearance of the G-band at ∼1572 cm−1 is evidence in itself for the presence of layered graphene in samples. The broad and low intensity 2D-band is also an indication of the presence of MLG in the samples. Herein, it should be noted that this band will be normally sharp and intense in the case of monolayer graphene. The ratio of 2D-band and G-band peak intensities is <1 in both S2 and S3 cases, which is another indication for the presence of MLG.
The Raman band at ∼1066 cm−1 corresponds to the vibrational mode of surface carbonate species pertaining to Ag/Ag2O nanoparticles because of their interaction with MLG during the synthesis.21 This is also an indication of the participation of carbon in MLG in the chemical reactions during the synthesis of S2 and S3. The low intensity Raman bands which appear at 482, 553 and 921 cm−1 (not discernible owing to the stacking of the data) are related to Ag–O bonds in the samples.21 Based on the above observations and because of the graphene's unique surface and transport properties, the surfaces in MLG might be touted as substrates to hold small Ag particles.22 Furthermore, defects (for example vacant C atom positions) on the graphene surfaces in MLG could provide active sites for the stable nanoparticles to nucleate, grow and attain stability (i.e., Ag/MLG interface stability). In this context, it should be noted that the Raman D-band's intensity is slightly greater in the case of S3 in comparison to that of S2, indicating more defects in S3. This correlates well with the observation of the absence of Ag2O and the presence of only Ag in the case of S3. Moreover, graphene surfaces enable swift electron transfer and therefore can support rapid nucleation of reduction products. Graphene has a large specific surface area and a high affinity for oxygen23 and can therefore adsorb a large amount of oxygen leaving a relatively oxygen deficient environment during the synthesis thereby resulting in the formation of stable Ag particles instead of Ag2O particles in the case of S3, wherein the amount of MLG is greater compared to that of S2. On the other hand, amino, aromatic and hydroxyl groups (present in the extract) may adsorb onto the MLG surfaces and enable MLG to act as a precursor for the oxygen reduction reaction.24 In fact, graphene is known to have hydrophobic poly-aromatic basal planes,25 which allow MLG's strong interaction (π–π and/or hydrogen bonding)26 with aromatic and amino groups that seems to have aided the stabilization of Ag nanoparticles in S3. This argument correlates well with the FTIR results. Agglomeration of Ag nanoparticles was not observed most probably due to the greater binding energy between Ag and MLG surfaces than Ag–Ag binding energy;22 however, this aspect has to be studied further. With regards to the formation mechanism of Ag/Ag2O core/shell nanostructures (sample S1), it is similar to the previously reported studies.7 In brief, the functional groups present in the extract aid in appropriate surface functionalization of the growing core whilst simultaneously enabling the anchoring of metal atoms to the growing core until it attains a critical size (3–5 nm) and growth ceases. At this stage, the functional groups that have numerous dangling oxygen bonds in the reaction environment result in the formation of a uniform layer of Ag2O as a shell to the Ag core.
Removal of As(III) ions
In this study, we aimed to decrease the As(III) ion concentration in water to less than the World Health Organization (WHO) prescribed limit (i.e., <10 ppb) for drinking water. Adsorption data of S1 and S2 are shown in Fig. 4. Herein, pH of the solution was maintained around 7, which is the most suitable pH condition for ground and surface drinking water.Removal efficiency (R(%)) was calculated using eqn (1):
 | (1) |
 in eqn (2) is the adsorbent dose.
 | (2) |
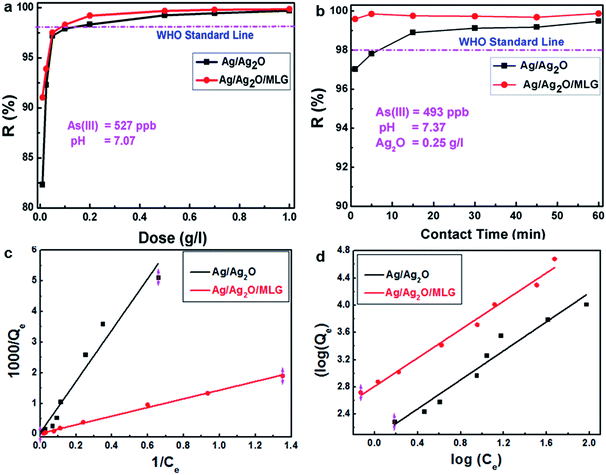
Fig. 4a shows the percentage removal of As(III) ions by different doses of S1 and S2. It is clear from Fig. 4a that even at low doses, S1 exhibits a high percentage removal of As(III) ions while the equilibrium state is reached at a dose of ∼0.4 g L−1, which is quite a low value. From Fig. 4a it is also clear that the percentage removal of As(III) ions by S2 is better than that by S1 while the equilibrium state in the case of S2 is reached at a very low dose of ∼0.1 g L−1. This clearly reveals that the presence of MLG in the composite enhances the adsorption of As(III). The time taken to remove As(III) ions from an aqueous solution with an initial concentration of 527 ppb As(III) ions to less than 10 ppb of As(III) ions (i.e., the equilibrium concentration, as shown in Fig. 4a) for an adsorbent dose greater than 0.2 g L−1 was ∼6 min in both S1 and S2 cases. Fig. 4b shows the percentage removal of As(III) ions at different contact times of S1 and S2 (both at a dose of 0.25 g L−1) with the adsorbate. In the case of S1, as shown in Fig. 4b, it takes 10 min to meet the WHO standard. On the other hand, in the case of S2, within a few seconds of contact between the adsorbent and adsorbate, the percentage removal reaches equilibrium.
Because of the large specific surface area and the presence of functional groups on the surfaces of such graphene composites, strong electrostatic and π–π interactions with the adsorbate are expected. These interactions in turn enhance the adsorption behaviour of the graphene composites.6a The better adsorption characteristics of S2 in comparison to those of S1 are attributed to ion exchange and electrostatic interactions activated by graphene surfaces in the sample.6a Functional groups, such as hydroxyl, carboxyl and epoxy, (as indicated by the FTIR studies) on the surfaces of graphene are useful in providing numerous adsorption sites.27 Similar observations were also made in our previous study on MgO-decorated MLG.6c
The Langmuir28 adsorption isotherm (Fig. 4c) that assumes monolayer coverage of the adsorbate onto the adsorbent's surface was applied to the adsorption data of S1 and S2. The Langmuir adsorption isotherm is governed by eqn (3)
 | (3) |
 | (4) |
| Langmuir adsorption isotherm | Freundlich adsorption isotherm | ||||
|---|---|---|---|---|---|
| Parameter | S1 | S2 | Parameter | S1 | S2 |
| R2 | 0.953 | 0.996 | R2 | 0.9485 | 0.987 |
| Qmax (mg g−1) | 26.27 | 35.21 | Kf (mg g−1) | 7.78 | 16.65 |
| RL | 0.2966 | 0.0803 | n | 1.065 | 1.041 |
The Freundlich29 adsorption isotherm was also considered to check if any non-linear adsorption (multilayer sorption) mechanism is occurring. The Freundlich adsorption isotherm is governed by eqn (5)
 | (5) |
The values of Kf and n are obtained from the intercept and the slope of the log(Qe) versus log(Ce) plot, respectively. log(Qe) versus log(Ce) plots in both S1 and S2 cases are straight lines (Fig. 4d), indicating the applicability of even the Freundlich isotherm to the adsorption data. However, the value of 1/n in both S1 and S2 cases is less than 1 (Table 1), which is not an indication of unfavourable adsorption but an indication that the adsorption is almost independent of Ce. For a strong adsorption 1/n should be greater than 1. Moreover, it should also be noted that the R2 values are not better than those exhibited by the fit data in the case of S1. Kf values are 7.78 and 16.65 mg g−1 for S1 and S2, respectively. Finally, the adsorption studies show that S1 and S2 follow the Langmuir adsorption isotherm in removal of As(III) from water through adsorption phenomenon.
Antibacterial activity
The antibacterial activities of S1, S2 and the control sample (Dragon's blood) on E. coli and S. aureus are shown in Fig. 5a and b, respectively. Fig. 5 clearly indicates that all the samples possess strong antibacterial activity. The inhibition zone radius was measured as ∼15 mm in the case of the control sample against both E. coli and S. aureus. The inhibition zone radius was measured as 12 and 14 mm in the case of S1 and S2, respectively, against E. coli. The inhibition zone radius was measured as 14 and 17 mm in the case of S1 and S2, respectively, against S. aureus. From the observations, it is clear that the activity of S2 is stronger than that of S1 against both S. aureus and E. coli, whilst S1 and S2 exhibit higher antibacterial activity towards S. aureus than E. coli. The enhanced antibacterial activity of S2 is attributed to the enhanced characteristics of S2 (as discussed in the previous sections) in comparison to S1.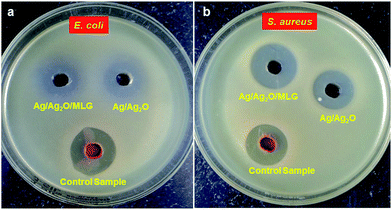 | ||
| Fig. 5 Antibacterial activity of S1 and S2 samples and the control sample of the plant extract using the Agar Diffusion Technique. | ||
Comparison with literature
From the above discussion it is very clear that Ag/Ag2O core/shell and Ag/Ag2O decorated MLG nanostructures not only exhibited high adsorption capacities for As(III) ions, but also showed strong antibacterial activities against E. coli and S. aureus bacteria. However, owing to the uniqueness of the materials in this study, their adsorption ability and antibacterial activities may not be directly comparable to those exhibited by other relevant materials. Nonetheless, the results in this study when compared with those in the literature are on a par, with those in the literature in some cases, and better in other cases.3–6 In this context, it is important to note that irrespective of the comparison, the results in this study are far better than those normally required for the respective applications.Experimental
Preparation of Dragon's blood extracted solution
An image of a typical Dracaena cinnabari tree is shown in Fig. 6a. The bark/trunk of the tree was wounded/pierced by a sharp object and left ‘bleeding’ until a sufficient amount of resin (gum-like material) came out. The resin converts into a solid mass under normal conditions. In the subsequent step, 100 mg of the solid resin was ground and washed repeatedly with methanol (98%) until a dark red powder was obtained, as shown in Fig. 6b. In the last step, 20 mg of the resin powder was dissolved in 100 mL of distilled water at 100 °C (or ethanol at 50 °C) for 10 min to obtain a homogenous red solution, as shown in Fig. 6c. The extracted solution from Dragon's blood was named Dragon's blood extracted solution (DBES). The last step can be alternatively carried out by dissolving 10 mg of the resin powder and 2 g NaOH pellets in 100 mL ethanol at room temperature (or at 50 °C) to form a homogenous red solution similar to the one shown in Fig. 6c. Addition of NaOH was mainly to increase the extraction rate of the active groups.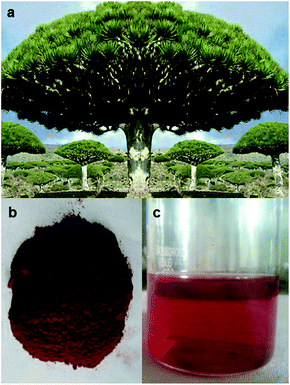 | ||
| Fig. 6 Images of (a) Dracaena cinnabari tree, (b) Dragon's blood powder and (c) Dragon's blood extracted solution. | ||
Synthesis of materials
Ag/Ag2O core/shell nanostructures (named S1) are synthesized in the following manner: 1.7 g of AgNO3 was dissolved in 100 mL distilled water and 20 mL of the DBES solution (Fig. 6c) was added to the AgNO3 solution with continuous stirring for 1 h to ensure complete reduction. The solution's colour changes gradually to black in the first 10 minutes, indicating the formation of silver oxide (Ag2O) nanoparticles in the solution, which was refluxed and allowed to gravitationally precipitate. The precipitate was collected by filtration and then washed by ethanol and distilled water and was finally dried at 120 °C for 2 h. The reduction efficiency was ∼60% and ∼1 g of powder was obtained. The pH of the solution was ∼9 due to the high alkalinity of the extracted solution.The two Ag/Ag2O decorated MLG nanostructures (named S2 and S3) are synthesized in the following manner. First, graphene oxide (GO) was prepared using a modified Hummers method.30 Subsequently, GO was thermally reduced to MLG at 400 °C for 1 h. In the next step, in the case of S2, 100 mg (or 300 mg in the case of S3) of MLG was dispersed in 50 mL ethanol and sonicated for 15 min. The so-obtained suspension was then added to the abovementioned AgNO3 solution. The rest of the synthesis procedure is the same as described above in the case of S1.
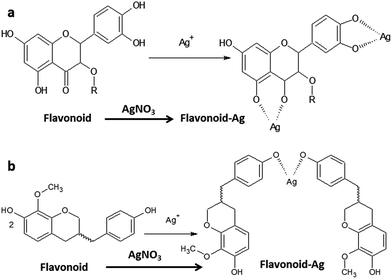
To understand the reduction mechanism, the nature of the functional groups of DBES and their interactions with metal ions need to be investigated. Scheme 1 shows two possible intermolecular binding behaviours of flavonoids of DBES with silver ions during the reaction. The binding behaviours in Scheme 1a and b show that the various organic compounds in DBES having various functional groups that may coordinate with silver ions. These interactions differ from metal to metal based on electronic and surface properties of metals.31
The mechanism of silver ions' interactions with the functional groups can be explained in two ways. In one way, the interaction occurs in the same molecule, wherein one or more of functional groups make coordination bonds with metal ions, as shown in Scheme 1a. In another way, silver ions form several complexes with flavonoids that do not have any typical chelating sites on their external structure, as shown in Scheme 1b. The reduction of silver ions is mainly due to the antioxidant activity of flavonoids and tannins in plant extract,11,12 which behave as ligands and can chelate with various metal ions.31 Flavonoids can easily chelate metal ions to create complex compounds due to their ability to donate electrons and hydrogen atoms.31 In addition, pH and solvent properties play an important role as they are major sources for hydroxyl groups in the reaction. The large number of –OH functional groups in the flavonoids12 is a key factor in the reduction process. This factor favours the formation of a hydrophilic surfaces arising from the dissolved oxygen molecules (from the air) that are suitable for the growth of nanoparticles. Finally, there is promotion of the formation of different biological complexes, which act as reducing and stabilizing agents during the overall reaction. Moreover, the amino and aromatic groups of DBES get attached to the surfaces of the growing nanoparticles and serve as active functional groups contributing to the growth of the oxide shell layer.1b
Adsorption experiments
Batch and contact time adsorption experiments were conducted to understand the adsorption characteristics of the adsorbents. For dose optimization study, 2 L of As(III) solution with an initial As(III) concentration of 527 ppb in distilled water was prepared. The pH of this solution was 7.07. Eight conical bottles with a capacity of 250 mL were filled with 100 mL of the each abovementioned solution and different S1 doses (in the range of 10–1000 mg L−1) were added to each of these. Kinetic study was carried out in a single conical bottle of 250 mL capacity, which was filled with 200 mL of (water–As(III)–S1) solution having the following characteristics (As(III) = 493 ppb, pH = 7.37 and S1 dose = 0.25 g L−1), and the measurements were taken at different contact times from 1 min to 120 min. The same procedure (dose and kinetic experiments) was also repeated for S2 to study the impact of the presence of MLG on the adsorption of As(III) ions. In the subsequent step, the obtained samples were filtered using 0.22 micron filters, and analysed using ICP-mass spectrometry (ICP-MS, Perkin Elmer, NexIon 300X). Control samples were also analysed in each adsorption experiment to estimate the initial and final As(III) concentration in water.Antibacterial experiments
Experiments were performed to study the activity of S1 and S2 samples against E. coli and S. aureus bacteria. 10 μg of the sample (S1 or S2) was separately dissolved in 1 L of dimethyl sulfoxide. 0.1 mL of 24 h bacterial broth cultures, with 106 CFU mL−1 of S. aureus and E. coli, were uniformly distributed on nutrient agar plates separately using a glass spreader. Wells on the incubated nutrient agar plates were made using 6 mm broth. In the subsequent step, 0.1 mL of the prepared sample solution was separately loaded in the wells on each plate. 0.1 mL DBES was used as the control sample. Plates were incubated at +3 °C for 1 h for better diffusion of the sample in the media and then incubated at 37 °C for 24 h. Finally, the plates were observed for the appearance of the inhibition zones around the disks loaded with the samples.Materials' characterization experiments
The powder X-ray diffraction patterns were recorded at a scan rate of 0.020 s−1 in the 2θ range of 20–85° using a Bruker D8 Advance X-ray diffractometer with Cu-Kα radiation (λ = 1.54 Å) operated at 40 kV and 30 mA. Raman spectroscopy (using the 532 nm laser line of a Nd-YAG laser with a spectral resolution of 3 cm−1) was used to investigate the presence of MLG and oxides in the samples. Fourier transform infrared (FTIR) spectroscopy (Nicolet 380) measurements were carried out to study the functional groups in the samples. A transmission electron microscope (TEM) (Model FEI Tecnai G2 S-Twin) operated at an accelerating voltage of 200 kV was used to study the morphology and crystallinity of the samples. TEM samples were prepared by dropping μL ethanol/sample solutions (a tiny portion of samples, S1, S2 and S3, in a powder form, were dispersed well in ethanol solvent using sonication) onto carbon-coated copper grids and dried at room temperature for sufficient time.Conclusions
A new green synthesis method aided by Dragon's blood was demonstrated to obtain Ag/Ag2O core/shell and Ag/Ag2O decorated MLG nanostructures. It has been experimentally observed that the more GO concentration in the synthesis of Ag/Ag2O decorated MLG the less is the formation of Ag2O. In other words, GO plays a crucial role in effectively reducing the Ag precursor to Ag(I) conversion. Morphological and structural characterization results confirmed the formation of Ag/Ag2O core/shell and Ag/Ag2O decorated MLG nanostructures. FTIR study confirmed the presence of various functional groups that aided in the formation of the samples. Ag/Ag2O and Ag/Ag2O/MLG samples exhibited excellent adsorption characteristics, which helped them in efficiently removing As(III) from water. Ag/Ag2O and Ag/Ag2O/MLG exhibited maximum adsorption capacities of 26.8 and 35.21 mg g−1. Ag/Ag2O and Ag/Ag2O/MLG samples also exhibited excellent activity against E. coli and S. aureus bacteria. This study clearly demonstrates the substantial enhancement of the adsorption and anti-bacterial properties of silver-based adsorbents by synthesizing them using a green synthesis route and by incorporating graphene in the silver-based materials.Acknowledgements
The authors sincerely thank the Centre of Nanotechnology, University of Hyderabad for allowing us to use the TEM facility. VVSSS thanks, SERB, DST, Government of India for providing moral support under the Fast Track Scheme (SERB/F/3487/2012-2013) for Young Scientists.References
- (a) J. Ghilane, F.-R. F. Fan and A. J. Bard, Nano Lett., 2007, 7, 1406 CrossRef CAS PubMed; (b) C. Kumar, Mixed Metal Nanomaterials, Wiley-VCH, 2009, pp. 280–320 Search PubMed; (c) J. M. J. Santillan, L. B. Scaffardi and D. C. Schinca, J. Phys. D: Appl. Phys., 2011, 44, 105104 CrossRef; (d) A. Oscar, D. Gallardo, R. Moiraghi, M. Macchione, J. Godoy, M. Pérez, E. Coronado and V. Macagno, RSC Adv., 2012, 2, 2923 RSC; (e) P. Melinon, B.-C. Sylvie, J. L. Duvail, F. Gauffre, N. H. Boime, G. Ledoux, J. Plain, P. Reiss, F. Silly and W.-F. Benedicte, Phys. Rep., 2014, 543, 163 CrossRef CAS.
- (a) N. Sounderya and Y. Zhang, Recent Pat. Biomed. Eng., 2008, 1, 34 CrossRef CAS; (b) C.-J. Zhong and M. M. Maye, Adv. Mater., 2001, 13, 1507 CrossRef CAS.
- E. Sumesh, M. S. Bootharaju, Anshup and T. Pradeep, J. Hazard. Mater., 2011, 189, 450 CrossRef CAS PubMed.
- A. Bo, S. Sarina, Z. Zheng, D. Yang, H. Liu and H. Zhu, J. Hazard. Mater., 2013, 246, 199 CrossRef PubMed.
- (a) C. Zhang and Z. Hu, Water Res., 2016, 88, 403 CrossRef CAS PubMed; (b) B. Le Ouay and F. Stellacci, Nano Today, 2015, 10, 339 CrossRef CAS.
- (a) M. Yusuf, F. M. Elfghi, S. A. Zaidi, E. C. Abdullah and M. A. Khan, RSC Adv., 2015, 5, 50392 RSC; (b) S. Liu, T. H. Zeng, M. Hofmann, E. Burcombe, J. Wei, R. Jiang, J. Kong and Y. Chen, ACS Nano, 2011, 5, 6971 CrossRef CAS PubMed; (c) N. K. Rotte, S. Yerramala, J. Boniface and V. V. S. S. Srikanth, Chem. Eng. J., 2014, 258, 412 CrossRef CAS.
- (a) P. Singh, K. L. Parent and D. A. Buttry, J. Am. Chem. Soc., 2012, 134, 5610 CrossRef CAS PubMed; (b) J. E. Cloud, L. W. Taylor and Y. Yang, RSC Adv., 2014, 4, 24551 RSC; (c) D. C. Schinca, L. B. Scaffardi, F. A. Videla, G. A. Torchia, P. Morino and L. Roso, J. Phys. D: Appl. Phys., 2009, 42, 215102 CrossRef; (d) M. Thenmozhi, K. Kannabiran, R. Kumar and V. G. Kha, J. Med. Vet. Mycol., 2013, 23, 97 CrossRef CAS PubMed; (e) Z. H. Dhoondia and H. Chakraborty, Nanomater. Nanotechnol., 2012, 2, 15 Search PubMed.
- (a) M. M. Khin, A. S. Nair, V. J. Babu, R. Murugan and S. Ramakrishna, Energy Environ. Sci., 2012, 5, 8075 RSC; (b) F. Cheng, J. W. Betts, S. M. Kelly, J. Schaller and T. Heinze, Green Chem., 2013, 15, 989 RSC; (c) M. Cinelli, S. R. Coles, M. N. Nadagouda, J. Błaszczyński, R. Słowiński, R. S. Varma and K. Kirwan, Green Chem., 2015, 17, 2825 RSC; (d) S. Iravani, Green Chem., 2011, 13, 2638 RSC; (e) R. K. Das and S. K. Brar, Nanoscale, 2013, 5, 10155 RSC.
- M. Masaoud, H. Ripperger, A. Porzel and G. Adam, Phytochemistry, 1995, 38, 745 CrossRef CAS.
- D. Vesela, R. Marek, K. Ubik, K. Lunerova, V. Sklenar and V. Suchy, Phytochemistry, 2002, 61, 967 CrossRef CAS PubMed.
- A. Alwashli, M. Al-Sobarry, Y. Cherrah and K. Alaoui, Int. J. Pharmacol. Biol. Sci., 2012, 3, 97 Search PubMed.
- A. Y. Abu-Taleb, F. A. M. Alzowahi, T. A. Kadam and R. U. Shaikh, J. Coastal Life Med., 2013, 1, 111 Search PubMed.
- M. Al-Fatimi, U. Friedrich and K. Jenett-Siems, Fitoterapia, 2005, 76, 355 CrossRef CAS PubMed.
- R. Mendoza-Reséndez, N. O. Núñez, E. D. Barriga-Castro and C. Luna, RSC Adv., 2013, 3, 20765 RSC.
- (a) J. C. Meyer, A. K. Geim, M. I. Katsnelson, K. S. Novoselov, T. J. Booth and S. Roth, Nature, 2007, 446, 60 CrossRef CAS PubMed; (b) J. C. Meyer, A. K. Geim, M. I. Katsnelson, K. S. Novoselov, D. Obergfell, S. Roth, C. Girit and A. Zettl, Solid State Commun., 2007, 143, 101 CrossRef CAS.
- (a) P. Velmurugan, M. Cho, S. M. Lee, J. H. Park, S. Bae and B. T. Oh, Carbohydr. Polym., 2014, 106, 319 CrossRef CAS PubMed; (b) E. Prabakaran and K. Pandian, Food Chem., 2015, 166, 198 CrossRef CAS PubMed.
- R. Krishnan and G. B. Maru, Food Chem., 2006, 94, 331 CrossRef CAS.
- H. M. El-Rafie, M. H. El-Rafie and M. K. Zahran, Carbohydr. Polym., 2013, 96, 403 CrossRef CAS PubMed.
- (a) S. Petnikota, S. K Marka, V. V. S. S. Srikanth, M. V. Reddy and B. V. R. Chowdari, Electrochim. Acta, 2015, 178, 699 CrossRef CAS; (b) S. K. Marka, B. Sindam, K. C. James Raju and V. V. S. S. Srikanth, RSC Adv., 2015, 5, 36498 RSC; (c) S. K. Marka, Md. A. Mohiddon, D. P. Muvva and V. V. S. S. Srikanth, Superlattices Microstruct., 2015, 83, 530 CrossRef CAS; (d) S. Petnikota, N. K. Rotte, M. V. Reddy, V. V. S. S. Srikanth and B. V. R. Chowdari, ACS Appl. Mater. Interfaces, 2015, 7, 2301 CrossRef CAS PubMed; (e) S. Petnikota, N. K. Rotte, V. V. S. S. Srikanth, B. S. R. Kota, M. V. Reddy, K. P. Loh and B. V. R. Chowdari, J. Solid State Electrochem., 2014, 18, 941 CrossRef CAS.
- (a) A. C. Ferrari, J. C. Meyer, V. Scardaci, C. Casiraghi, M. Lazzeri, F. Mauri, S. Piscanec, D. Jiang, K. S. Novoselov, S. Roth and A. K. Geim, Phys. Rev. Lett., 2006, 97, 187401 CrossRef CAS PubMed; (b) H. Wang, Y. Wang, X. Cao, M. Fenga and G. Lan, J. Raman Spectrosc., 2009, 40, 1791 CrossRef CAS; (c) Y. Hao, Y. Wang, L. Wang, Z. Ni, Z. Wang, R. Wang, C. K. Koo, Z. Shen and J. T. L. Thong, Small, 2010, 6, 195 CrossRef CAS PubMed; (d) D. Yang, H. Liu, L. Liu, S. Sarina, Z. Zheng and H. Zhu, Nanoscale, 2013, 5, 11011 RSC.
- (a) C.-B. Wang, G. Deo and I. E. Wachs, J. Phys. Chem. B, 1999, 103, 5645 CrossRef CAS; (b) I. Martina, R. Wiesinger, D. J. Simburger and M. Schreiner, e-Preserv. Sci., 2012, 9, 1 CAS.
- J. A. Farmer and C. T. Campbell, Science, 2010, 329, 933 CrossRef CAS PubMed.
- A. Fathalian, J. Jalilian and S. Shahidi, Phys. B Condens. Matter., 2013, 417, 75 CrossRef CAS.
- B. Yang, Z. Liu, Z. Guo, W. Zhang, M. Wan, X. Qin and H. Zhong, Appl. Surf. Sci., 2014, 316, 22 CrossRef CAS.
- X. Liu, L. Cao, W. Song, K. Ai and L. Lu, ACS Appl. Mater. Interfaces, 2011, 3, 2944 CAS.
- (a) C. Rajesh, C. Majumder, H. Mizuseki and Y. Kawazoe, J. Chem. Phys., 2009, 130, 124911 CrossRef PubMed; (b) H. Vovusha, S. Sanyal and B. Sanyal, J. Phys. Chem. Lett., 2013, 4, 3710 CrossRef CAS.
- H. Wang, J. T. Robinson, G. Diankov and H. Dai, J. Am. Chem. Soc., 2010, 132, 3270 CrossRef CAS PubMed.
- I. Langmuir, J. Am. Chem. Soc., 1918, 40, 1361 CrossRef CAS.
- H. Freundlich, J. Phys. Chem., 1907, 57, 385 CAS.
- R. K. Jammula, A. Tumuluri, N. K. Rotte, K. C. James Raju and V. V. S. S. Srikanth, Carbon, 2014, 78, 374 CrossRef CAS.
- M. McDonald, I. Mila and A. Scalbert, J. Agric. Food Chem., 1996, 44, 599 CrossRef CAS.
Footnote |
| † Presently at Centre for Research in Nanotechnology & Science (CRNTS), IIT Bombay, Powai, Mumbai 400076, India. |
| This journal is © The Royal Society of Chemistry 2016 |

