Retracted Article: A study on the luminescence properties of gamma-ray-irradiated white light emitting Ca2Al2SiO7:Dy3+ phosphors fabricated using a combustion-assisted method
Geetanjali Tiwari*a,
Nameeta Brahme*a,
Ravi Sharmab,
D. P. Bisena,
Sanjay K. Saoa and
S. J. Dhoblec
aSchool of Studies in Physics and Astrophysics, Pt. Ravishankar Shukla University, Raipur, C. G., India. E-mail: geetanjali.tiwari10@gmail.com; namitabrahme@gmail.com
bDepartment of Physics, Govt. Arts and Commerce Girls College, Devendra Nagar, Raipur, C.G., India
cDepartment of Physics, RTM University, Nagpur, Maharashtra, India
First published on 6th May 2016
Abstract
Ca2Al2SiO7:Dy3+ phosphors emitting long-lasting white light were synthesized by a combustion-assisted method. The phase structure, surface morphology, particle size, and elemental composition were analysed using X-ray diffraction (XRD), transmission electron microscopy (TEM), scanning electron microscopy (SEM), and energy dispersive X-ray spectroscopy (EDX) techniques. The XRD profiles showed that all peaks could be attributed to the tetragonal Ca2Al2SiO7 phase when the sample was annealed at 1100 °C for 4 hours. The thermoluminescence (TL) intensity increased with increasing γ-dose and it seemed to become saturated at 1180 Gy. The increase in TL intensity indicates that the concentration of traps increased with the γ-dose. Moreover, the depths and frequency factors of the trap centers were calculated from the TL glow curve of the sample, which indicated that the trap centers corresponding to the 420 K (1st peak) and 462 K (2nd peak) band were more helpful to long-lasting phosphorescence. Under γ-excitation, the TL emission spectra of the Ca2Al2SiO7:Dy3+ phosphor showed the characteristic Dy3+ emission peaks at 484 nm (blue), 583 nm (yellow), and 680 nm (red), originating from the transitions 4F9/2 → 6H15/2, 4F9/2 → 6H13/2, and 4F9/2 → 6H11/2, respectively. Photoluminescence (PL) decay is also reported and it indicates that the Ca2Al2SiO7:Dy3+ phosphor shows fast and slow decay processes. The effect of the doping concentration on the crystal structure and the luminescence properties of the Ca2Al2SiO7:Dy3+ phosphors was investigated. The peak for the mechanoluminescence (ML) intensity increases linearly with the increasing impact velocity of the moving piston. The possible mechanisms of the TL, PL, and ML of the white light emitting long-lasting phosphor are also discussed.
1. Introduction
The development of long-lasting phosphors has been the subject of keen interest during the last decade. In the recent past, the production of white light-emitting diodes (LEDs) at minimum cost has been an important topic of research. However, until now, for commercial applications, no white long afterglow phosphors have been developed. The invention of LEDs has brought a significant revolution to the illumination of this century to supersede conventional incandescent or fluorescent lamps.1 White LEDs for solid-state lighting applications are attracting extensive research and commercial interest because of their high luminescence efficiency, lower power consumption, and environmentally friendly characteristics. Rare earth doped phosphors with a long lasting afterglow have been proposed and developed for various display and signing applications because of their high luminosity, long duration time, and improved chemical stability.2However, progress in these fields has been rather slow. It has taken almost 100 years to extend the persistence time from minutes to tens of hours. One of the reasons for this is that it is hard to introduce proper traps in these materials.3 Until now, the best performing long-lasting phosphorescent materials are Eu2+ doped alkaline earth aluminate phosphors, i.e., SrAl2O4:Eu,Dy (green), CaAl2O4:Eu,Nd (blue), and Eu3+ doped oxysulfide yttrium, Y2O2S:Eu,Ti,Mg (red),4,5 and red to near-infrared persistent luminescence from Mn2+ doped sodium gallium aluminum germanate glasses (NaAlGe3O8:Mn2+).6
These phosphors emit colours from blue to red. From the combination of blue, green, and red phosphors, white light long-lasting phosphorescence is hard to obtain. It is a difficult task to maintain an appropriate ratio of existing blue, yellow, green, and red emitting phosphors to achieve a white colour. Near white light emission is possible to achieve by adjusting the yellow to blue intensity ratio values. Approaches have been adopted to find a material that can produce white light emission by the combination of different coloured emissions from an identical luminescence center. To keep the afterglow colour unchanged, the same decay process from the identical center for the different colour emissions is essential. Rare earth dysprosium ions (Dy3+) have three dominant emission bands in the blue region: 470–500 nm due to blue, 550–600 nm (yellow), and 600–700 nm (red), originating from the transitions 4F9/2 → 6H15/2, 4F9/2 → 6H13/2, and 4F9/2 → 6H11/2.7 This present work aims to produce white light emitting long-lasting phosphors.
Dy3+ ions have potential applications in fluorescent tubes, colour televisions, glass lasers, long-lasting mercury free fluorescence lamps, and white LEDs.8 In these devices, luminescent materials absorb energy generated from cathode ray or ultraviolet (UV) radiation and then convert it to visible light. The Dy3+ ion is also a good activator for the preparation of electron trapping luminescence materials.9 Dy3+ activated luminescent materials are single phase white phosphors and highly luminous white light emission resulting from a single phase phosphor is expected. A few silicates such as SrSiO3, Sr2MgSi2O7, Ca2MgSi2O7, and Sr2SiO4 doped with Dy3+ ions have already exhibited white light emission.10 This paper reports samples of Ca2Al2SiO7 prepared by a conventional combustion-assisted method with changing concentrations of Dy3+ (0.5, 1, 2, 3, and 4 mol%). Detailed studies of the photoluminescence (PL), mechanoluminescence (ML) and thermoluminescence (TL) have been carried out. The prepared samples exhibited white light emission when excited at 351 nm. The associated colour temperature was also calculated to check the suitability of the prepared phosphors as a practical white light source. Several reports dealing with the luminescence studies of Ce3+, Eu3+, and Tb3+ doped Ca2Al2SiO7 are available in the literature;11,12 however, the TL, ML, PL and the afterglow spectra of the Dy3+ doped CaAl2SiO7 phosphors are reported here for the very first time, to the best of our knowledge.
2. Experimental
2.1 Sample preparation
The Dy3+ doped Ca2Al2SiO7 (Dy = 0.5, 1, 2, 3, and 4 mol%) samples were prepared by a combustion technique. The combustion method furnishes a simple method for preparing a silicate based phosphor. Calcium nitrate Ca(NO3)2, aluminium nitrate Al(NO3)3·9H2O, silicate SiO2, and dysprosium nitrate Dy(NO3)3·6H2O were used as the starting materials. Urea (NH2CONH2) was used as the fuel. A stoichiometric composition of nitrate and urea were mixed together and crushed for 1 hour to form a thick paste. This paste was then transferred to a crucible and introduced into a furnace maintained at 600 °C. Initially, the mixture boiled and spontaneous ignition occurred resulting in a foamy product. This dry foamy product was milled to obtain the precursor powder. The precursor powders were ground and annealed at 1100 °C for 4 h to obtain the Ca2Al2SiO7:Dy3+ phosphor.2.2 Characterization
The crystalline structure and particle morphology of the resulting samples were investigated by X-ray diffraction (XRD) analysis (model D8 Advance Bruker AXS) using Cu Kα radiation (λ = 0.154 nm). Data was collected by step scanning 2θ from 20° to 60°. The phase structure of the sample was verified with the help of the Joint Committee of Powder Diffraction Standard Data (JCPDS) file (JCPDS: 35-0755) and the average crystallite size was calculated using the Debye–Scherrer formula (D = kλ/β![[thin space (1/6-em)]](https://www.rsc.org/images/entities/char_2009.gif) cos
cos![[thin space (1/6-em)]](https://www.rsc.org/images/entities/char_2009.gif) θ). The particle size of the prepared phosphor was determined by transmission electron microscopy (TEM) using a Tecnai G2S – TWIN-FEI. The morphologies of the phosphors were characterized by scanning electron microscopy (SEM) with energy dispersive X-ray spectroscopy (EDX) (model: QUANTA-200F-FEI). Gamma irradiation was carried out using a 60Co source with an exposure rate of 0.930 kGy h−1. The ML was excited by dropping a piston (mass 400 g) onto the sample from various heights. The impact velocity of the piston was calculated using the formula: v = √2gh. The ML was monitored using a photomultiplier tube (RCA-931A) connected to a digital storage oscilloscope (scientific SM-340). A schematic diagram of the experimental setup used for deforming the sample and measuring the ML is shown in Fig. 1. The emission spectra and the afterglow spectra were measured by a fluorescence spectrophotometer (Shimadzu RF-5301 XPC) and the emission was recorded using a spectral slit width of 1.5 nm. The TL glow curve was recorded using a TL reader (Nucleonix TL1009I) by heating the sample with a heating rate 10 °C s−1. TL/ML emission spectra were recorded using interference filters of different wavelengths. All measurements were carried out at room temperature.
θ). The particle size of the prepared phosphor was determined by transmission electron microscopy (TEM) using a Tecnai G2S – TWIN-FEI. The morphologies of the phosphors were characterized by scanning electron microscopy (SEM) with energy dispersive X-ray spectroscopy (EDX) (model: QUANTA-200F-FEI). Gamma irradiation was carried out using a 60Co source with an exposure rate of 0.930 kGy h−1. The ML was excited by dropping a piston (mass 400 g) onto the sample from various heights. The impact velocity of the piston was calculated using the formula: v = √2gh. The ML was monitored using a photomultiplier tube (RCA-931A) connected to a digital storage oscilloscope (scientific SM-340). A schematic diagram of the experimental setup used for deforming the sample and measuring the ML is shown in Fig. 1. The emission spectra and the afterglow spectra were measured by a fluorescence spectrophotometer (Shimadzu RF-5301 XPC) and the emission was recorded using a spectral slit width of 1.5 nm. The TL glow curve was recorded using a TL reader (Nucleonix TL1009I) by heating the sample with a heating rate 10 °C s−1. TL/ML emission spectra were recorded using interference filters of different wavelengths. All measurements were carried out at room temperature.
 | ||
| Fig. 1 Schematic diagram of the experimental setup used for deforming the sample and measuring the ML. | ||
The samples were wrapped in aluminium foil and kept in the dark until the ML studies were carried out. The ML studies were carried out in a dark room. The crystals were fractured via dropping a load with a mass of 400 g and a cylindrical shape onto the crystals. To change the impact force, the load was dropped from different heights. The experimental setup is shown in Fig. 1. The transient ML was recorded using a photomultiplier tube and an oscilloscope.
3. Results and discussion
3.1 XRD analysis
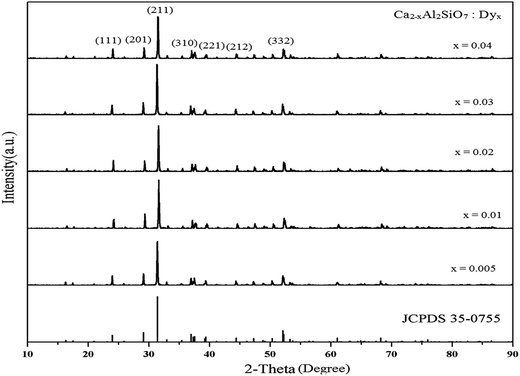
The phase structures of the prepared Ca2Al2SiO7:Dy3+ phosphors were analyzed by XRD (Fig. 2). The positions of the diffraction peaks of the prepared Ca2Al2SiO7:Dy3+ phosphors matched well with the standard JCPDS data of the compound Ca2Al2SiO7 with a pure tetragonal phase (JCPDS file no. 35-0755). The small amount of doped rare earth ions (Dy3+) had virtually no effect on the phase structure of the pure Ca2Al2SiO7 phosphor. No other crystalline phases were detected. The diffraction intensity was maximum for the (211) plane with 2θ = 31.4°. This structure, a member of the melilite group, has the space group P![[4 with combining macron]](https://www.rsc.org/images/entities/char_0034_0304.gif) 21m (no. 113) with cell parameters a = b = 0.7690 nm and c = 0.5063 nm. The average crystallite size was calculated from the XRD pattern using the Debye–Scherrer relation D = kλ/β
21m (no. 113) with cell parameters a = b = 0.7690 nm and c = 0.5063 nm. The average crystallite size was calculated from the XRD pattern using the Debye–Scherrer relation D = kλ/β![[thin space (1/6-em)]](https://www.rsc.org/images/entities/char_2009.gif) cos
cos![[thin space (1/6-em)]](https://www.rsc.org/images/entities/char_2009.gif) θ, where D is the crystallite size for the (hkl) plane, k is the dimensionless shape factor with a value close to unity, λ is the wavelength of the incident X-ray radiation Cu Kα (0.154 nm), β is the full width at half maximum (FWHM) in radiation, and θ is the corresponding angle of Bragg diffraction. In the case of the (211) plane, the average crystallite size of the Ca2Al2SiO7:Dy3+ phosphor was ∼50.15 nm.
θ, where D is the crystallite size for the (hkl) plane, k is the dimensionless shape factor with a value close to unity, λ is the wavelength of the incident X-ray radiation Cu Kα (0.154 nm), β is the full width at half maximum (FWHM) in radiation, and θ is the corresponding angle of Bragg diffraction. In the case of the (211) plane, the average crystallite size of the Ca2Al2SiO7:Dy3+ phosphor was ∼50.15 nm.
3.2 Transmission electron microscopy (TEM)
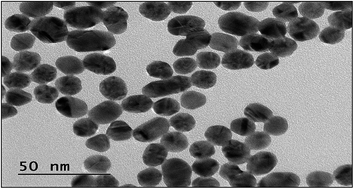
The grain size of the Ca2Al2SiO7:Dy3+ phosphor is shown in Fig. 3. The TEM images confirm the grain size of the prepared phosphor. From the TEM image, it can be observed that the prepared sample consists of grains with different size distributions. Moreover, an agglomeration of powder particles was also observed, which is due to the high temperature heat treatment. The TEM results are in good correlation with the XRD results.3.3 Scanning electron microscopy (SEM)
Fig. 4 shows the SEM micrograph of the Ca2Al2SiO7:Dy3+ phosphor. The microstructure of the sample reflects the inherent nature of the combustion process. When a gas escapes under high pressure during the combustion process, pores are formed with the formation of small particles near the pores. The non-uniform and irregular shapes of the particles as shown can be attributed to the non-uniform distribution of temperature and mass flow in the combustion flame. The particle was almost spheroidal and had some extent of agglomeration.3.4 Energy dispersive X-ray spectroscopy (EDX)
Fig. 5 shows the EDX spectra of the prepared sample. EDX is a standard procedure for identifying the elemental composition of a sample area as small as a few nanometers. The existence of Dy in the prepared phosphor could be clearly seen from the corresponding EDX spectra. No other emissions appeared apart from that of calcium (Ca), aluminium (Al), silicon (Si), oxygen (O), and Dy in the Ca2Al2SiO7:Dy3+ EDX spectra of the phosphor.3.5 Photoluminescence of Ca2Al2SiO7:Dy3+
The excitation spectra for the 583 nm emission consist of a series of line spectra in 300–400 nm with the strongest at 351 nm and the weakest at 391 nm, which are ascribed to the transitions from the ground state to excitation states in the 4f9 configuration of Dy3+ [Fig. 6(a)]. The emission spectra mainly consist of three groups of sharp lines peaking at about 484 (blue), 583 (yellow), and 680 nm (red), which are associated with the transitions of Dy3+ from the excited state 4F9/2 → 6H15/2, 4F9/2 → 6H13/2, and 4F9/2 → 6H11/2, respectively13 [Fig. 6(b)]. One can also find that the emission lines of Dy3+ are broadened, which may be because of several Stark levels for the excited state 4F9/2 → 6HJ. It is well known that the former weak blue emissions at 484 nm (4F9/2 → 6H15/2) corresponded to the magnetic dipole transition, which hardly changes with the crystal field strength around Dy3+. While the later stronger yellow emission at 583 nm (4F9/2 → 6H13/2) belongs to the hypersensitive forced electric dipole transition, which is strongly influenced by the surrounding environment.14 According to the Judd–Ofelt theory,15 a yellow emission due to an electric dipole transition (4F9/2 → 6H13/2) will be dominant if the Dy3+ is located at a low symmetry local site without inversion symmetry. Conversely, a strong blue emission due to a magnetic dipole transition (4F9/2 → 6H15/2) will predominate in the emission spectra. In our case, the dominant emission is yellow emission (4F9/2 → 6H13/2), which is beneficial to decreasing the colour temperature of the phosphor. The synthesis technique and the structure of the matrix greatly influence the optical properties of the material. Generally, Dy3+ ions were used as codopants in the developed aluminate and silicate based materials. When divalent alkaline earth ions, such as Ca2+ or Sr2+, are substituted by trivalent Dy3+ in alkaline earth silicates and aluminates, various defects are induced due to the charge compensation mechanism.16 In Eu2+ and the Dy3+ co-doped materials, most of the excitation energy will be transferred from the host or from the Dy3+ to the Eu2+; hence, only the 5d–4f emissions of Eu2+ can be observed. However, in Dy3+ singly doped samples, Dy3+ is not only an activator itself, but also generates traps. Fig. 7 schematically illustrates the process of emitting white light in the Ca2Al2SiO7:Dy3+ phosphor. After irradiation with γ-radiation (process [1]), most of the excitation energy associated with the excited electrons or holes is transferred by the host directly to the luminescence centers, followed by the Dy3+ 4f emissions as immediate luminescence (process [2]). However, some of the excitation energy will be stored by the excited carriers when they drop into the traps (process [3]), rather than returning to the ground state. Later, at appropriate temperatures (thermal excitation), these carriers will be released from the traps and transferred to the host and then to the Dy3+ ions, giving out characteristic Dy3+ emissions as long afterglow (process [4]). In the practical system, the electron traps and the hole traps may not be equally abundant or important in terms of their contribution to the white light emission, as suggested in Fig. 7.17 | ||
| Fig. 6 (a) Excitation spectra of the Ca2Al2SiO7:Dy3+ phosphor. (b) Emission spectra of the Ca2Al2SiO7:Dy3+ phosphor. | ||
3.6 International commission on illumination (CIE) chromaticity coordinates
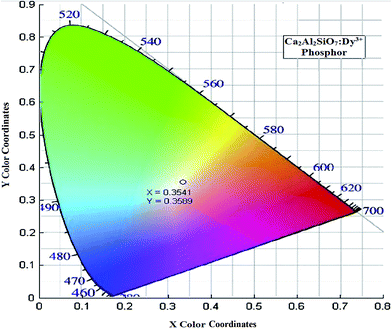
The International Commission on Illumination (CIE) coordinates were calculated to determine the exact color emitted from the emission spectra and it was found that, near white light emission occurred, which is illustrated in Fig. 8. In general, the color of any phosphor material is represented by means of color coordinates. The emission spectrum of the Ca2Al2SiO7:Dy3+ phosphor sample was converted to the CIE 1931 chromaticity using the photoluminescent data and the interactive CIE software (CIE coordinate calculator) diagram, as shown in Fig. 8. The calculated chromaticity coordinates for the white light emitted from the Ca2Al2SiO7:Dy3+ phosphor are given by x = 0.3541 and y = 0.3589, which is in agreement with the chromaticity coordinates of standard white light (x = 0.334 and y = 0.337).183.7 Correlated color temperature (CCT)
In order to investigate the suitability of the prepared phosphors as a practical white light source, the correlated color temperature (CCT) of the samples was calculated. The CCT is a specification of the color appearance of the light emitted by a light source, relating its color to the color of light with respect to a reference light source when heated up to a specific temperature, in degrees Kelvin (K). The CCT rating for a lamp or a light source is a general warmth or coolness measure of its appearance. However, opposite to the temperature scale, lamps with a CCT rating below 3200 K are usually considered “warm” sources, while those with a CCT above 4000 K are usually considered “cool” in appearance.19–21 McCamy proposed an analytical equation to calculate the CCT, which is given19–21 by| CCT = 449n3 + 3525n2 + 6823.3n + 5520.33 |
Generally, the preferred CCT values range from 3500 to 6500 K but values within a range of 3000 to 7800 K may also be accepted. It can be seen that the value of CCT is from 4705 K, which is well under the acceptable range and can be considered “cool” in appearance.
3.8 Decay characteristics
The decay curve of the phosphor was measured and is exhibited in Fig. 9. The initial intensity of Ca2Al2SiO7:Dy3+ is much stronger, which is due to the higher emission efficiency of Ca2Al2SiO7:Dy3+. The rate of decay of the intensity is given by the formula.22
I = I1![[thin space (1/6-em)]](https://www.rsc.org/images/entities/char_2009.gif) exp(−t/τ1) + I2 exp(−t/τ1) + I2![[thin space (1/6-em)]](https://www.rsc.org/images/entities/char_2009.gif) exp(−t/τ2) exp(−t/τ2)
| (1) |
| Phosphor | τ1 (min) | τ2 (min) |
|---|---|---|
| Ca2Al2SiO7:Dy3+ | 12 | 82 |
3.9 Mechanoluminescence of Ca2Al2SiO7:Dy3+
ML is an interesting luminescence phenomenon whereby light emission in solids is caused by grinding, rubbing, cutting, cleaving, shaking, scratching, compressing, or by crushing solids. Fig. 10 shows that the ML intensity initially increases with the increase in the concentration of Dy3+ ions, attains an optimum value for 1 mol% then decreases with the further increase in the concentration of Dy3+. Two peaks were found in the ML vs. time curve [Fig. 10(a)]. | ||
| Fig. 10 (a) ML intensity versus time curve for different Dy3+ concentrations. (b) Variation in ML peak intensity with Dy3+ concentration variation. | ||
It is believed that the first peak can be attributed to the ML produced due to charging of the newly created surface. Since the mechanical energy cannot be supplied directly to the trapped charge carrier, a deformation induced intermediate process is responsible for the de-trapping of the charge carriers. ML is a defect related phenomenon associated with a trap involved process, in which electrons (or holes) dwell in the trap for some time and then recombine with the luminescence center, either by traveling in the conduction band (or valence band) or by electron (or hole) tunneling. As for ML materials, in particular, their combination process is facilitated by the assistance of dislocation in the crystal.23–26 In the present investigation, the probability of the involvement of dislocation is very low because of the particle size of the crystal, probably piezoelectrification during the impact is responsible for the detrapping of the trapped charge carriers.27 When the moving piston hits the Ca2Al2SiO7:Dy3+ phosphor, it produces a piezoelectric field in the sintered phosphor as they are non-centrosymmetric. When a crack moves through a crystallite, one of its faces becomes positively charged and the other surface becomes negatively charged. Therefore, an electric field of the order of 108 V m−1 is produced between the two oppositely charged surfaces.28 The emission of electrons produced during the fracture of the crystals has been reported by many researchers. The piezoelectric field near certain defects centers may be high due to the change in the local structure. The piezoelectric field reduces the trap depth of the carriers. The decrease in trap depth causes a transfer of electrons from the electron traps to the conduction band. Subsequently, the moving electrons in the conduction band are captured in the excited state, located at the bottom of the conduction band, whereby excited Dy3+ ions are produced. The de-excitation of excited Dy3+ ions gives rise to the light emission characteristic of the Dy3+ ions, which can be attributed to 4F9/2 → 6H15/2, 4F9/2 → 6H13/2, and 4F9/2 → 6H11/2 of the Dy3+ ions.29,30
The occurrence of the second peak, which occurs in the post deformation region, may be due to the capture of carriers by the shallow traps located away from the newly created surfaces where the electric field near the surface is not so effective. The release of the trapped charge carriers from the shallow traps may take place later due to the thermal vibration of lattices and therefore a delayed ML (second peak) may be produced, which may be located in the post deformation region of the phosphor.31
Fig. 11 shows the gamma dose dependence of the ML intensity. It was observed that the ML intensity increases with the increase in gamma dose as more charge carriers become trapped, after which it seems to become saturated as no more traps are available for trapping.
 | ||
| Fig. 11 (a) ML intensity versus time curve for the γ-irradiated phosphor. (b) Dependence of peak ML intensity on the γ-dose. | ||
Fig. 12(a) shows the characteristic curve between ML intensity versus time for the Ca2Al2SiO7:Dy3+ phosphor at different heights. The experiment was carried out for a fixed moving piston (400 g) dropped from different heights of 20, 30, 40, and 50 cm. It is evident that the ML intensity increases with an increase in the falling height of the moving piston, showing an ML peak intensity maximum at a height of 50 cm.32 This is because the experimental limitation is the maximum height from which the piston is dropped, i.e., 50 cm.
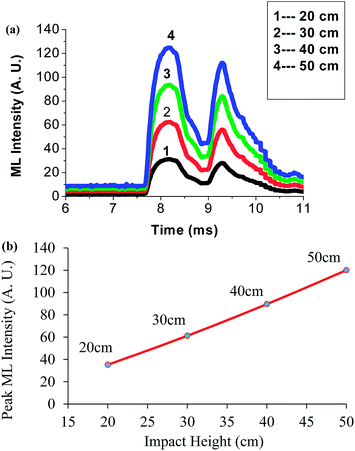 | ||
| Fig. 12 (a) Change in the ML intensity with impact height for a γ-dose of 1180 Gy. (b) Peak ML intensity versus impact height for a γ-dose of 1180 Gy. | ||
Fig. 12(b) shows the curve between the peak ML intensity versus the impact velocity of Ca2Al2SiO7:Dy3+ phosphor. The ML intensity increases linearly with increasing the falling height of the moving piston; that is, the ML intensity depends upon the impact velocity of the moving piston [√2gh (where h is the different heights of the moving piston)]. As the velocity of the moving piston increases, the ML intensity increases due to the creation of a new surface on impact.
For the ML figures (Fig. 10–12), the first ML peak occurs due to the charging of the newly created surface. When the moving piston hits the phosphor, the effect of the piston is not uniform on the whole surface area of the phosphor as it is in powder form. Thus, the ML peak is broad. On the other hand, the second peak is due to the release of carriers from shallow traps, which takes place later on due to thermal vibration of the lattice and does not depend on the impact of surface area, therefore, the peak is sharp.
The ML properties of this phosphor could provide high sensitivity for smart skin and self-diagnosis applications. When the surface of an object is coated with an ML material, the stress distribution in the object beneath the layer could be reflected by the ML brightness and could be observed. Based on the above analysis, this phosphor could also be used as a sensor to detect the stress of an object.33
3.10 Thermoluminescence of Ca2Al2SiO7:Dy3+
Fig. 13 shows the TL glow curves of the Ca2Al2SiO7:Dy3+ phosphors. As the concentration of Dy3+ ions increased from 0.5 to 4 mol%, the intensities gradually increased and reached a maximum value at 1 mol%. With a further increase in Dy3+ ion concentration, the intensity decreased remarkably due to concentration quenching. | ||
| Fig. 13 (a) TL glow curve for different Dy3+ concentrations. (b) Dependence of total TL intensity on Dy3+ concentration. | ||
Fig. 14 shows the dependence of TL intensity on the γ-dose of Ca2Al2SiO7:Dy3+ (1 mol%) sample. Observations were taken for different gamma radiation doses: 295, 590, 1180, and 1770 Gy. It was found that the total TL intensity initially increased with the γ-dose and it seems to become saturated at 1180 Gy.
 | ||
| Fig. 14 (a) TL glow curves for different γ-doses. (b) Dependence of TL peak intensity on the γ-dose. | ||
Under exposure to γ-rays, electron–hole pairs are created. Some of the released electrons are captured by the impurity RE3+ ions that convert to RE2+. The hole is captured in the host related centers. Warming of the irradiated samples causes these holes to become un-trapped successively at different temperatures, depending on their thermal stability. The excited impurity ions, by decaying to their ground state, give the characteristic emission of RE3+.34
The increase in the TL/ML intensity with the γ-dose, attributed to the increase of active luminescent centers with γ-ray irradiation and subsequent emission of TL/ML, is due to re-oxidation of RE2+ into RE3+ during heating/deformation. Thus the intensity increases in the initial stage. The dosage saturation can be explained on the assumption that only a limited number of RE ions are available for charge reduction with γ-ray irradiation.
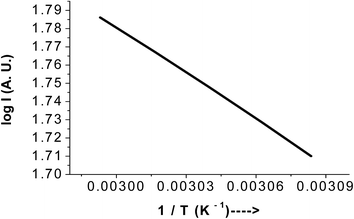
The peak deconvolution of the TL curve is shown in Fig. 15. It has two dominant bands peaking at 147 °C and 189 °C. Dy3+ is an important rare earth ion in the development of phosphors with long-lasting afterglow. The dopant Dy3+ is a well-known trap-creating ion, which can greatly prolong afterglow. It is reasonable to consider that the role of the doping Dy3+ ions is to introduce new types of traps or significantly increase the concentration of traps responsible for the afterglow. We tentatively propose two possible types of traps in Ca2Al2SiO7:Dy3+. In the first case, Dy ions act as not only luminescence centers but also traps, since Dy ions can form some electron trap levels in the band gap.35 In the other case, the traps can occur because of the charge compensation due to the substitution of divalent Ca2+ and Al2+ ions in the Ca2Al2SiO7:Dy3+ host by trivalent Dy3+ ions. The fact that the characteristic excitation of Dy3+ can lead to an afterglow emission from Dy3+ suggests that the trap filling process may occur through the direct transfer of electrons from the excited states of Dy3+ to trap centers and not via the conduction band since the excitation energy is smaller than the band gap. During the afterglow emission, the trapped electrons are released and produce visible emission from Dy3+.
| Peak | γ-Dose | Tm (°C) | HTR (heating rate) | Activation energy (E) (eV) | Frequency factor (s−1) |
|---|---|---|---|---|---|
| 1st | 1180 Gy | 147 | 10 | 0.78 | 1.12 × 10¹⁴ |
| 2nd | 1180 Gy | 189 | 10 | 1.29 | 2.01 × 10¹⁴ |
TL emission spectra
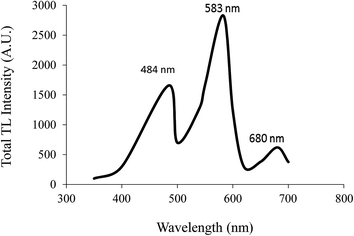
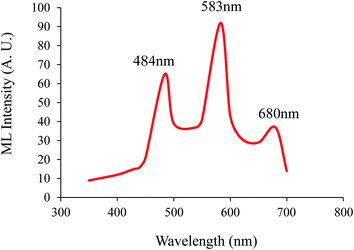
Fig. 18 shows that the TL emission spectra of the Ca2Al2SiO7:Dy3+ phosphor exhibits a broad emission band centered on 484 (blue), 583 (yellow), and 680 nm (red), which are associated with the transitions of Dy3+ from the excited state 4F9/2 → 6H15/2, 4F9/2 → 6H13/2 and 4F9/2 → 6H11/2, respectively. This is similar to the PL emission spectra.When the sample was deformed by dropping the load onto the sample, piezoelectrification took place. The produced piezoelectric field caused the de-trapping of trapped electrons and radiative recombination at Dy3+ to give rise to ML phenomena.
 | ||
| Fig. 20 The afterglow spectra of the Ca2Al2SiO7:Dy3+ (1 mol%) phosphor with 2 min, 5 min, and 10 min delay times without Xe lamp excitation. | ||
The CIE chromaticity coordinates of the afterglow spectra (Fig. 20) are plotted in Fig. 21. The emission of the Dy3+ doped sample has the chromaticity coordinates of x = 0.3541 and y = 0.3589 under 351 nm excitation, as depicted in Fig. 8 (i.e., the CIE chromaticity diagram of the Ca2Al2SiO7:Dy3+ (1 mol%) phosphor).
The chromaticity coordinates of the long afterglow spectra are depicted by points 2, 5, and 10. All the points are in the white color range, ensuring a white afterglow of the sample. However, its emission color may need to be improved. After UV irradiation, the sample shows a white afterglow with a little yellow color, which is consistent with the high y coordinates of these points in Fig. 21.
The afterglow can be observed for 3 h with the naked eye in darkness. More accurate measurements on the afterglow brightness are needed. In general, the decay processes of the Dy3+ emissions are almost similar36 because the Dy3+ emissions are from the same energy level (4F9/2) and are supported by the same trap centers. On the other hand, the decay of the weak host emission band at 583 nm is faster than Dy3+ emission in the Dy3+ doped phosphor. Consequently, it can be seen in Fig. 20 that the 583 nm emission is relatively weakened during the decay process, the ratio of I583 to I484 decreases, and the x coordinates of the afterglow spectra also decrease (Fig. 21).
4. Conclusions
In conclusion, new potential white light emitting Ca2Al2SiO7:Dy3+ phosphors were synthesized by a combustion-assisted method. The phase structure of the Ca2Al2SiO7:Dy3+ phosphors was consistent with standard tetragonal crystallography. TEM results also confirmed the nano size of the prepared phosphors. Under ultraviolet excitation, the prepared Ca2Al2SiO7:Dy3+ phosphors emitted blue, yellow, and red light with corresponding peaks at 484 nm, 583 nm, and 680 nm, respectively. The red light emission peak at 680 nm was weak compared to the blue emission (484 nm) and yellow emission (583 nm). The strong yellow emission dominated the PL, TL and ML emission spectra. The PL emission exhibited a white light as confirmed by the calculated CIE coordinates, which were found to be very close to standard white light for human eyes. The TL/ML intensity increased with the increase in γ exposure time, indicating an increase in the concentration of traps with γ dose. The ML intensity linearly increased with increasing impact velocity. The present investigation indicates that piezoelectrification is responsible for producing the ML in the prepared phosphor. Based on the above analysis, this phosphor could be used as a sensor to detect the stress of an object. We have prepared these phosphors by a combustion-assisted method and we found that the PL, TL, and ML intensity increased more as compared to solid state reaction methods.References
- H. Yamamoto and T. Matsuzawa, J. Lumin., 1997, 287, 72–74 Search PubMed.
- T. Aitasalo, J. Holsa, H. Jungner, M. Lastusaari and J. Niittykoski, J. Lumin., 2001, 59, 94–95 Search PubMed.
- D. Jia, R. S. Meltzer and W. M. Yen, Appl. Phys. Lett., 2002, 80, 1535 CrossRef CAS.
- L. Lin, Z. Zhonghua, Z. Weiping, Z. Zhiquiang and Y. J. Min, Rare Earths, 2009, 27, 749–752 CrossRef.
- D. V. Sunitha, H. Nagabhushana, S. C. Sharma, B. M. Nagabhushana, D. B. Prasad and R. P. S. Chakradhar, Spectrochim. Acta, Part A, 2014, 127, 381–387 CrossRef CAS PubMed.
- P. Li, M. Peng, L. Wondraczek, Y. Zhao and B. Viana, J. Mater. Chem. C, 2015, 3, 3406 RSC.
- Y. Fu, H. Ma, Y. Liuc, B. Han, H. Feng and Q. Yu, Ceram. Int., 2014, 40, 10189–10192 CrossRef.
- W. Jiyou, W. Jianbo and D. Ping, Mater. Lett., 2013, 96–98 Search PubMed.
- L. Bo, K. Linjie and C. Shi, J. Lumin., 2007, 86, 121–124 Search PubMed.
- B. Liu, C. Shi and Z. Qi, J. Phys. Chem. Solids, 2006, 67, 1674 CrossRef CAS.
- G. Tiwari, N. Brahme, R. Sharma, D. P. Bisen, S. K. Sao and M. Singh, Luminescence, 2016, 31, 793–801 CrossRef CAS PubMed.
- G. Tiwari, N. Brahme, R. Sharma, D. P. Bisen and S. K. Sao, Int. J. Eng. Res. Tech., 2015, 02, 591–596 Search PubMed.
- A. K. Parchur and R. S. Ningthoujam, Dalton Trans., 2011, 40, 75–90 Search PubMed.
- G. S. Rama Raju, J. Y. Park, H. C. Jung, B. K. Moon, J. H. Jeong and J. H. Kim, Curr. Appl. Phys., 2009, 09, 92 CrossRef.
- N. N. Yamashita, J. Phys. Soc. Jpn., 1973, 35, 1089 CrossRef CAS.
- J. Kuang, Y. Liu and J. Zhang, J. Solid State Chem., 2006, 179, 266–269 CrossRef CAS.
- Y. Chen, X. Cheng, M. Liu, Z. Qi and C. Shi, J. Lumin., 2009, 129, 531–535 CrossRef CAS.
- S. Fan, C. Yu, D. He, X. Wang and L. Hu, Opt. Mater. Express, 2012, 6, 765–770 CrossRef.
- C. S. McCamy, Color Res. Appl., 1992, 17, 142–144 CrossRef.
- http://www.lrc.rpi.edu/education/learning/terminology/cct.asp.
- http://www.en.wikipedia.org/wiki/Color_rendering_index.
- H. Wu, Y. Hu, G. Ju, C. Li, X. Wang and Z. Yang, J. Lumin., 2011, 131, 2441–2445 CrossRef CAS.
- M. Akiyama, N.-X. Chao, H. Matsui, K. Nonaka and T. Watanabe, Appl. Phys. Lett., 1999, 75, 2548 CrossRef CAS.
- Y. Jia, M. Yei and W. Jia, Opt. Mater., 2006, 28, 974 CrossRef CAS.
- J. S. Kim, K. Kibble, Y. N. Kwon and S. K. Sohn, Opt. Lett., 2009, 34, 1915–1917 CrossRef CAS PubMed.
- B. P. Chandra, V. D. Sonawane, B. K. Haldar and S. Pandey, Opt. Mater., 2011, 33, 247–586 CrossRef.
- B. P. Chandra, C. N. Xu, H. Yamada and X. G. Zheng, J. Lumin., 2010, 130, 442 CrossRef CAS.
- G. Tiwari, N. Brahme, D. P. Bisen, S. K. Sao and R. Sharma, Phys. Procedia, 2015, 76, 53–58 CrossRef CAS.
- R. S. Kher, R. K. Pandey, S. J. Dhoble and M. S. K. Khokhar, Radiat. Prot. Dosim., 2002, 100, 281 CrossRef CAS PubMed.
- H. Zhang, X. Chao-Nan, N. Terasaki and H. Yamada, Phys. E, 2010, 42, 2872–2875 CrossRef CAS.
- G. Tiwari, N. Brahme, R. Sharma, D. P. Bisen, S. K. Sao and U. K. Kurrey, J. Mater. Sci.: Mater. Electron., 2016, 27, 6399–6407 CrossRef CAS.
- H. Zhang, N. Terasaki, H. Yamada and C. N. Xu, Int. J. Mod. Phys. B, 2009, 23, 1028–1033 CrossRef CAS.
- H. Zhang, H. Yamada, N. Terasaki and C. N. Xu, Jpn. J. Appl. Phys., 2009, 48, 04C109 Search PubMed.
- S. K. Sao, N. Brahme, D. P. Bisen and G. Tiwari, J. Biolumin. Chemilumin., 2015 DOI:10.1002/bio.3116.
- S. K. Sao, N. Brahme, D. P. Bisen and G. Tiwari, Phys. Procedia, 2015, 76, 59–67 CrossRef CAS.
- L. Lin, Z. Zhonghua, Z. Weiping, Z. Zhiqiang and Y. Min, J. Rare Earths, 2009, 27, 749 CrossRef.
| This journal is © The Royal Society of Chemistry 2016 |

