G-quadruplex–hemin DNAzyme molecular beacon probe for the detection of methamphetamine

Kang Maoa, Zhugen Yangbc, Peng Dua, Zeqiong Xua, Zhenglu Wanga and Xiqing Li*a
aLaboratory for Earth Surface Processes, College of Urban and Environmental Sciences, Peking University, Beijing 100871, China. E-mail: xli@urban.pku.edu.cn; Fax: +86-10-62753246; Tel: +86-10-62753246
bDivision of Biomedical Engineering, School of Engineering, University of Glasgow, Oakfield Road, G12 8LT, Glasgow, UK
cDepartment of Chemistry, University of Bath, Claverton Down, BA2 7AY, Bath, UK

Received 24th February 2016 , Accepted 16th March 2016

First published on 22nd June 2016


Abstract

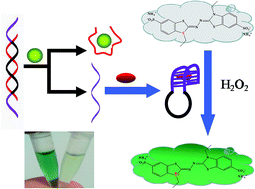
In this work, a simple, cost-effective, and label-free biosensor was constructed for methamphetamine (METH) detection. The biosensor consists of a G-quadruplex–hemin DNAzyme molecular beacon (DNAzyme MB), a METH aptamer, and a colorimetric substrate. The DNAzyme MB loses peroxidase activity when it hybridizes with the METH aptamer. In the presence of METH, DNAzyme MB dissociates from the inactive hybrid due to preferable hybridization of METH with the aptamer. This process recovers the activity of DNAzyme MB, which catalyzes a reaction with the colorimetric substrate to yield measurable signals. Under optimized conditions, a detection limit as low as 0.5 nM (74.6 ng L−1) was achieved. Common illicit drugs were found to have little interference on detection of METH. Recoveries of METH spiked in urines of addicts were greater than 85%. Good agreement was observed between METH concentrations in urines determined by the sensor and by liquid chromatography-tandem mass spectrometer. These results indicate that the G-quadruplex–hemin DNAzyme MB probe holds promise to detect METH not only in biological samples, but also in environmental matrices.

Introduction

The abuse of illicit drugs is a worldwide problem that has severe societal consequences, such as loss of lives and health of abusers, increased treatment costs, and higher incidence of crimes.1–3 United Nations Office of Drugs and Crimes has recently estimated that a total of 246 million people, corresponding to 5% of the world population aged between 15 and 64, had used illicit drugs at least once in 2013.4 Among the illicit drugs, methamphetamine (METH) is second only to marijuana as the most widely abused illicit drug on the world.5–7 METH abuse has increased dramatically in the recent years in certain regions of the world. For example, crystalline METH seizure has increased from a little over 7t in 2010 to 14t in 2013 in East and Southeast Asia.4 To monitor and control METH abuse, samples of different matrices (e.g., urine, blood, and wastewater) need to be analyzed (Scheme 1).
image file: c6ra04912e-s1.tif
Scheme 1 Schematic representation of colorimetric detection of METH.

Traditional methods for the quantitative METH analysis include gas chromatography-mass spectrometry,8,9 high performance liquid chromatography-mass spectrometry,2,3 ion mobility spectrometry,10 imaging mass spectrometry,11 surface enhanced Raman spectroscopy and microfluidics,12,13 etc. Although highly sensitive and selective, these techniques require expensive instruments and tedious sample pretreatment in laboratory, preventing its use for onsite detection. Thus, there is a need to develop simple, cost-effective tools that are able to accurately and rapidly monitor low levels of METH at the site of sample collection.

The limitations of conventional analytical tools maybe overcome by biosensors. A biosensor is a small device with a biological receptor that generates a signal (electrochemical, optical, nanomechanical, mass sensitive, etc.) in the presence of an analyte. Biosensors have great promise for on-site detection of analytes in body fluids and environment samples, as it have the advantages of miniaturization and being potentially portable and capable of measuring complex matrices with minimal sample preparation.14–16 In the past few decades, biosensors have been developed to measure numerous analytes in various matrices, such as heavy metals,17 small molecule,18,19 targeted DNA,14,20 peptides,21 enzyme,22 protein,21 biomarkers14,15 and even bacteria.23,24

Among biosensors, DNAzymes based sensors known as catalytic beacons have been extensively investigated due to its high specificity and sensitivity.25–29 DNAzymes are catalytically active DNA molecules that are able to catalyze chemical reactions.25,26 Compared to protein enzymes, DNAzymes are chemically more stable, inexpensive, simple to synthesize and easy to modify.28,29 One important and increasingly popular type of DNAzymes is the G-quadruplex–hemin complexes that have peroxidase activity.26,29–34 This class of DNAzyme has been used to detect targets from proteins and DNAs,29,30 to small molecules and metal ions.30–32 However, to our knowledge, no attempt has been reported in the literature to detect METH using DNAzyme-based sensors.

In this work, we developed a colorimetric biosensor for METH detection that was based on the G-quadruplex–hemin DNAzyme MB, a METH aptamer, and a colorimetric substrate. The sensor was optimized by varying the number of base pair of the MB. Selectivity of the sensor was examined using 15 commonly illicit drugs other than METH. The optimized sensor was used to detect METH in urine specimens of drug addicts and compared to measurement by liquid chromatography-tandem mass spectroscopy. The highly sensitive and specific sensor reported here has the potential for onsite detection of METH in biological and environmental samples.

Materials and methods

Biosensor construction and optimization

The biosensor consisted of a DNAzyme MB, hemin, a METH aptamer, and a colorimetric substrate. The DNAzyme MB is expected to bind METH aptamer through hybridization to form a catalytically inactive double strands DNA (dsDNA).

In the presence of METH, would dissociate from the inactive dsDNA due to preferable binding between METH and the aptamer. The dissociated DNAzyme MB is expected to bind with hemin to form the G-quadruplex–hemin, which could catalyze a colorimetric reaction of a substrate to generate a signal that can be measured by a spectrometer. The designed mechanism of the biosensor is illustrated in Fig. 1.


image file: c6ra04912e-f1.tif
Fig. 1 Absorbance at 415 nm from the ABTS oxidation for the analysis of METH. An amount of 1 μM DNAzyme MB1/METH aptamer was employed. MB: 1 μM DNAzyme MB1 + 250 nM hemin + ABTS/H2O2; MB + Apt: 1 μM DNAzyme MB1/METH aptamer + 250 nM hemin + ABTS/H2O2; MB + Apt + METH: 1 μM DNAzyme MB1/METH aptamer + 250 nM hemin + 2 μM METH + ABTS/H2O2; none: 250 nM hemin + ABTS/H2O2. The signal (ΔA) is expressed as the relative absorbance with respect to the blank and error bars represent three replicate measurements (same for below).

To confirm the effectiveness of the designed mechanism, a DNAzyme MB with a sequence of 5′-AGGGACGGGTGCCAACGTTCACCCTGAGACCATCCGACCCAATAAACCGTGGAGGGT-3′ (MB1) and a METH aptamer with a sequence 5′-ACGGTTGCAAGTGGGACTCTGGTAGGCTGGGTAATTTGG-3′ were tested.

Both the MB and the aptamer were synthesized and purified using HPLC by Sangon Biotech Co. Ltd. (Shanghai, China). The colorimetric substrate chosen in this work is 2,2′-azinobis(3-ethylbenzothiozoline)-6-sulfonic acid (ABTS), which is obtained from J&K Scientific (Beijing, China). Both MB1 and the aptamer were dissolved in HEPES buffer (25 mM HEPES, 20 mM KCl, 200 mM NaCl, pH 7.40) to a concentration of 10 μM.

The MB1 and aptamer solutions were first denatured for 5 min at 90 °C and cooled down slowly to the room temperature. The cooled MB1 and aptamer solutions (20 μL each) were mixed in 70 μL HEPES buffer and incubated at 37 °C for 30 min. Then 40 μL of 10 μM METH and 10 μL of 5 μM hemin (Alfa Aesar Chemicals Co. Ltd., Shanghai, China) were added to yield a total volume of 160 μL. After the mixture was incubated at 37 °C for 1 h, 20 μL 7.2 mM ABTS and 20 μL H2O2 (15‰, v/v) were added. UV-Vis spectra measurement was performed at a wavelength of 415 nm, after the mixture was vortexed to react for 10 min at room temperature.

Control experiments were performed with following combinations: hemin + ABTS + H2O2; MB1 + hemin + ABTS + H2O2; MB1 + aptamer + hemin + ABTS + H2O2. In these experiments, each component was added at the same volumes and concentrations as in the presence of METH. The missing components were replaced by the HEPES buffer to maintain a constant total volume (200 μL).

The biosensor was optimized using two DNAzyme MBs of different lengths, following the same procedure mentioned above. The sequences of the DNAzyme MBs were 5′-AGGGACGGGACGTTCACCCTGAGACCATCCGACCCAATGTGGAGGGT-3′ (MB2), and 5′-AGGGACGGGCACCCTGAGACCATCCGACGTGGAGGGT-3′ (MB3).

Detection of MEHT in aqueous solutions

MB3 was used in the biosensor for further experiments. The sensitivity and linearity of the biosensor to detect METH were examined with the procedure mentioned above, at following final METH concentrations: 0, 0.50, 1.00, 2.00, 4.00, 6.00, 8.00, 10.00, 20.00, 40.00, 60.00, 80.00, 100.00, 200.00, 500.00, 1000 nM.

Possible interference by other illicit drugs

Selectivity of the biosensor was examined using 15 common illicit drugs and metabolites, namely, ketamine (KET), norketamine (NK), morphine (MOR), methadone (MTD), cocaine (COC), mephedrone (MEP), cathinone (CAT), methcathinone (MCAT), 3-trifluoromethylphenylpiperazine (BZP), 1-(3-trifluoromethylphenyl)piperazine (TFMPP), 3,4-methylenedioxypyrovalerone (MDPV), MDA, MDMA, EDDP, and mCPP. These drugs and metabolites were all purchased from Cerilliant (Round Rock, TX, USA). The experiment procedure was same as above, except that METH was replaced by other illicit drugs or metabolites. A much higher concentration (1 mg L−1) was used for other drugs and metabolites, where as a METH concentration of 15 ng L−1 was used as control.

Analysis of urine samples

To test the feasibility to detect METH in real samples, METH concentrations in urines were determined using the biosensor. Five urine samples of METH addicts were provided by a rehabilitation center. The study was carried out in accordance with a protocol approved by the ethics committee of Peking University and with informed consent of the addicts. The urine samples were filtered using 0.22 μm syringe filters. An aliquot of 20 μL of each samples were used for detection, following the procedure mentioned above. The measured concentrations were compared with those determined using high performance liquid chromatography-tandem mass spectrometer (HPLC-MS/MS). The HPLC-MS/MS used a UFLCXR-LC system (Shimadzu, Japan) with a Phenomenex Gemini C18 column (100 mm × 2 mm, 3 μm) and an ABI 4000 triple quadrupole mass spectrometer (AB SCIEX, USA). To examine the recovery of METH, an additional urine sample of an addict was spiked with three concentrations (50, 100, and 200 ng L−1). The METH concentrations in spiked samples were then determined using the biosensor.

Results and discussion

Confirmation of biosensor mechanism

In the control experiment using ABTS, hemin, and H2O2 only, an absolute absorbance intensity of 0.35 was observed. When MB1 was added to the system, the absorbance intensity increased dramatically (Fig. 1, MB). This is because of the formation of the G-quadruplex–hemin complex that has peroxidase activity and that catalyzes ABTS oxidation by H2O2 to produce ABTS˙+. The formation of ABTS˙+ lead to an increase in absorbance signal at 415 nm.31,33,34 When METH aptamer was further added to the system, the absorbance was drastically reduced (Fig. 1, MB + Apt). The signal was only slightly higher than that of the system of ABTS, hemin, and H2O2 only. The decrease in absorbance in the presence of METH aptamer is due to binding between MB1 and METH aptamer following the base pair matching principle to form dsDNA. The dsDNA is catalytically inactive, preventing the formation of G-quadruplex–hemin complex and conversion of ABTS into ABTS˙+. Finally, when METH was added to the system, absorbance was recovered to about 82% of the intensity observed in presence of MB1 and absence of METH aptamer (Fig. 1, MB + Apt + METH). The recovery in absorbance confirms the preferable binding of METH and the aptamer, which leads to dissociation of dsDNA, formation of G-quadruplex–hemin complex, and conversion of ABTS into ABTS˙+. These results indicate that designed mechanism is effective to detect METH.

Optimal biosensor

The length of DNAzyme MB, i.e. the number of base pairs, has a great influence on its catalytic activity as a result of its effects on the formation of G-quadruplex structure and its decisive role in the stability of dsDNA formed with the METH aptamer. Excessive base pairs would hinder the dissociation of METH aptamer from the dsDNA in the presence of METH, whereas insufficient base pairs could prevent the DNAzyme MB from forming the G-quadruplex–hemin complex. All the three DNAzyme MBs could increase the absorbance in the absence of METH and METH aptamer (Fig. 2). MB2 had the maximal signal intensity, which means the length of MB2 was optimal for formation of the G-quadruplex structure. Yet the dissociation of METH aptamer from the dsDNA must be considered as well. In the presence of METH aptamer and METH, MB3 showed the greatest signal intensity (Fig. 3), indicating that fewer base pairs could facilitate dissociation of METH aptamer and formation of METH–aptamer complex. Thus MB3 was chosen to construct the optimal biosensor which was used for all further experiments.
image file: c6ra04912e-f2.tif
Fig. 2 Effect of DNAzyme MB length on the absorbance at 415 nm for the analysis in the absence of METH. The reaction systems contain 1 μM DNAzyme MB with different lengths and 1 μM METH aptamer without METH.

image file: c6ra04912e-f3.tif
Fig. 3 Effect of DNAzyme MB length on the absorption at 415 nm for the analysis in the presence of METH. The reaction systems contain 1 μM DNAzyme MB with different lengths and 1 μM METH aptamer in the presence of METH.

Sensitivity and linearity of METH detection

As shown in Fig. 4A, the signal intensity was dependent on the concentration of METH over a range of 0–1000 nM when the concentrations of MB3 and METH aptamer were set at 1 μM. The limit of detection (LOD) of the biosensor was calculated to be 0.5 nM (3 times standard deviation rule). The insert of Fig. 4A shows that the signal intensity at 415 nm displayed an excellent linearity with the METH concentration ranging from 8 nM to 500 nM (R2 = 0.991). In addition, the logarithmic concentration also exhibited a linear relationship with the corresponding absorbance signal intensity (R2 = 0.983) in a METH concentration range from 0.5 nM to 200 nM (figure not shown). Furthermore, compared with the blank (METH concentration = 0), color changes were visible even with the bare eyes at METH concentrations of 0.50 nM and above (Fig. 4B).
image file: c6ra04912e-f4.tif
Fig. 4 (A) Absorbance at 415 nm from the ABTS oxidation for the analysis of METH at concentrations ranging from 0 to 1000 nM (0, 0.5, 1.0, 2.0, 4.00, 6.0, 8.0, 10.0, 20.0, 40.0, 60.0, 80.0, 100.0, 200.0, 500.0, 1000.0 nM). The inset shows the linear range. (B) Color changes of the G-quadruplex–hemin DNAzyme MB probe in the presence of METH. The METH concentrations in tubes from left to right were: 0 (blank), 0.5 nM, 1.0 nM, 5.0 nM, 10.0 nM, 50.0 nM, 100.0 nM, 200.0 nM, 500.0 nM, and 1000.0 nM.

The detection limit of the biosensor developed here was at least 2 orders of magnitude lower than the previous sensors. For example, Shi et al. developed a biosensor based on METH aptamer and gold nanoparticles and reported a detection limit of 0.82 μM.7 Oghli et al. developed an electrochemical sensor that had a detection limit of 50 nM.35 Furthermore, the detection limit of this assay for METH is much lower than 1000 ng mL−1 (6.7 μM), the threshold of positive methamphetamine detection in urine samples recommended by the National Institute on Drug Abuse of United States.36 Furthermore, the proposed biosensor for METH had higher sensitivity than the limited biosensors and chemical sensors reported in the literature.

Selectivity of the biosensor

In the presence of the 15 illicit drugs or metabolites (at a concentration of 1 mg L−1) other than METH, absorbance signals greater than blank (less than 0.2) were observed (Fig. 5). However, these signals were much lower than that in the presence of METH, despite the fact that METH concentration (15 μg L−1) was much lower.
image file: c6ra04912e-f5.tif
Fig. 5 Selectivity of the G-quadruplex–hemin DNAzyme MB probe for METH. The METH concentration was 15 μg L−1 (100 nM), while the concentration of other illicit drugs was 1000 μg L−1. From left to right: METH, KET, NK, MOR, MTD, COC, MEP, MDMA, CAT, MCAT, BZP, TFMPP, MDPV, MDA, EDDP, m-CPP, and blank.

Furthermore, the enhancement in absorbance signals (relative to the blank) was not statistically significant among other drugs, indicating that interference of these drugs to METH detection was not specific. These results demonstrate that binding affinity of METH to METH–aptamer were much stronger than that to all other illicit drugs, rendering the biosensor with high specificity toward METH.

Detection of METH in urine samples

In order to further investigate the potential application of the newly-designed sensor in the practical samples, the assay was employed to detect METH in urine samples. Average recovery of METH in spiked urine samples ranged from 85.1 and 89.1% (Table 1). The METH concentrations analyzed using our biosensor ranged from 53.9 to 237.4 ng mL−1 (Fig. 6). METH concentrations derived from HPLC-MS/MS fell within the same range. For the particular urine samples, deviations of biosensor-derived concentrations from HPLC-MS/MS-derived concentrations were all less than 8.5%. These results demonstrate the accuracy and validity of the biosensor to detect METH in real samples.
Table 1 Recovery of METH in urines at three spiked METH concentration (50.0, 100.0 and 200.0 μg L−1), respectively
Spiked concentration (μg L−1) The measured concentration of METH (μg L−1) Rate of standard recovery (%)
1 2 3 Average 1 2 3 Average
0 57.7 63.5 58.3 59.8
50 103.2 110.7 99.2 104.4 91.0 94.4 81.8 89.1
100 146.3 151.2 139.8 145.8 88.6 87.7 81.5 86.0
200 235.6 227.6 226.9 230.0 89.0 82.1 84.3 85.1


image file: c6ra04912e-f6.tif
Fig. 6 METH concentrations in human urine samples measured by the G-quadruplex–hemin DNAzyme MB probe (red) and by LC-MS/MS (black).

Conclusion

A simple, cost-effective, and label-free biosensor based on the G-quadruplex–hemin DNAzyme MB was constructed for METH detection. The biosensor had a detection limit of 0.5 nM and a linear range was 8–500 nM. Other common illicit drugs had little interference on the detection of METH. Recoveries of METH in the spiked urine samples were more than 85%. The concentrations of METH in urine samples derived from the biosensor agreed well with the concentration derived from HPLC-MS/MS. The high sensitivity and specificity indicates that the biosensor could be a promising tool for onsite detection of METH. The DNAzyme MB probe may offer a new approach for sensitive and selective detection of a wide spectrum of analytes by changing some bases of MBs and choosing different aptamers.

Acknowledgements

We gratefully acknowledge the support from the Natural Science Foundation of China (NSFC) (No. 41371442 and 41401566).

Notes and references

  1. S. Galanie, K. Thodey, I. J. Trenchard, M. F. Interrante and C. D. Smolke, Science, 2015, 349, 1095–1100 CrossRef CAS PubMed .
  2. P. Du, K. Li, J. Li, Z. Xu, X. Fu, J. Yang, H. Zhang and X. Li, Water Res., 2015, 84, 76–84 CrossRef CAS PubMed .
  3. B. Subedi and K. Kannan, Environ. Sci. Technol., 2014, 48, 6661–6670 CrossRef CAS PubMed .
  4. United Nations Office of Drugs and Crime, World Drug Report 2015, 2015 Search PubMed .
  5. S. E. Stephans, T. S. Whittingham, A. J. Douglas, W. D. Lust and B. K. Yamamoto, J. Neurochem., 1998, 71, 613–621 CrossRef CAS PubMed .
  6. R. B. Rothman, M. H. Baumann, C. M. Dersch, D. V. Romero, K. C. Rice, F. I. Carroll and J. S. Partilla, Synapse, 2001, 39, 32–41 CrossRef CAS PubMed .
  7. Q. Shi, Y. Shi, Y. Pan, Z. Yue, H. Zhang and C. Yi, Microchim. Acta, 2015, 182, 505–511 CrossRef CAS .
  8. I. Koide, O. Noguchi, K. Okada, A. Yokoyama, H. Oda, S. Yamamoto and H. Kataoka, J. Chromatogr. B: Biomed. Sci. Appl., 1998, 707, 99–104 CrossRef CAS .
  9. K. Okajima, A. Namera, M. Yashiki, I. Tsukue and T. Kojima, Forensic Sci. Int., 2001, 116, 15–22 CrossRef CAS PubMed .
  10. M. L. Ochoa and P. B. Harrington, Anal. Chem., 2004, 76, 985–991 CrossRef CAS PubMed .
  11. S. Muramoto, T. P. Forbes, A. C. V. Asten and G. Gillen, Anal. Chem., 2015, 87(10), 5444–5450 CrossRef CAS PubMed .
  12. Z. Han, H. Liu, J. Meng, L. Yang, J. Liu and J. Liu, Anal. Chem., 2015, 87, 9500–9506 CrossRef CAS PubMed .
  13. C. Andreou, M. R. Hoonejani, M. R. Barmi, M. Moskovits and C. D. Meinhart, ACS Nano, 2013, 7, 7157–7164 CrossRef CAS PubMed .
  14. Z. Yang, M. A. D'Auriac, S. Goggins, B. Kasprzyk-Hordern, K. V. Thomas, C. G. Frost and P. Estrela, Environ. Sci. Technol., 2015, 49(9), 5609–5617 CrossRef CAS PubMed .
  15. R. D. L. Rica and M. M. Stevens, Nat. Nanotechnol., 2012, 7, 821–824 CrossRef PubMed .
  16. Z. Yang, B. Kasprzyk-Hordern, C. G. Frost, P. Estrela and K. V. Thomas, Environ. Sci. Technol., 2015, 49, 5845–5846 CrossRef CAS PubMed .
  17. K. Mao, Z. Wu, Y. Chen, X. Zhou, A. Shen and J. Hu, Talanta, 2015, 132, 658–663 CrossRef CAS PubMed .
  18. Y. Song, X. Yang, Z. Li, Y. Zhao and A. Fan, Biosens. Bioelectron., 2013, 51, 232–237 CrossRef PubMed .
  19. D. Roncancio, H. Yu, X. Xu, S. Wu, R. Liu, J. Debord, X. Lou and Y. Xiao, Anal. Chem., 2014, 86, 11100–11106 CrossRef CAS PubMed .
  20. K. Mao, Y. Liu, H. Xiao, Y. Chen, Z. Wu, X. Zhou, A. Shen and J. Hu, Anal. Methods, 2014, 7, 40–44 RSC .
  21. A. B. Iliuk, L. Hu and W. A. Tao, Anal. Chem., 2011, 83, 4440–4452 CrossRef CAS PubMed .
  22. Z. Wu, Y. Liu, X. Zhou, A. Shen and J. Hu, Biosens. Bioelectron., 2013, 44, 10–15 CrossRef CAS PubMed .
  23. K. Saha, S. S. Agasti, C. Kim, X. Li and V. M. Rotello, Chem. Rev., 2012, 112, 2739–2779 CrossRef CAS PubMed .
  24. P. D. Howes, R. Chandrawati and M. M. Stevens, Science, 2014, 346(6205), 1247390 CrossRef PubMed .
  25. X. H. Zhao, R. M. Kong, X. B. Zhang, H. M. Meng, W. N. Liu, W. Tan, G. L. Shen and R. Q. Yu, Anal. Chem., 2011, 83, 5062–5066 CrossRef CAS PubMed .
  26. W. L. Ward, K. Plakos and V. J. DeRose, Chem. Rev., 2014, 114, 4318–4342 CrossRef CAS PubMed .
  27. F. Wang, C.-H. Lu and I. Willner, Chem. Rev., 2014, 114, 2881–2941 CrossRef CAS PubMed .
  28. C. W. S. Chan and L. M. Khachigian, Intern. Med. J., 2009, 39, 249–251 CrossRef CAS PubMed .
  29. A. M. Rojas, P. A. Gonzalez, E. Antipov and A. M. Klibanov, Biotechnol. Lett., 2007, 29, 227–232 CrossRef CAS PubMed .
  30. R. Fu, T. Li, S. S. Lee and H. G. Park, Anal. Chem., 2011, 83, 494–500 CrossRef CAS PubMed .
  31. D. W. Zhang, J. Nie, F. T. Zhang, L. Xu, Y. L. Zhou and X. X. Zhang, Anal. Chem., 2013, 85, 9378–9382 CrossRef CAS PubMed .
  32. T. Li, E. Wang and S. Dong, J. Am. Chem. Soc., 2009, 131, 15082–15083 CrossRef CAS PubMed .
  33. J. Elbaz, B. Shlyahovsky and I. Willner, Chem. Commun., 2008, 13, 1569–1571 RSC .
  34. Y. Lee, R. Kissner and U. V. Gunten, Environ. Sci. Technol., 2014, 48, 5154–5162 CrossRef CAS PubMed .
  35. A. H. Oghli, E. Alipour and M. Asadzadeh, RSC Adv., 2015, 5, 9674–9682 RSC .
  36. Urine Testing for Drugs of Abuse, NIDA Research Monograph 1986, 73.

This journal is © The Royal Society of Chemistry 2016
Click here to see how this site uses Cookies. View our privacy policy here.