Catalytic conversion of glucose into alkanediols over nickel-based catalysts: a mechanism study

Zhichao Tanab, Gai Miaoa, Chang Liua, Hu Luoa, Liwei Baoab, Lingzhao Kong*a and Yuhan Sun*ac
aCAS Key Laboratory of Low-Carbon Conversion Science and Engineering, Shanghai Advanced Research Institute, Chinese Academy of Sciences, Shanghai 201210, PR China. E-mail: konglz@sari.ac.cn; sunyh@sari.ac.cn
bUniversity of Chinese Academy of Sciences, Beijing 100049, PR China
cSchool of Physical Science and Technology, Shanghai-Tech University, Shanghai 201210, PR China

Received 7th June 2016 , Accepted 21st June 2016

First published on 22nd June 2016


Abstract

The conversion of isotope-labeled glucose (D-1-13C-glucose) into alkanediols was carried out in a batch reactor over a Ni–MgO–ZnO catalyst to reveal the C–C cleavage mechanisms. The unique role of the MgO–ZnO support was highlighted by 13C NMR and GC-MS analysis qualitatively and the MgO–ZnO favored isomerization of glucose to fructose. 13C NMR, GC-MS and HPLC analysis demonstrated that the C1 position of ethylene glycol, the C1 and C3 positions of 1,2-propanediol and the C1 position of glycerin were labeled with 13C, which is attributed to a C–C cleavage at D-1-13C-glucose's corresponding positions through retro-aldol condensation. A hydrogenolysis followed by hydrogenation pathway was proposed for glucose converted into alkanediols at 493 K with 6.0 MPa of H2 pressure over Ni based catalysts.

Introduction

The utilization of fossil fuel resources for transportation and as a contributor to the world's economy is unquestionable, but they also contribute to serious environmental problems. A global energy shortage and environmental pollution problems push us to find renewable energy sources for the production of liquid biofuels or value-added chemicals.1 As a promising large-scale substitution for fossil fuel resources, chemicals and fuels from biomass have other advantages, such as extensive raw material sources, zero-CO2 emission and renewability.2 Among various conversion processes of biomass, catalytic hydrogenation to 1,2-propylene glycol (1,2-PDO) and ethylene glycol (EG) has attracted increasing attention due to their important role in the synthesis of value-added compounds which have a large market demand.3 1,2-PDO is used as a chemical feedstock for the preparation of unsaturated polyester resins and EG is primarily used as a raw material in the manufacture of polyester fibers and antifreeze formulations.

At present, for the conversion of sugars or biomass to diols, the current research has been focused on looking for more efficient and low-cost catalysts and improving the conversion and selectivity of the reactions, but less attention has been paid to the fundamental understanding and mechanism of the process. Among the available literature, Zhang Tao,4–7 Liu,8 Mu9 and Miao10 et al. have indicated that a retro-aldol reaction is the main pathway during the decomposition of glucose to diols. A one-pot conversion of cellulose to EG on a Ni-promoted tungsten carbide catalyst was conducted by Zhang et al. in 2008.4 A series of tungsten based catalysts were developed to enhance the EG yield to 75%. When using miscanthus, a complex biomass, it was found that a base solvent pretreatment can alleviate catalyst poisoning in the process.7 Liu8 deemed that WO3 crystallites are efficient at accelerating the hydrolysis of cellulose to sugar intermediates and selective cleavage of C–C bonds in the sugar occurs with Ru/C catalysts. Considering the high cost of tungsten and Ru catalysts, Mu9 et al. reported the hydrogenation of cellulose to 1,2-alkanediols over Ni-supported catalysts and the total yield of alkanediols reached up to 70.4%. Without any biomass pretreatment, Miao10 et al. achieved a direct conversion of microalgae into 1,2-PDO and EG in water over a Ni–MgO–ZnO catalyst and the total yield of polyols was up to 41.5%. Researchers4–10 have generally believed that there are several possible pathways for the catalysis of glucose to alkanediols. One of the pathways is from glucose to glycolaldehyde or from fructose, which occurred from isomerization of glucose, to 1,3-dihydroxyacetone via a retro-aldol reaction, followed by the production of EG and 1,2-PDO by hydrogenation. On the other hand, the glucose was transformed into levoglucosan through dehydration,11 and then the levoglucosan underwent cleavage of the C–C bonds and was converted into a precursor of acetol. As formation of sorbitol was detected in the reaction solution, the production of diols from the cleavage of C–C bonds after a hydrogenation process was proved.

So, catalytic conversion of sugars and sugar alcohols into polyols has been investigated in detail to reveal the C–C cleavage mechanisms.12 The retro-aldol reaction mechanisms proposed by Sohounloue13 and Andrews14 indicate that C–C cleavage of the β-hydroxyl carbonyl could generate a ketone and an aldehyde, which is followed by hydrogenation to the alcohols. A retro-Claisen reaction mechanism has been proposed by Montassier et al.15 to explain the formation of formic acid and CO2. They have also come up with a retro-Michael reaction mechanism to explain the formation of xylitol and sorbitol, where the bond cleavage precursor is a δ-dicarbonyl.15 However, Hawley16 considered that the C–C cleavage occurs through a retro-aldol reaction, because a monocarbonyl, the precursor of the retro-aldol reaction, is more likely formed than a dicarbonyl, the precursor of the retro-Claisen and retro-Michael reactions. They used 1,3-diols as model compounds to provide further evidence against the retro-Claisen being the mechanism pattern. Kabyemela17–21 proved that the decomposition products of glucose or fructose were similar in subcritical and supercritical water, except that fructose epimerization to glucose was negligibly low. The intermediate products, glyceraldehyde, dihydroxyacetone, dihydroxyacetone, pyruvaldehyde, glyceraldehyde and pyruvaldehyde, were formed from C–C bond cleavage. The mechanism could be explained using a reverse aldol condensation and the double-bond rule of the respective enediols formed during the Lobry de Bruyn Alberda van Ekenstein transformation.

To obtain the specific pathway of C–C bond breakage through reverse aldol condensation from glucose, more effective methods should be used. Herein, we investigate the conversion of glucose and D-1-13C-glucose using a MgO–ZnO support and Ni–MgO–ZnO catalyst, since it displayed excellent catalytic activity for microalgae hydrogenolysis in our previous study.10 The reaction mechanism was investigated through 13C nuclear magnetic resonance (NMR) analysis using isotopically labeled glucose at the C1 position (D-1-13C-glucose) and this was assisted with GC-MS and HPLC analysis. Then, the C–C cleavage pathway and the formation of EG and 1,2-PDO were elucidated using the 13C NMR results and the model compound experiments. Furthermore, another proposed pathway was put forward using the product distributions for the glucose conversion over MgO–ZnO and Ni–MgO–ZnO.

Materials and methods

Materials

D-1-13C-Glucose and deuterium oxide were purchased from Cambridge Isotope Laboratories, Inc. The other chemicals were purchased from Sinopharm Chemical Reagent Co., Ltd. All were used without further purification.

Catalyst preparation and characterization

The Ni–MgO–ZnO catalyst was prepared using a co-precipitation method10 with an aqueous solution of Na2CO3 added dropwise to a solution of nickel nitrate, magnesium nitrate and zinc nitrate under vigorous stirring at 343 K. The resulting material was then aged, under continuous stirring at the same temperature for 3–4 h. After vacuum filtration and calcination at 672 K for 4 h, the synthesized catalyst was reduced at 673 K for 5 h under a H2 flow of 60 mL min−1. For the MgO–ZnO catalyst, an aqueous solution of Na2CO3 was added dropwise to a solution of magnesium nitrate and zinc nitrate under vigorous stirring at 343 K, and then the resulting material underwent calcination after being aged under the same conditions. The BET surface area of Ni–MgO–ZnO was 39.8 m2 g−1, and the calculated particle size of the nickel on MgO–ZnO using the Scherrer equation was 7.32 nm. The Ni dispersion on MgO–ZnO obtained from a difference calculation through CO-chemisorption characterization was 1.25%.10

Catalytic experiments and product analysis

The hydrogenation of glucose was carried out in a stainless steel autoclave (Parr Instrument Company, 50 mL) with an initial H2 pressure of 6 MPa at 493 K for 15–180 min. Typically, a mixture of glucose, the catalyst and deionized water was placed into the autoclave and stirred at a speed of 600 rpm. After the reaction, the autoclave was cooled using cold water, and the liquid solution was separated from the solid mixture by centrifugation.

The collected liquid solution was filtered through 0.22 μm-pore-size filters prior to analysis. The main products in the resultant solution were identified based on standard compounds and the structures of them were further confirmed using GC-MS (Agilent 7890 GC and Agilent 5975C inert MSD, HP-INNOWax column: 30 m × 0.25 mm; film thickness, 0.25 μm). These products were also quantified using HPLC (Shimadzu LC-20AD, Aminex HPX-87H Ion Exclusion Column: 300 mm × 7.8 mm) with a differential refraction detector (RID-10A). The targeted polyols (EG and 1,2-PDO) were determined quantitatively using HPLC, based on calibration curves of the standard compounds.

The conversion of glucose was calculated by measuring the moles of glucose before and after the reaction: conversion = (moles of glucose left in the reaction solution)/(moles of initial glucose) × 100%. The yield of polyols was calculated based on the amount of carbon via the equation: yield = (moles of carbon in the products)/(moles of carbon in the initial glucose) × 100%. According to the GC analysis for the gas products, the main component in the gas phase was H2 and trace CO, CO2 and CH4 were detected, so the yields of the gas products were not quantified in this work.

13C NMR experiments were performed using an Agilent 500 (125 MHz) spectrometer with a mixture of the sample in D2O. Because the natural abundance of 13C is 1.1%, the 13C NMR signal resonances of 13C atoms are considerably higher than for 12C atoms in the reaction product when using 1-13C-glucose as the substrate, with the same analytical conditions of scanning time, solvent and concentration (an equal mass of the reactants underwent a catalyzed hydrogenation reaction, then the liquid phase of the product was evaporated using a vacuum-rotary evaporation procedure to remove the water. Eventually the experiments were conducted in D2O).

Results and discussion

D-1-13C-Glucose conversion over the MgO–ZnO support

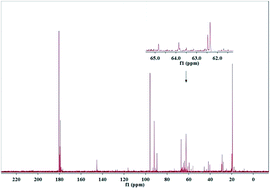
On the basis of the retro-aldol condensation reaction put forward before, we supposed that glucose would generate the precursor of the products via this mechanism. In the blank test shown in Fig. 1, hydrothermal conversion of 1-13C-glucose without a catalyst, the resonance signals of 1-13C-β-D-pyranofructose and 1-13C-β-D-fructofuranose at δ 63.8 and δ 62.6 (Fig. S1 to S3) were very low, which is ascribed to low conversion of glucose to fructose without MgO–ZnO. A series of experiments was designed to investigate the function of the MgO–ZnO support at temperatures of 373 K, 423 K and 493 K. The isomerization mechanism of glucose to fructose was confirmed from 13C NMR using isotopically labeled glucose at the C1 position (D-1-13C-glucose) as the substrate. The GC-MS analysis results are shown in Table 1.
image file: c6ra14738k-f1.tif
Fig. 1 13C NMR results of 1-13C-glucose without a catalyst at 493 K (blank test). Reaction conditions: 493 K, 6 MPa of H2, 600 rpm. Reaction time: 3 h.
Table 1 GC-MS analysis results of glucose conversion with MgO–ZnO at 373 K, 423 K and 493 K
373 K 423 K 493 K
Component Area/% Component Area/% Component Area/%
Acetol 28.3 Acetol 60.7 1,2-PDO 25.0
Glycolaldehyde 25.3 Acetic acid 20.7 Acetol 24.2
1,2-PDO 8.6 Formic acid 7.1 Acetic acid 11.8
1,3-Dihydroxyacetone 6.6 Others 11.5 Ethanol 10.2
Glycerol 4.7     Pentanal 6.9
Others 26.5     Others 17.8


On the basis of the 13C NMR data in Fig. 2b, the resonance signals from δ 60.5 ppm to δ 101.4 ppm represent the chemical shifts of a glucopyranose and fructofuranose mixture (Fig. S1 and S3).22 In Fig. 2a, δ 95.8 and δ 92.1 are the β-C1 and α-C1 shifts of glucopyranose, respectively (Fig. S2). The resonance signals at δ 63.8 and δ 62.6 represent 1-13C-β-D-pyranofructose and 1-13C-β-D-fructofuranose (Fig. S3), indicating isomerization of glucose to fructose. As the intermediate products for the hydrogenation of glucose to EG and 1,2-PDO, the detected glycolaldehyde and acetol indicate that the reaction can proceed at 373 K.


image file: c6ra14738k-f2.tif
Fig. 2 13C NMR results of 1-13C-glucose (a) and glucose (b) conversions with MgO–ZnO at 373 K. Reaction conditions: 373 K, 6 MPa of H2, 600 rpm. Reaction time: 3 h.

When the glucose and the C1 isotopically labeled glucose react at 423 K, the sugars convert gradually. At 493 K, 1,2-PDO, acetol and acetic acid are the main products as seen in Table 1. The resonance signals at δ 66.5, 67.8 and 17.9 ppm are the C1, C2 and C3 position signals of 1,2-PDO, and δ 67.5, 212 and 24.8 ppm are the C1, C2 and C3 position chemical shift values of acetol (Fig. 4). The results show the formation of acetol, which occurs after the isomerization of glucose to β-D-pyranofructose; pyranofructose could convert into acetol, catalyzed by MgO–ZnO, via a retro-aldol condensation and cleavage of the C3–C4 position. MgO–ZnO cannot catalyze the hydrogenation reaction of acetol completely, so the 1,2-PDO in the liquid phase may be produced from hydrogen transfer reactions. The new resonance signal at δ 19.7 ppm displayed in Fig. 3 corresponds to 2-13C-acetic acid,23 meanwhile the GC-MS analysis (Table 1) further confirmed this result, and it is probably generated from glycolaldehyde.17,18,20


image file: c6ra14738k-f3.tif
Fig. 3 13C NMR results of a 1-13C-glucose conversion with MgO–ZnO at 423 K. Reaction conditions: 423 K, 6 MPa of H2, 600 rpm. Reaction time: 3 h.

From the intermediate products of the glucose conversion to alkanediols with MgO–ZnO, glucose can convert into glycolaldehyde, catalyzed by MgO–ZnO, via a retro-aldol condensation and cleavage of the C2–C3 position. Through analyzing the experimental results (Fig. 2 to 4 and Table 1) and comparing them to similar processes, a reaction pathway for the conversion of glucose over the MgO–ZnO support was proposed and is summarized in Scheme 3.


image file: c6ra14738k-f4.tif
Fig. 4 13C NMR results of a 1-13C-glucose conversion with MgO–ZnO at 493 K. Reaction conditions: 493 K, 6 MPa of H2, 600 rpm. Reaction time: 3 h.

The unique role of MgO–ZnO was proved through relevant experiments, which stimulated the isomerization of glucose to fructose. The reason is probably that the ZnO had both acidic and basic sites on its surface,9 and the basicity of ZnO would promote the isomerization of glucose to fructose.

D-1-13C-Glucose hydrogenation over the Ni–MgO–ZnO catalyst

The hydrothermal hydrogenation of glucose to polyols over the Ni–MgO–ZnO catalyst was investigated at 493 K with 6 MPa of H2. According to the blank test (Fig. 1), glucose cannot convert into diols under the no-catalyst conditions at 493 K. Fig. 5 illustrates the 13C NMR analysis of the 1-13C-glucose and glucose conversion products from reaction over Ni–MgO–ZnO at 493 K. The results indicated that both the C1 and C3 position of 1,2-PDO are 13C labeled, owing to the high intensity signals at 17.9 and 66.5 ppm (Fig. S4). The C1 position signals of EG and glycerin occur at 62.46 and 62.42 ppm respectively (Fig. S5 and S6), which are present as the highest peaks in Fig. 5a. For the peaks of C2 for 1,2-PDO and glycerin, the resonance signals at 67.86 ppm and 71.99 ppm are substantial in Fig. 5b but insignificant in Fig. 5a, meaning that these positions in the liquid product are not 13C labeled. It can be explained that glucose undergoes a retro-aldol condensation reaction generating glycolaldehyde (GA, the precursor of EG) so that the C1 position of EG is 13C labeled. Meanwhile, after the isomerization of glucose to fructose, fructose generates 1,3-dihydroxyacetone and a glycerin precursor via a retro-aldol condensation reaction, leading to the corresponding products 1,2-PDO and glycerin. Consequently, the C1 and C3 positions of 1,2-PDO and the C1 of glycerin are 13C labeled.
image file: c6ra14738k-f5.tif
Fig. 5 13C NMR analysis of 1-13C-glucose (a) and glucose (b) conversion with Ni–MgO–ZnO at 493 K. Reaction conditions: 493 K, 6 MPa of H2, 600 rpm. Reaction time: 3 h.

The intermediate compounds dihydroxyacetone and glycolaldehyde were selected as the model compounds to investigate the pathway to the diols. As shown in Fig. 7, the main products were 1,2-PDO and glycerin for the hydrogenation process, and the side products were lactic acid, EG and acetic acid. This implied that there were no further aldol condensation reactions taking place (Scheme 1). At 493 K, the conversion of glycolaldehyde, catalyzed by Ni–MgO–ZnO, was 100%. According to the GC-MS and HPLC qualitative analysis, the main components were glucose, erythritol, levoglucosan, glycerol, 1,2-PDO and 1,2-butanediol (1,2-BDO) and the yields for each component are shown in Fig. 7a.


image file: c6ra14738k-f6.tif
Fig. 6 Main product distribution for a glucose conversion with Ni–MgO–ZnO at 493 K.

image file: c6ra14738k-f7.tif
Fig. 7 Main product distributions for glycolaldehyde (a) and dihydroxyacetone (b) conversions with Ni–MgO–ZnO at 493 K. Reaction conditions: 493 K, 6 MPa of H2, 600 rpm, 3 h.

image file: c6ra14738k-s1.tif
Scheme 1 Proposed pathway for the conversion of dihydroxyacetone over Ni–MgO–ZnO.

On using glycolaldehyde as the reactant, erythritol and 1,2-BDO were found and this proved that two glycolaldehyde molecules could condense and hydrogenate. The generation of glucose and levoglucosan shows that the four carbon alcohols and GA take part in another aldol condensation reaction. At the same time, the presence of a certain amount of 1,2-PDO and glycerin confirmed that the formed glucose could decompose via isomerization and retro-aldol condensation.

Besides, it was also found that a certain amount of 1,2-BDO with 13C labels is generated in the reaction solution, from which it is assumed that two glycolaldehyde molecules formed 1,2-BDO through an aldol condensation reaction. Glucose undergoes a retro-aldol condensation reaction generating EG and erythritol. Then, erythritol undergoes another retro-aldol condensation reaction generating two molecules of EG, which are not 13C labeled. As is well known, the aldol condensation reaction is reversible, therefore a small amount of EG will produce 1,2-BDO via an aldol condensation reaction.

The experimental results verified that 1,2-BDO could be generated from an aldol condensation reaction of glycolaldehyde, and that glucose and levoglucosan could be formed by two condensation reactions of glycolaldehyde (shown in Scheme 2).


image file: c6ra14738k-s2.tif
Scheme 2 Proposed pathway for the conversion of glycolaldehyde over Ni–MgO–ZnO.

Using Fig. 5b, a set of resonance signals at δ 65.3, 73.3, 25.3 and 9.1 ppm were assigned to the chemical shifts of 1,2-BDO (Fig. S7). In Fig. 5a, the new signal at δ 65.2 ppm reveals the C1 position of 1,2-BDO which is 13C labeled. It is to be noted that the amount of 1,2-BDO was low in the liquid products as shown in Fig. 5b and 6. This phenomenon is accounted for by another retro-aldol condensation reaction and aldol condensation reaction. Firstly, glucose generates glycolaldehyde and trihydroxy-butyraldehyde via a retro-aldol condensation reaction. The trihydroxy-butyraldehyde then generates two glycolaldehyde molecules by retro-aldol condensation. A 1-13C-glycolaldehyde and a glycolaldehyde probably react to form 1,2-BDO via aldol condensation or they proceed through further hydrogenation processes. Because a large proportion of the glycolaldehyde is hydrogenated to EG, the content of 1,2-BDO is much less than that of EG, 1,2-PDO and glycerin, as shown in Fig. 5b and 6.

Characterization of the pathways for glucose conversion over Ni–Mgo–ZnO catalysts

From the above results, it can be seen that glucose is converted to diols via retro-aldol condensations, where glycolaldehyde and dihydroxyacetone act as the main intermediates. To investigate the product distribution in relation to reaction time with the Ni–MgO–ZnO catalyst, a series of experiments was conducted using reaction times of 0.25 h, 0.5 h, 1 h, 1.5 h and 5 h at 493 K with 6 MPa H2 and the results are shown in Fig. 8.
image file: c6ra14738k-f8.tif
Fig. 8 Product distributions for glucose conversion over the Ni–MgO–ZnO catalyst. (■) Sorbitol, (●) xylitol, (▲) erythritol, (▼) glycerol, (◀) EG, (▶) 1,2-PDO, (◆) 1,2-BDO, and (★) glucose conversion. Reaction conditions: 493 K, 6 MPa of H2, 600 rpm.

As shown in Fig. 8, the glucose can be efficiently converted even in a short reaction time, and the glucose conversion was up to 97.8% after 0.25 h. Prolonging the reaction time to 1 h, almost no glucose was detected in the reaction solution, and its conversion reached up to 99.7%. After 1.5 h, glucose could not be detected.

It can be seen from Fig. 8 that glucose is very easily transformed into four to six carbon sugar alcohols, because the sugar alcohol content increased obviously within 0.25 h. As the hydrogenation progressed, the sugar alcohol content gradually reduced to a negligible amount at the end of the reaction. 1,2-PDO, EG and glycerin are the main products and the yields reach 31.6%, 13.8% and 17.2% respectively. This is well illustrated in Fig. 8. However, when the reaction time is 0.25 h, the main components are sorbitol, xylitol and erythritol, which are generated from glucose. This means that in the presence of the nickel metal, glucose could be hydrogenated into sorbitol directly at the beginning. However, as the reaction progressed, large amounts of 1,2-PDO, EG and glycerin, the products from conversion of sorbitol24 and xylitol, were obtained.25–27 Sorbitol undergoes dehydrogenation to glucose, furthermore generating EG and 1,2-PDO, and xylitol undergoes dehydrogenation to the corresponding aldehyde, which then produces glycolaldehyde and dihydroxyacetone via a retro aldol condensation reaction.25 Conversion experiments for sorbitol and xylitol were performed over the Ni–ZnO–MgO catalyst under the same conditions, and the diols' yields were similar to those from glucose. Sorbitol and xylitol are the intermediates when catalytically converting a portion of glucose into alkanediols. Based on the above results, it can be concluded that the catalytic process of converting glucose into alkanediols is hydrogenolysis followed by hydrogenation pathways (Scheme 3).


image file: c6ra14738k-s3.tif
Scheme 3 Proposed pathways for the conversion of glucose over the MgO–ZnO support and Ni–MgO–ZnO catalyst.

Conclusions

In summary, the mechanism of glucose conversion to alkanediols over a Ni–MgO–ZnO catalyst was investigated using isotope-labeled glucose as the feedstock. Through chemical shift value assignments and major component analysis, the investigation provided evidence for the C–C cleavage positions of the retro-aldol condensation in such a process, and the C1 position of ethylene glycol, the C1 and C3 positions of 1,2-propanediol and the C1 position of glycerin were labeled with 13C from the D-1-13C-glucose conversion. At 493 K with 6.0 MPa of H2 pressure using the Ni–MgO–ZnO catalyst, the mechanism for catalytic hydrogenation of glucose to form alkanediols was deemed as hydrogenolysis followed by hydrogenation processes.

Acknowledgements

Authors acknowledge financial support provided by the National Natural Science Foundation of China (21406255) and the Youth Innovation Promotion Association CAS. The authors appreciate Dr Shengyang Wang for NMR analysis.

References

  1. C. Somerville, H. Youngs, C. Taylor, S. C. Davis and S. P. Long, Science, 2010, 329, 790 CrossRef CAS PubMed.
  2. M. J. Climent, A. Corma and S. Iborra, Green Chem., 2014, 16, 516 RSC.
  3. H. Yue, Y. Zhao, X. Ma and J. Gong, Chem. Soc. Rev., 2012, 41, 4089 RSC.
  4. N. Ji, T. Zhang, M. Zheng, A. Wang, H. Wang, X. Wang and J. G. Chen, Angew. Chem., Int. Ed., 2008, 47, 8510 CrossRef CAS PubMed.
  5. Y. Zhang, A. Wang and T. Zhang, Chem. Commun., 2010, 46, 862 RSC.
  6. A. Wang and T. Zhang, Acc. Chem. Res., 2013, 46, 1377 CrossRef CAS PubMed.
  7. J. Pang, M. Zheng, A. Wang, R. Sun, H. Wang, Y. Jiang and T. Zhang, AIChE J., 2014, 60, 2254 CrossRef CAS.
  8. Y. Liu, C. Luo and H. Liu, Angew. Chem., Int. Ed., 2012, 51, 3249 CrossRef CAS PubMed.
  9. X. Wang, L. Meng, F. Wu, Y. Jiang, L. Wang and X. Mu, Green Chem., 2012, 14, 758 RSC.
  10. G. Miao, C. C. Zhu, J. J. Wang, Z. C. Tan, L. Wang, J. L. Liu, L. Z. Kong and Y. H. Sun, Green Chem., 2015, 17, 2538 RSC.
  11. A. Demirbas, Energy Convers. Manage., 2000, 41, 633 CrossRef CAS.
  12. I. T. Clark, Ind. Eng. Chem., 1958, 50, 1125 CrossRef CAS.
  13. D. K. Sohounloue, C. Montassier and J. Barbier, React. Kinet. Catal. Lett., 1983, 22, 391 CrossRef.
  14. M. A. Andrews and S. A. Klaeren, J. Am. Chem. Soc., 1989, 111, 4131 CrossRef CAS.
  15. C. Montassier, D. Giraud and J. Barbier, Stud. Surf. Sci. Catal., 1988, 41, 165 CrossRef CAS.
  16. K. Wang, M. C. Hawley and T. D. Furney, Ind. Eng. Chem. Res., 1995, 34, 3766 CrossRef CAS.
  17. B. M. Kabyemela, T. Adschiri, R. M. Malaluan and K. Arai, Ind. Eng. Chem. Res., 1999, 38, 2888 CrossRef CAS.
  18. B. M. Kabyemela, T. Adschiri, R. M. Malaluan and K. Arai, Ind. Eng. Chem. Res., 1997, 36, 1552 CrossRef CAS.
  19. B. M. Kabyemela, T. Adschiri, R. M. Malaluan and K. Arai, Ind. Eng. Chem. Res., 1997, 36, 2025 CrossRef CAS.
  20. B. M. Kabyemela, T. Adschiri, R. M. Malaluan and K. Arai, Ind. Eng. Chem. Res., 1997, 36, 5063 CrossRef CAS.
  21. B. M. Kabyemela, M. Takigawa, T. Adschiri, R. M. Malaluan and K. Arai, Ind. Eng. Chem. Res., 1998, 37, 357 CrossRef CAS.
  22. C. R. Zhang, S. A. Aldosari, P. S. P. V. Vidyasaar, K. M. Nair and M. G. Nair, J. Agric. Food Chem., 2013, 61, 5834 CrossRef CAS PubMed.
  23. S. Yoshida, K. Takewaki, K. Miwa, C. Wakai and M. Nakahara, Chem. Lett., 2004, 33, 3 Search PubMed.
  24. X. Wang, X. Liu, Y. Xu, G. Peng, Q. Cao and X. Mu, Chin. J. Catal., 2015, 36, 1614 CrossRef CAS.
  25. J. Sun and H. Liu, Green Chem., 2011, 13, 135 RSC.
  26. J. Sun and H. Liu, Catal. Today, 2014, 234, 75 CrossRef CAS.
  27. X. Chen, X. Wang, S. Yao and X. Mu, Catal. Commun., 2013, 39, 86 CrossRef CAS.

Footnote

Electronic supplementary information (ESI) available. See DOI: 10.1039/c6ra14738k

This journal is © The Royal Society of Chemistry 2016
Click here to see how this site uses Cookies. View our privacy policy here.