Paulo A. Raymundo-Pereira*a,
Alan R. F. Limab and
Sergio A. S. Machadoa
aSão Carlos Institute of Chemistry, University of São Paulo, PO Box 780, 13560-970 São Carlos, SP, Brazil. E-mail: pauloaugustoraymundopereira@gmail.com; Fax: +55 16 33518350; Tel: +55 16 33518098
bInstitute of Chemistry, University of São Paulo, PO Box 26077, 05508-000 São Paulo, SP, Brazil
First published on 31st March 2016
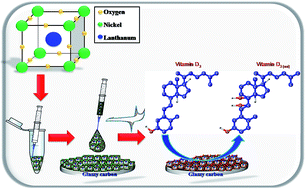
We report the electrocatalytic activity of perovskite-type LaNiO3-nanoxide (LN-NO) on secosteroid hormone oxidation in alkaline solution. LN-NO was synthesized by the Pechini method and calcined at 973 K for 2 h under air atmosphere. Subsequently, the LN-NO material was studied by high-resolution transmission electron microscopy (HR-TEM), energy-dispersive X-ray (EDX), X-ray photoelectron spectroscopy (XPS), X-ray diffractometer (XRD) and electrochemical techniques such as cyclic voltammetry (CV), square wave voltammetry (SWV) and electrochemical impedance spectroscopy (EIS). The Rietveld refinement by the XRD pattern indicated the presence only the LN-NO. Optimized electrocatalytic activity was achieved using the LN-NO architecture, on a label-free platform, and nanostructures with sizes ranging between 50 and 100 nm were well distributed throughout the nanoxide. The detection of the secosteroid was performed at a low potential (0.46 V vs. Ag/AgCl) in a range between 0 and 2.6 × 10⁻⁵ mol L−1, with a detection limit of 8.3 × 10⁻⁷ mol L−1, which is considerably competitive with similar devices. The application of the LN-NO nanostructured label-free platform as a voltammetric sensor showed a good sensitivity of 17.75 A M−1. Finally, the use of LN-NO as a low-cost alternative to carbon nanomaterials (nanotubes and graphene) has the potential to be an excellent approach to sensor development.
Vitamin D deficiency (VDD) has become a worldwide health issue, affecting more than one billion individuals3 with significant consequences for the immunological system, and infectious and cardiovascular diseases.4 Furthermore, it can directly influence the absorption of phosphorus and calcium in the body, and has been associated with symptoms of others diseases such as cancer.5 Due to this hypovitaminosis D, health professionals have recommended the consumption of vitamin D in dietary sources including fatty fishes, eggs, liver and fish liver oils1 and in some cases also in vitamin supplements.6 However, this can lead to another problem: probably due to its slow metabolization in the body, cholecalciferol can be excreted and released into the environment in wastewater.
Cholecalciferol (vitamin D3) is used in baits to control the house mouse, through a hypercalcemia mechanism.7 It is therefore important to develop analytical methodologies for the quantification of cholecalciferol in water. Moreover, cholecalciferol is considered an “Endocrine Disrupter Chemical” (EDC), as are steroids in general, and can be found in superficial and underground waters. Published works show that endocrine disrupters can increase the incidence of testicular, ovarian and breast cancers, reduce fertility by diminishing the number of spermatozoids and promote fish feminization.8–10 Thus, the bioaccumulation of steroids in the environment is a problem that must be addressed. In this context, researchers have been motivated to develop analytical methodologies to identify and quantify these substances in the environment. Currently, the development of methodologies for the remediation, detection and quantification of endocrine disruptors in the environment is an objective for researchers in several fields, especially in clinical and environmental analysis. Three methods are currently used for the determination of vitamin D3: HPLC-MS, radioimmunoassay (RIA) and non-isotopic automated determination.5,11,12 These methods are precise, accurate, free from interference and reliable. However, they are also expensive, time consuming, and require specialized analysts for their operation.
On the other hand, electrochemical methods have a number of advantages, such as their low cost, high sensitivity, and easy operation.5,13 They also have the potential for miniaturization and automation, and are suitable for in-field/on-site monitoring using simple portable devices that generate fast qualitative and quantitative responses.14 They can therefore be proposed as an excellent alternative to classical methods.15
Nowadays only three studies were found in literature: (i) in the study by Canevari15 et al., cholecalciferol was determined with an electrode composed of a hybrid silica/graphene oxide thin film modified with amorphous nickel(II) hydroxide particles; (ii) directly determined using an immunosensor with SPR transduction5 and (iii) the low solubility of cholecalciferol in water requires the use of mixed organic/water solvents for analysis, as reported by Cincotto and co-workers.13 The limited number of publications in this subject indicates the necessity of further work on cholecalciferol electroanalytical determination in order to develop simple methodologies for its quantification.
Specifically, nano-scaled LaNiO3 perovskite-type oxide have received the attention of many researchers due to their excellent physical and chemical properties and their suitability for applications in a variety of fields, such as ferroelectric, high-Tc superconductivity, non-volatile memory effects, magnetic or sensor materials, in catalysis and in optical applications.16–18 The main property of good electrically conducting oxide lead to applicability as electrode material in electronic devices.17
The purpose of this study was to evaluate a new carbon-free nanomaterial composed of a LaNiO3 perovskite-type oxide, synthesized by the Pechini method,19–21 as an advanced electrode modifier for the electroanalytical determination of cholecalciferol using simple, fast, and low-cost voltammetric techniques. Thus, this work outlines the development of an electrochemical sensor based on a LaNiO3 perovskite-type nanoxide coated glassy carbon surface and its application in the identification of cholecalciferol in creek water, demonstrating the accuracy and efficiency of the proposed sensor.
:
1, while the mass ratio of citric acid/ethylene glycol was adjusted to 1
:
4. The volume of the resulting solutions was reduced until a viscous green resin was obtained, which was then heat treated at 353 K for 5 h. The polymeric resin obtained was heat treated at 623 K for 3 h. The obtained precursor powder was calcined at 973 K for 2 h under air atmosphere. These procedures were detailed and outlined and detailed in the flow chart (Scheme S1 – ESI†).
X-ray powder diffraction (XRD) analysis was performed on a Shimadzu XRD-6000 diffractometer equipped with CuKα radiation (λ = 1.54178 Å and graphite monochromator) operating in continuous scan mode at 0.02° min−1. The measurements were collected at room temperature with a scan range between 5° and 90°.
Electrochemical measurements were performed using a model PGSTAT 302 Autolab electrochemical system (Eco Chimie) and controlled by GPES 4.9.7 software. All analyses were conducted in a 25 mL thermostated glass cell at 25 °C, with a three-electrode configuration: a glassy carbon electrode (diameter 3.0 mm) coated with LaNiO3 nanoxide film as the working electrode, an Ag/AgCl (3 mol L−1 KCl) as a reference and a platinum foil (1.0 cm2) as an auxiliary electrode. The solution within the cell was neither stirred nor aerated during the measurements. Electrochemical impedance spectroscopy (EIS) spectra were obtained with a PGSTAT 302 system, controlled by FRA2 software, in the frequency range between 0.1 Hz and 100 kHz with an amplitude of 10 mV and under open circuit potential (OCP) conditions in 1.0 mol L−1 NaOH solution containing 5.0 mmol L−1 of K3[Fe(CN)6]/K4[Fe(CN)6].25
![]() | ||
| Fig. 2 Schematic illustration of the steps involved in the preparation of the surface for detection. | ||
The XRD pattern of LaNiO3 shown in Fig. 4 fitted perfectly with the corresponding perovskite structure (ICSD 33-0711), with no evidence of secondary phases. The sample was refined by the Rietveld method through the GSAS program. The residual pattern shows an excellent fit between the theoretical and observed X-ray pattern (Table S1†), it can be easily seen that there is little variation in the diffraction angle as shown in Fig. 4. The data used for the theoretical model were those available in the ICSD database (Code 173477).26
Surface chemical features in the LaNiO3 nanoxide material were evaluated by X-ray photoelectron spectroscopy (XPS) measurements. The binding energies determined from fitting the spin–orbit components La 3d, Ni 3p, O 1s and C 1s for the main peaks of the XPS spectra are summarized in Table S2.† The O 1s profile is basically constituted by three peaks at 528.7, 531.1 and 532.8 eV, which can be attributed to lattice oxygen O2−, O− (including carbonates or nitrates, and hydroxyl groups (OH−)) and adsorbed H2O compounds, respectively.27–32 Similarly, two peaks are detected in the C 1s zone. The first, at approximately 284.6 eV, can be attributed to surface contamination from atmospheric hydrocarbons while the second at approximately 286.6 eV is common to carbonate species.27,29 Since La-based perovskites are basic materials, they can be easily carbonated or hydrated upon exposure to ambient atmosphere.27,29
The La 3d5/2 core level spectra, taken at normal emission and grazing emission angle can be deconvoluted into two doublets, attributed to oxide and hydroxide groups. The main oxide band is at 833.5 eV binding energy and the satellite band is at 837.7 eV. The main line corresponding to the lanthanum bonding with hydroxyl species lies at 835.5 eV and the satellite band at 838.8 eV.27,29,30,33 Our results are in according to reported in the literature.31 The Ni 3p profile is basically constituted by three peaks at 66.4, 68.5 and 71.6 eV that can be assigned to Ni2+ 3p3/2 and Ni3+ 3p3/2 consistent with previously reported results.30,34,35 The absence of binding energies for the spin orbit components Ni 2p1/2 and Ni 2p3/2 between 890 and 850 eV shows that there was no formation of metallic Ni, NiO or Ni(OH)2 species (or hydrated nickel oxide NiO·H2O species).15,36
The available surface area of the LN-NO layer is proportional to the value of the peak current at +465 mV. The anodic peak currents were measured from the cyclic voltammograms showed in Fig. 5A, plotted as a function of cycle number and presented on Fig. 5B. It can be easily seen the surface area increases linearly with the number of voltammetric cycles until the 100th cycle. Between cycle numbers 100 and 150 there is a trend towards stabilization. The increased current is due to the greater access of OH− species to the nanoxide due to increased roughness factors and, consequently, more Ni2+ is oxidized to Ni3+.37
The influence of OH− concentration on the voltammetric profile was evaluated and is shown in Fig. S1(A),† where the cyclic voltammograms of the 150th cycle of the nanoxide electrode in 0.1, 0.5 and 1.0 mol L−1 NaOH solutions are presented. The anodic peak currents and the corresponding peak potentials are presented as a function of the NaOH concentration in Fig. S1(B).† It can be easily seen that an increase in OH− concentration led to an increase of peak current and a shift to less positive potential values. This behavior is indicative of the involvement of OH− anions in the electrode reaction for NiOOH formation, consistent with reports in the literature.14 Due to the less positive potential of the anodic peak and the higher value for the oxidation peak current, the concentration of 1.0 mol L−1 was chosen for the following experiments.
The influence of the inversion potential on the oxide layer formation is shown in Fig. S2.† The voltammetric profiles were evaluated in 1.0 mol L−1 NaOH solution at pH 13 with the 150th cycle registered. Fig. S2(A)† shows typical cyclic voltammograms of the nanoxide electrode recorded between 0 and: (a) 500, (b) 550 and (c) 600 mV inversion potential. The anodic peak current and anodic peak potential are presented as a function of the inversion potential in Fig. S2(B).† It is clearly seen that an increase in the range of potential led to an increase in the peak current and a shift to less positive potential values (see Fig. S2(B)†). The linear dependence of the anodic peak current with the inversion potential suggests that the amount of LaNiO2OH produced on the electrode surface increases linearly because the time window where the potential is suitable for the electrode reaction to occur is larger, with increased formation of the mixed oxy-hydroxide.38 Due the higher amount of mixed oxy-hydroxide produced in the electrode surface, the range potential between 0 and 600 mV was chosen for the following experiments.
The final parameter that influences the modified electrode performance and, therefore, had to be optimized is the amount of nanoxide suspension added to the glassy carbon electrode surface. The optimization procedure was carried out by cyclic voltammetry in 1.0 mol L−1 NaOH solution (pH = 13), using a potential range of 0.20 to 0.60 V vs. Ag/AgCl, after the modification of the GC electrode surface with aliquots of 2.0 to 10 μL of nanoxide suspension. It is observed in Fig. S3† that the anodic peak current goes reached a maximum value when 8 μL of the nanocomposite solution was dropped onto the electrode surface. This behavior can be ascribed to the crescent thickness and roughness of the ultrathin film, with a corresponding increase in the amount of active electrocatalytic sites on the surface of the electrode, as reported to conducting polymers by Martin and Teixeira.39 Above the volume of 8 μL the decrease in the peak current observed is due to increasing electrical resistance on the surface of the electrode. This result was consistent to reported in others modified surfaces39,40 and can be attributed to a balance between better dispersion of the nanoxide on the electrode surface for smaller coating volumes and a higher electrical resistance provided by large volumes added. Considering the results presented, the volume of 8 μL solution of nanocomposite was utilized for further studies.
The standard voltammetric profile of the LaNiO3 electrode in 1.0 mol L−1 NaOH solution (pH 13) is presented in Fig. 6, using the optimized parameters discussed above. Cyclic scans were performed in unstirred solution between 0.2 and 0.60 V vs. Ag/AgCl at a potential scan rate of 50 mV s−1, in the positive potential direction first. Such cyclic voltammograms presented two current peaks, an anodic one at +0.412 V (Epa) and the corresponding cathodic one at +0.353 (Epc). The peaks can be attributed to the reversible process (ΔE = 59 mV) involving one single electron transfer to the NiII/NiIII pair. The surface concentration of electroactive sites on the modified surface (Γ/mol cm−2) was estimated from the background-corrected electric charge (Q), under the anodic peaks, in accordance with the theoretical relationship:41 Γ = Q/nFA, where Q (C) is the electric charge, n is the number of electrons transferred; F is the Faraday constant (96
485.34 C mol−1); and A is the electrode geometric area. In the experimental conditions described above, Q was found to be about 2.93 × 10⁻⁵ C, and the estimated surface concentration was found to be equal to 4.34 × 10⁻⁹ mol cm−2.
The impedance spectrum under the same conditions as Fig. 6A is displayed in Fig. 6B as complex plane plots (Nyquist diagrams) for the two electrodes (GC and LN-NO). The diagrams consisting of semicircles and diffusion straight lines were analyzed with a Randle's modified equivalent circuit [Rs(CPE[RctZW])], where Rs is the solution resistance, Rct is the charge transfer resistance, ZW is the Warburg impedance and CPE is a constant phase element. The apparent heterogeneous electron rate constant was determined using Kapp = RT/F2RctCA, in which F is the Faraday constant (96
485.34 C mol−1), C is the probe redox concentration in solution (5.0 mmol L−1), R is the gas constant (8.3145 J K mol), T is the temperature (298 K), A is the geometric area (0.07 cm2) and Rct is the charge-transfer resistance obtained by fitting the data. The Nyquist diagrams were fitted with a modified Randles circuit. It is worth highlight the charge transfer resistance decreasing from 3590 Ω for bare GC to 30.24 Ω with LN-NO modification surface. Kapp values were calculated for bare GC and modified electrodes and the values obtained were 3.65 and 0.03, respectively. Rct is smaller for GC/LN-NO because of the electrocatalytic capacity of the nanoxide, which promotes faster electron transfer.
In order to understand the electrochemical behavior of nickel in strong alkaline medium, a scan rate study was carried out. Fig. S4(A)† shows cyclic voltammograms of the LaNiO3/GC in 1.0 mol L−1 NaOH solution recorded at several scan rates between 5 and 100 mV s−1. Fig. S4(A)† shows that the peak-to-peak potential separation increased from 55 mV at 5 mV s−1 to 88 mV at 600 mV s−1. In according to the report by Sedenho and co-workers,37 this increase indicates a limitation in the charge-transfer kinetics. In Fig. S4(B),† a linear relationship can be observed when Ipa and Ipc are plotted against the scan rate, which suggests an electrochemical activity controlled by surface-bound species. This performance is expected, as reported in the literature,37 as the redox species (Ni(OH)2 and NiOOH) are immobilized on the electrode surface.
The relationship between variations in the peak potential and the logarithm scan rate may be used to calculate parameters such as anodic electron transfer coefficients (αa) and the apparent electrochemical rate constant (ke) for immobilized redox centers on the electrode surface, similar to the method described by Laviron.42 Fig. S4(C)† shows the relationship of Ep (V) with the log
scan rate (V s−1) obtained with the GC/LN-NO in 1.0 mol L−1 NaOH solution. There is a fair linear dependence on the peak potential only in the scan rate range of 0.04–0.10 V s−1 and the slope of the linear segment is equal to 2.3003RT/αanF for the anodic peak. The value obtained for αa was 0.97. The apparent electrochemical rate constant can be obtained using the equation ke = 2.303 αanFνa/RT, in which the value scan rate (νa) is estimated by extrapolation of the anodic linear branch at higher scan rates and evaluating its intersection with the constant peak potential. The apparent electrochemical rate constant was calculated as 1.82 s−1 (to νa = 0.020 V s−1). The ke is a measure of the kinetic facility of a redox couple. A system with a high electrochemical rate constant will achieve equilibrium on a short time scale.
The dependence of the voltammetric profiles on the cholecalciferol concentration was obtained and is presented in Fig. 8. It can be easily observed that the anodic peak current at +0.46 V vs. Ag/AgCl increased proportionally with the cholecalciferol concentration in the range from 0 to 2.6 × 10⁻⁵ mol L−1, suggesting that the modified electrode presents an excellent electrocatalytic response and thus can be used for the determination of cholecalciferol in real samples. This is a very important conclusion since electrochemical determination of cholecalciferol is quite difficult, with only a few reports in the literature. In those studies the cholecalciferol was electro-oxidized in a much more positive range of potentials (1.30 V,44 1.18 V,43 1.05 V,45 0.66 V (ref. 13) and 0.51 V (ref. 15) vs. Ag/AgCl) than that presented in this work using the LaNiO3-nanoxide/GC electrode (+0.46 V vs. Ag/AgCl). This achievement is important because at low overpotentials the possibility of interfering compounds decreases significantly, thus increasing the selectivity of the analytical methodology. The analytical curves of the peak currents (Ip) versus vitamin D3 concentrations are linear in the range between 0 and 2.6 × 10⁻⁵ mol L−1 (Fig. 8B) with a linear regression equation of Ipa (mA) = 9.35 × 10⁻⁹ + 17.75Cvitamin D3 (mol L−1) with a correlation coefficient of 0.999 (n = 14). The limit of detection was calculated in according to equation LOD = yB + 3SB, with the values yB (=a) and SB (=Sy/x) previously calculated where a is the intercept and Sy/x is the standard deviation of y-residuals of least-squares line (linear regression). Whereas, the sensitivity was calculated by the slope of least-squares line (linear regression), b = ∑[(xi − x)(yi − ȳ)]/∑(xi − x)2.46,47 The limit of detection (LOD) of cholecalciferol was calculated as 8.2 × 10⁻⁷ mol L−1. The excellent results in the electroanalytical performance highlighted the electrocatalytic activity into LN-NO in the electro-oxidation of cholecalciferol indicating that this sensor can be excellent alternative to vitamin D3 detection.
Although there is a previous report with a lower detection limit, using a glassy carbon electrode modified with a SiO2/GO/Ni(OH)2 material (3.26 nmol L−1),15 the proposed electrode has the advantage of simple preparation and much lower cost for the nanoxide material, which is carbon-free (not requiring graphene and carbon nanotubes). The cost to obtain 1 g of LN-NO was about 64, 172 and 37 times lower than graphene, carbon nanotubes: single-walled and multi-walled, respectively.
The reproducibility and repeatability of the LaNiO3-nanoxide/GC electrode were tested using the square wave voltammetry technique. The measurements were performed ten times in the presence of 15 μmol L−1 of vitamin D3 with the same electrode and with five different sensors prepared at room temperature under the same conditions. The LaNiO3-nanoxide/GC electrode presented good repeatability and good reproducibility without any significant loss of electrocatalytic activity with relative standard deviations (RSD) of 1.9% and 2.7%, respectively.
Table 1 list the efficiency of the GC/LN-NO electrode for vitamin D3 determination compared with other electrodes modified. The limit of detection this sensor can be considerably competitive with similar devices for the determination of vitamin D3 in comparison with most modified materials.
| Sensing layer | Transduction | Sensitivity | LOD | Linear range | Reference |
|---|---|---|---|---|---|
| Au/SAM/antibody | SPR | 2.8 mA mL mg−1 | 2 μg mL−1 | 5–50 μg mL−1 | 5 |
| Au/SAM/antibody | DPV | 0.020 mA mL ng−1 | 10 ng mL−1 | 20–200 ng mL−1 | 5 |
| Glassy carbon | DPV | 0.025 μA μmol−1 L−1 | 0.118 μmol L−1 | 5.0 × 10⁻⁶ to 5.0 × 10⁻⁵ mol L−1 | 13 |
| GC/SiO2/GO/Ni(OH)2 | SWV | 9.2 μA μmol−1 L−1 | 3.26 × 10⁻⁹ mol L−1 | 0.5–2.5 μmol L−1 | 15 |
| GC/LN-NO | SWV | 17.75 A mol−1 L−1 | 8.3 × 10⁻⁷ mol L−1 | 0 to 2.6 × 10⁻⁵ | This work |
Various vitamins structurally related with vitamin D3 such as vitamins A, E, B2, B3, B6, C, P and K were added into the NaOH solution in the presence of 1.5 × 10⁻⁵ mol L−1 cholecalciferol were tested as potential interfering compounds. Firstly, SWV to vitamin D3 electrooxidation (fixed in 1.5 × 10⁻⁵ mol L−1) was performed. Subsequently, 3.2 and 6.4 × 10⁻⁶, 4.9 and 9.8 × 10⁻⁷, 0.92 and 1.8 × 10⁻⁶, 5.2 and 10.0 × 10⁻⁶, 1.3 and 2.6 × 10⁻⁶, 1.1 and 2.2 × 10⁻⁶, 2.3 and 4.7 × 10⁻⁶, 8.6 × 10⁻⁵ of vitamins A, E, B2, B3, B6, C, P and K, respectively, were added were added individually, and the SWV were recorded (Fig. S5†). No additional analytical signals were detected for all interfering compounds within the ranges studied suggesting that the sensor was specific for the vitamin D3 detection. The effect of the presence of each substance was performed from the currents measured, at the optimized experimental conditions, employing GC/LN-NO surface for vitamin D3 and interfering compound. Fig. 9 shows relative current percentages for vitamin D3 after each interfering added. However, interfering compounds showed small variation of interference on the vitamin D3 oxidation current. Considering that the vitamin D3 signal is interference-free, we can estimate the percentages of interference of the vitamin A, E, B2, B3, B6, C, P and K, and the values obtained were of 1.6 and 2.9, 3.9 and 5, 7.5 and 7.5, 8.7 and 8.6, 9.1 and 9.7, 11 and 11.4, 12 and 12.8, 13.5 and 12%, respectively. This indicate the co-adsorption processes on the LN-NO surface15 but there are not impediment of the nanoxide knowing the interference percentage of each compound.48 The relative standard deviation was calculated using RSD = 100S/Xm and the value obtained was of 4.1%. Therefore, we can conclude that the nanoxide LaNiO3 was able to detect vitamin D3 in the presence of these interferences. Moreover, it is relevant to highlight the little shift in the sensitivity of the GC/LN-NO surface does not restrain its use for the vitamin D3 detection in the presence of possible interferences substances and can be applied in real samples.15
![]() | ||
| Fig. 9 Effect of the presence of vitamins A, E, B2, B3, B6, P, C and K on the voltammetric responses obtained for 1.5 × 10⁻⁵ mol L−1 vitamin D with the LN-NO/GC sensor. | ||
The developed sensor was specific for secosteroid due to synergetic effect between LaNiO3 perovskite-type oxide and vitamin D3,15 as well as, an excellent electrically conducting oxide used to electrode material in electronic devices.17 These nanomaterials can be applied together in the development of electrochemical sensors for direct vitamin D3 quantification in biological15 and environmental matrices.
Footnote |
| † Electronic supplementary information (ESI) available. See DOI: 10.1039/c6ra04740h |
| This journal is © The Royal Society of Chemistry 2016 |