Dilution or heating induced thickening in a sodium dodecyl sulfate/p-toluidine hydrochloride aqueous solution

Jingyan Zhang*ab, Liangliang Jianga, Zhiyuan Zhub and Shiyong Liu*b
aSchool of Materials and Chemical Engineering, Anhui Jianzhu University, Hefei, Anhui 230022, China
bCAS Key Laboratory of Soft Matter Chemistry, Hefei National Laboratory for Physical Sciences at the Microscale, iChem (Collaborative Innovation Center of Chemistry for Energy Materials), Department of Polymer Science and Engineering, University of Science and Technology of China, Hefei, Anhui 230026, China. E-mail: zhangjy8@mail.ustc.edu.cn; sliu@ustc.edu.cn

Received 20th February 2016 , Accepted 11th April 2016

First published on 13th April 2016


Abstract

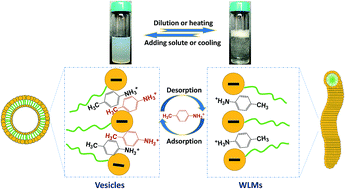
The formation of unilamellar vesicles was successfully established by the addition of hydrotropic salt p-toluidine hydrochloride (PTHC) to solutions of the anionic surfactant sodium dodecyl sulfate (SDS) at high salt concentrations ([PTHC]/[SDS], xPTHC > 0.6). Further studies on the existing vesicles were conducted in terms of changes of concentrations or temperatures of the aqueous solutions. Upon dilution or heating these vesicles can transform into long, flexible wormlike micelles (WLMs). In this process, the solutions switch from an aqueous solution of bluish and nearly Newtonian liquids with low viscosity to clear and viscoelastic solutions with an ability to trap bubbles, which was called “dilution-thickening” or “thermo-thickening”. It should be noted that a microscopic phase separation always emerges at a narrow range of concentrations or temperatures during the transition. Rheological techniques, laser light scattering (LLS), transmission electron microscopy (TEM), micro-differential scanning calorimetry (micro-DSC), and transmittance measurements were used to confirm the formation of vesicles and their reversible transformation with WLMs. Finally, a tentative mechanism for the reversible vesicle-to-WLM transition was proposed to explain the results.


Introduction

Amphiphilic molecules can self-assemble into diverse aggregates in varying sizes, shapes and compositions depending upon the salt conditions, temperature, pH, composition of the solution, etc.1–4 Among which, vesicles and wormlike micelles (WLMs) represent two of the important classes. Vesicles are hollow spheres enclosed by a bilayer of the amphiphiles and are commonly used to encapsulate labile hydrophilic molecules within their interior. WLMs are long and flexible cylindrical chains with contour lengths as long as several micrometers, which will entangle into a transient network, thereby enhancing the viscoelasticity of the fluid. Accordingly, such unique rheological properties furnish them with the potential to be applied for industry in rheology modifiers of commercial products.5–14

It is well recognized that anionic amphiphiles demonstrate more biodegradable and less toxic behavior than cationic ones.15,16 Nevertheless, the overwhelming majority of research to date has centered around vesicles or WLMs constituted by cationic amphiphiles,17,18 and less attention has been paid on the anionic systems. The anionic micelles reported so far are mainly formed by oleate salts or alkyl sulfates, for example, sodium oleate19 and the sodium dodecyl sulfate (SDS).20

It is widely reported that SDS micellar growth and transitions from spherical micelles to rodlike micelles or WLMs are mainly induced by the addition of a typical organic electrolyte, p-toluidine hydrochloride (PTHC).21,22 The hydrotropic salt PTHC, being a strong electrolyte, dissociates in water to form p-toluidinium cation (PTH+) and Cl anion. The cationic nature of PTH+ facilitates the adsorption of the ion to the negatively charged SDS micelle surface. Compared to inorganic salts (e.g., NaCl, KBr), PTHC can bind strongly to the micellar surface and efficiently promote the transition at less than equimolar ratios of salt to surfactant.

Kaler et al.21 has made phase behavior studies on the SDS/PTHC aqueous solutions, and in the absence of a complete diagram, a pseudo-ternary phase map of SDS–PTHC–water system was postulated. For low SDS concentrations, the solution remains clear and isotropic at all molar ratios of PTHC to SDS. At higher SDS concentrations, adding PTHC makes the solutions viscous and, in some cases, viscoelastic (trapped air bubbles recoil). Using a combination of laser light scattering (LLS) and small angle neutron scattering (SANS), Hassan and coworkers22 successfully established that spherical SDS micelles can transform into short ellipsoidal shapes at low PTHC contents (i.e., [PTHC]/[SDS], xPTHC = 0.3 and 0.4). At xPTHC ≥ 0.5, rodlike micelles or WLMs with much higher axial ratio form. Note that, the SDS concentration of the solutions is fixed at 50 mM.

It should be noted that as the molar ratio, xPTHC, approaches 1, a turbid precipitate is formed.21–24 In other words, a two-phase region emerges at higher PTHC content. Accordingly, whereas SDS micellar growth induced by the hydrotropic salt PTHC has been studied extensively, there are few reports discussed the phase behavior and the transitions of the self-assembly aggregates near or beyond equimolar ratio of PTHC to SDS. In our studies, we are surprised to find that PTHC salts could further induce SDS micelles transition from spherical micelles or WLMs to unilamellar vesicles as xPTHC ≥ 0.7. Rheological techniques, transmission electron microscopy (TEM), and LLS are used to confirm the extraordinary self-assembly of vesicles at high PTHC contents. Of course, it is absolutely unavoidable a temporary microscopic phase separation emerges during the transition from WLMs to vesicles. To the best of our knowledge, this most probably represents the first investigation of vesicles formed in the SDS/PTHC aqueous solutions.

In particular, further studies on the existing vesicles were conducted in terms of changes on concentrations and temperatures of the aqueous solutions. Surprisely, these vesicles could transform back into WLMs upon dilution or heating, thereby inducing the aqueous solutions from bluish and nearly Newtonian liquids with low viscosity to clear and viscoelastic solutions with an ability to trap bubbles, so called “dilution-thickening (i.e., viscosity increase with dilution)” or “thermo-thickening (i.e., viscosity increase with temperature)” fluids.

Formulations that undergo phase transition from a low viscous to high viscous state upon dilution with water or change in temperature find important applications in personal care products or drug delivery system.23,24 However, the concerned research i.e., dilution-thickening liquids, have been described previously in only a couple of systems to our knowledge. For example, mixtures comprising amine oxide and anionic surfactants that readily increases in viscosity upon dilution with water has been reported for use in liquid soap formulations.25 Hassan et al. reported the concentration dependent rheology and microstructure of aggregates in the hydrotrope-rich region of cetyltrimethylammonium bromide/sodium 3-hydroxy naphthalene 2-carboxylate (CTAB/SHNC) mixture (SHNC[thin space (1/6-em)]:[thin space (1/6-em)]CTAB is 85[thin space (1/6-em)]:[thin space (1/6-em)]15).26

On the other hand, generally the typical anionic surfactant vesicles or WLMs formed by SDS,27 sodium oleate,15 and sodium erucate28,29 do not show the thermo-thickening rheological response.30 Only some specific anionic surfactants with a hybrid structure such as sodium 1-[4-(tridecafluorohexyl) phenyl]-1-oxo-2-hexanesulfonate (FC6-HC4)31 and octadecylphenylalkoxy sulfonate (C18ΦPaEbS)32 have been shown to possess such an unusual behavior. Thermo-thickening behavior in cationic vesicles or WLMs also has scarcely been found for cetyltrimethylammonium 3-hydroxy naphthalene-2-carboxylate (CTAHNC), erucyl bis-(hydroxyethyl) methylammonium chloride (EHAC)33 or CTAB34,35 in the presence of a strongly hydrophobic organic compound: 3-hydroxynaphthalene-2-carboxylate (HNC),33 5-methyl salicylic acid (5 mS)34 or n-octanol (C8OH).35

The present study with SDS/PTHC system began in an attempt to form unilamellar vesicles at around equimolar ratios of hydrotropic organic PTHC salt to typical anionic SDS surfactant. Subsequently, we carried out a systematic investigations of the SDS/PTHC vesicles and WLMs over a range of concentration and temperature employed with a combination of LLS, TEM rheological techniques, micro-differential scanning calorimetry (micro-DSC), and transmittance measurements. Our results unambiguously demonstrate the formation of vesicles in these solutions at high PTHC content. Furthermore, the vesicles undergo a continuous phase transition to WLMs with dilution or temperature. Moreover, the transition mechanism between vesicles and WLMs were also tentatively proposed.

Experimental section

Materials

Sodium dodecyl sulfate (SDS) (analytical grade, Shanghai Chemical Reagent Co.) was recrystallized from anhydrous ethanol. p-Toluidine hydrochloride (PTHC, Fluka) was used without further purification. Stock solutions of SDS and PTHC were prepared in deionized water.

Rheological measurements

The rheological measurements were done on a Rheometrics RFS II fluid spectrometer using couette geometry and parallel plate geometry. The parallel plate geometry consisted of a titanium upper plate and an aluminium-coated lower plate, both of 50 mm diameter. The couette geometry consisted of a 33.96 mm diameter aluminium-coated cup and a titanium bob of diameter 32 mm and height 33.31 mm. Proper care was taken to reduce at a minimum the evaporation of the sample. Steady shear flow experiments were performed from 0.02 to 100 s−1. The zero-shear viscosity η0 was determined by extrapolation of the flow curves to the zero shear.

Laser light scattering (LLS)

A commercial spectrometer (ALV/DLS/SLS-5022F) equipped with a multi-tau digital time correlator (ALV5000) and a cylindrical 22 mW UNIPHASE He–Ne laser (λ0 = 632 nm) as the light source was employed for dynamic LLS measurements. Scattered light was collected at a fixed angle of 90° for a time period of 15 min. Distribution averages and particle size distributions were computed using cumulants analysis and CONTIN routines. All data were averaged over three measurements.

Transmittance measurements

The transmittance of the aqueous solution was acquired on a Unico UV/vis 2802PCS spectrophotometer and measured at a wavelength of 800 nm using a thermostatically controlled couvette.

Transmission electron microscopy (TEM)

TEM observations were conducted on a Philips CM 120 electron microscope at an acceleration voltage of 100 kV. Samples for TEM observations were prepared by placing 10 μL micellar solution at a concentration of 0.1 g L−1 on copper grids coated with thin films of Formvar and carbon successively. No staining was required.

Micro-differential scanning calorimetry (micro-DSC)

Micro-DSC measurements were carried out on a VP DSC from MicroCal. The volume of the sample cell was 0.509 mL. The reference cell was filled with deionized water. The sample solution with a concentration of 2.0 g L−1 was degassed at 25 °C for half an hour and equilibrated at 10 °C for 2 h before the heating process with the heating rate of 1.0 °C min−1.

Results and discussion

Formation of vesicles in SDS/PTHC aqueous solutions

The structure of aggregates formed in aqueous solutions of an anionic surfactant, SDS, with the addition of a cationic salt, PTHC, have been studied extensively. Using a combination of LLS and SANS, Hassan et al.21,22 have described the formation and properties of spherical and rodlike micelles in SDS/PTHC aqueous solution at low PTHC contents. As the concentration of PTHC increases, the mixed solution becomes viscous indicating the formation of WLMs. For example, for 50 mM SDS solution, as the molar ratio of PTHC to SDS ([PTHC]/[SDS], xPTHC) is above 0.6, the solution become turbid due to the strongly associative nature of the salt and surfactant. Recently, we have reported the kinetics and mechanism of microstructural transition of SDS micelles induced by PTHC employed by stopped-flow with light scattering detection.36

Interestingly, our further research indicates that as the concentration of PTHC increases more, the two-phase mixture transforms into clear and isotropic surfactant solution with low viscosity. It is confirmed by the digital photographs in Fig. 1b. The aqueous solution is colorless and perceptibly viscous with lots of “captured” bubbles at xPTHC = 0.6, whereas the solution visually turns nonviscous at xPTHC = 1.0 appearing a bluish tinge characteristic of vesicles.


image file: c6ra04593f-f1.tif
Fig. 1 (a) Typical steady-shear rheological responses of SDS/PTHC aqueous mixture (25 °C) at xPTHC = 0.6. (b) Variation of zero-shear viscosity (η0) as a function of [PTHC]/[SDS] molar ratios, xPTHC, obtained for SDS/PTHC aqueous mixtures at 25 °C. The insets show photographs of SDS/PTHC aqueous mixture at xPTHC = 0.2 (spherical micelles), xPTHC = 0.6 (worm-like micelles), and xPTHC = 1.0 (vesicles). SDS concentrations were fixed at 50 mM.

Fig. 1a depicts the typical steady-shear rheological response of the aqueous solution (25 °C) of SDS/PTHC at xPTHC = 0.6. The solution displays a shear-thinning response, with a plateau in the viscosity at low shear rates, followed by a drop in viscosity at higher ones. Then according to the rheological curve the zero-shear viscosity (η0) is obtained. Similar rheological changes at different xPTHC are observed. Fig. 1b shows the variation of η0 as a function of xPTHC, obtained for SDS/PTHC aqueous solution at 25 °C. It is obviously that at low xPTHC the viscosity of solution is very low close to that of water (1 mPa s). At xPTHC > 0.3, the zero-shear viscosity abruptly increases apparently indicating the presence of WLMs, which reaches to maximum value at xPTHC = 0.6. With further increase in xPTHC, the viscosity thereafter drops precipitously. The samples show a bluish hue (see photograph of a typical sample at xPTHC = 1.0), which is the manifestation of the Tyndall effect due to the presence of large scatters in solution, and it is generally seen for solutions containing vesicles. Raghavan et al.34 has demonstrated that the aromatic derivative, 5-methyl salicylic acid (5 mS), can induce the cationic surfactant, CTAB, to form either WLMs or unilamellar vesicles depending on the solution composition.

The fabrication of the WLMs and their transition to vesicles are further confirmed by cryo-TEM observations. Fig. 2a and b shows the typical cryo-TEM images of the aqueous solutions of SDS/PTHC mixtures at xPTHC = 0.6. SDS concentrations were fixed at 50 mM. As expected, both of them revealed the presence of long, flexible WLMs. Next, we turn to the sample at xPTHC = 1.0. In this case, the cryo-TEM (Fig. 2c and d) shows unilamellar vesicles. The particle sizes determined by TEM were in the range of 50–100 nm in diameter.


image file: c6ra04593f-f2.tif
Fig. 2 Typical cryo-TEM images obtained for aqueous solutions (25 °C) of SDS/PTHC mixture: (a) and (b) xPTHC = 0.6; (c) and (d) xPTHC = 1.0. SDS concentrations were fixed at 50 mM.

Dilution induced vesicles to WLMs transition in SDS/PTHC aqueous solutions

Besides at 50 mM, we found this tunable micelle-to-vesicle transition upon xPTHC over a large scale of SDS concentrations. In the absence of a complete diagram, a partial phase diagram of the SDS/PTHC mixtures at different compositions in the water rich region (total surfactant concentration < 130 mM) was constructed using LLS and rheological measurements (Fig. 3). We can clearly see that at a fixed SDS concentration, the transition of the morphology of the aggregates occurs from micelles to WLMs and even to vesicles with PTHC concentration. However, the onset xPTHC for the transition from spherical micelles to WLMs and also for the transition from WLMs to vesicles both decreases with SDS concentrations. That is, at higher SDS concentrations, less PTHC can induced the transition of WLMs to vesicles. On the contrary, much PTHC were needed for this transformation at lower SDS concentrations. In other words, upon dilution conveniently the aqueous solutions of SDS/PTHC mixtures can transform from vesicles to WLMs, which can also be verified by the equimolar line in Fig. 3. In summary, we are pleased to find an interesting phenomenon that the convenient dilution oppositely leads to an increase in viscosity of aqueous solution.
image file: c6ra04593f-f3.tif
Fig. 3 Partial phase diagrams obtained for the aqueous solution of SDS/PTHC mixtures at 25 °C.

To further elucidate the novel phenomenon of the “dilution-thickening” phenomenon, we resorted to LLS measurements obtained for the aqueous solutions of SDS/PTHC mixtures at a fixed xPTHC of 1.0 and 25 °C (Fig. 4). Previously we have measured the critical micellization concentration (CMC) of SDS solutions at different molar ratios of PTHC to SDS using surface tensiometry.36 In the absence of PTHC, SDS exhibits a CMC of ∼8.3 mM at 25 °C. Upon addition of PTHC, the CMC of SDS solutions abruptly decreases to 1.1 and 0.75 mM at xPTHC = 0.3 and 0.6, respectively. It can be inferred that the CMC of SDS solution should be decreased much more at xPTHC = 1.0. Consider first the results for SDS solution below ∼18 mM. At these concentrations, the samples are clear and nonviscous which is generally seen for solutions containing spherical micelles. It also can be deduced from the partial phase diagram (Fig. 3). The scattered light intensity is very low and the intensity-average hydrodynamic radius, 〈Rh〉, is ca. 9 nm at ∼15 mM SDS. As [SDS] is increases to about 18–36 mM, the samples turn viscous. The scattered light intensity increases moderately and the distribution peak with longer radius (∼13 nm) should be ascribed to the micellar growth into WLMs, which is in accordance with the results previously reported by Hassan et al.21,22 As the concentration of SDS increases to 37–42 nm, the solution tends to phase-separate. While with further increase in [SDS], the mixtures recovers clear and homogenous. Note from Fig. 4a that the scattered intensity of the solutions exhibits a sharp increase at about 44 mM SDS. On the other hand, the dynamic LLS reveals a bimodal Rh distribution (Fig. 4b). The distribution peak with smaller radius (∼13 nm) should be ascribed to the WLMs. The presence of large aggregates with an average size of ∼100 nm in radius should be ascribed to the vesicles coinciding with the literature. As the concentration of SDS increases to 50 mM, the SDS/PTHC solutions exhibit a 〈Rh〉 of ∼100 nm, indicating the WLMs completely transform into vesicles.


image file: c6ra04593f-f4.tif
Fig. 4 (a) Variation of scattered light intensity as a function of SDS concentrations obtained for the aqueous solution of SDS/PTHC mixture at xPTHC = 1.0 and 25 °C. (b) Comparison of hydrodynamic radius distributions, f(Rh), at different SDS concentrations and a fixed xPTHC of 1.0. The temperature was 25 °C and scattering angle was at 90°.

Corresponding changes also occur in the rheology measurements. Fig. 5 shows the variation of zero-shear viscosities (η0) as a function of SDS concentrations obtained for aqueous solutions of SDS/PTHC mixture at xPTHC = 1.0 and 25 °C. It is clearly that as the concentration of SDS is above 20 mM, the zero-shear viscosity grows by about 3 orders of magnitude. The resulting samples are clear, viscoelastic solutions and show an ability to trap bubbles, which is the characteristics of WLMs. Moreover, the WLMs grows and wraps around each other more tightly with the concentration of SDS. Note from Fig. 3 the samples falls in the vesicle region of the phase diagram as the concentration of SDS is above ∼44 mM at xPTHC = 1.0 and 25 °C. Accordingly the zero-shear viscosity (η0) drops sharply suggesting a transition from WLMs to vesicles. The data presented here further confirms the interesting phenomenon of “dilution-thickening”.


image file: c6ra04593f-f5.tif
Fig. 5 Variation of zero-shear viscosities (η0) as a function of SDS concentrations obtained for aqueous solutions of SDS/PTHC mixture at xPTHC = 1.0 and 25 °C.

Heating induced vesicles to WLMs transition in SDS/PTHC aqueous solutions

We have indicated that dilution could induce vesicles to WLMs transition in SDS/PTHC mixtures. Next, we describe the unusual behavior exhibited by these solutions upon heating. Systematic studies as a function of temperature for the aqueous solution of SDS/PTHC mixture at xPTHC = 1.0 and 50 mM SDS are reported.

Fig. 6 shows the temperature-dependent optical transmittance (800 nm) obtained for the aqueous solution of SDS/PTHC mixture. The optical transmittance was recorded at a wavelength of 800 nm, where SDS and PTHC absorb minimally, so that any changes in this quantity are due to the scattering of light by nanostructures in solution. At low temperatures, the samples shows a bluish tinge characteristic of vesicles with a low optical transmittance of ∼45% due to the presence of large scatterers in solution. As the temperature increased to 33 °C, microscopic phase separation emerges. However, above 38 °C, the samples turn back to colorless, clear, and homogenous solutions and the optical transmittance abruptly increases nearly to 100%. Similar variation on the optical density has been observed in the aqueous solutions of CTAB/5mS mixtures due to the transformation of unilamellar vesicles into WLMs.34 The data presented here most probably suggest a transition from vesicles to WLMs upon heating, and we will presently use LLS, TEM, rheology, and DSC to study and confirm such a transition. The variation of average hydrodynamic radius, 〈Rh〉, and scattered light intensity as a function of temperature obtained for the aqueous solution of SDS/PTHC mixture is shown in Fig. 7. In the temperature range of 20–33 °C, the mixed samples exhibit much stronger scattered intensities and 〈Rh〉 is ca. 120–150 nm. As discussed above, under this condition the vesicles are the dominating aggregates in the sample. After a stage of microscopic phase separation during 33–38 °C, the scattered intensities drops sharply and falls to nearly zero. Above 38 °C corresponding changes also occur in the average hydrodynamic radii, and 〈Rh〉 decreases to ∼20–70 nm. Thus it can be concluded that the large vesicles are almost disappeared at this temperature. The formation of these smaller aggregates in the transparent solutions may be attributed to the WLMs. It should be noted that in the temperature range of ∼38–57 °C, 〈Rh〉 decreases moderately with temperature from ∼70 nm to ∼20 nm, while the scattered light intensity exhibits no appreciable changes and remains almost constant nearly to zero. It probably because the composition of these samples is rich in the solute of water and the light scattering intensity is comparatively less sensitive to the stretched WLMs with lower number densities, which exhibits very low scattered intensity similar to those of the smaller assemblies.


image file: c6ra04593f-f6.tif
Fig. 6 Temperature-dependent optical transmittance (800 nm) obtained for the aqueous solution of SDS/PTHC mixture at xPTHC = 1.0. SDS concentrations were fixed at 50 mM.

image file: c6ra04593f-f7.tif
Fig. 7 Variation of average hydrodynamic radius, 〈Rh〉, and scattered light intensity as a function of temperature obtained for the aqueous solution of SDS/PTHC mixture at xPTHC = 1.0. SDS concentrations were fixed at 50 mM.

To further elucidate the microstructure in the clear and transparent solutions at higher temperatures, we resorted to cryo-TEM. Typical cryo-TEM images obtained for the aqueous solution of SDS/PTHC mixture ([SDS] = 50 mM and xPTHC = 1.0) at 40 °C was shown in Fig. 8. Large amount of linear and flexible aggregates were observed indicating the presence of WLMs. Corresponding changes also occur in the rheological measurements. Fig. 9 plots the variation of zero-shear viscosity (η0) as a function of temperature obtained for the aqueous solution of SDS/PTHC mixture ([SDS] = 50 mM and xPTHC = 1.0). The data again demonstrate that the onset of the transition. As the temperature is below 33 °C, η0 is about 5–9 mPa s which is slightly higher than that of water (1 mPa s). Then the microscopic phase separation is observed during 33–38 °C. As the temperature is higher than 38 °C, η0 rises by nearly 2 orders of magnitude to ∼0.3–0.4 Pa s indicating the resulting samples are viscoelastic solutions which is the characteristics of WLMs. With further increase in temperature the zero-shear viscosity reaches a peak and thereafter decreases gradually.


image file: c6ra04593f-f8.tif
Fig. 8 Typical cryo-TEM images obtained for the aqueous solution of SDS/PTHC mixture with xPTHC = 1.0 at 40 °C. SDS concentration was 50 mM.

image file: c6ra04593f-f9.tif
Fig. 9 Variation of zero-shear viscosity (η0) as a function of temperature obtained for the aqueous solution of SDS/PTHC mixture at xPTHC = 1.0. SDS concentration was fixed at 50 mM.

Changes in solution structure with temperature were also investigated by Micro-DSC. Fig. 10 plots the Micro-DSC curve recorded for SDS/PTHC aqueous mixture with xPTHC = 1.0 and [SDS] = 50 mM. An endothermic peak can clearly be observed in the heating curve. This peak appears during the interval of transition (from ca. 29 °C to ca. 39 °C). It is possibly a result of the positive transfer enthalpy of vesicle to WLM transition. In sum, the result of Micro-DSC studies also provides the strong support for our conclusion.


image file: c6ra04593f-f10.tif
Fig. 10 Micro-DSC curve recorded for SDS/PTHC aqueous mixture with xPTHC = 1.0. SDS concentration was 50 mM.

Mechanism for vesicle-WLM transition in SDS/PTHC aqueous solutions

The growth of SDS micelles by the addition of PTHC hydrotropic salt at xPTHC < 0.7 has been established and discussed extensively.21,22 We now proceed to consider the question of why vesicles form at equimolar PTHC concentration or so after the microscopic phase separation. As is known to all, PTHC is an aromatic salt, which features a hydrophobic cation that can bind strongly to anionic SDS micelles. Its mata and para positions inserted into the micellar interior and the ortho protons and the NH3+ group protruding from the micelle surface. The resulting binding of PTHC to SDS should be viewed in terms of the surfactant packing parameter p = υ/, where υ is the surfactant tail volume, l is the tail length, and a is the effective area of the surfactant headgroups. A value of p around 1/3 implies the formation of spherical micelles. Surfactants with 1/3 < p < 1/2 indicates the formation of WLMs whereas with 1/2 < p < 1 displays vecicles formation. With increasing xPTHC, the electrostatic interaction between the surfactant headgroups is screened, and thereby the effective headgroup area decreases, while the volume of the hydrophobic tail portion will increase. Thus the packing parameter p increases, and the SDS micelles (50 mM) consequently grow from spheres to short ellipsoidal shapes at low xPTHC (≤0.4), and to rod-like or wormlike shapes as xPTHC varied from 0.4 to 0.6. When the molar ratio of PTHC to SDS is increased beyond xPTHC = 0.6, the headgroup area could be further reduced and the tail volume increased such that the molecular geometry favors the formation of low-curvature aggregates, i.e. vesicles.

It should be noted that the macroscopic phase separation emerges during the WLM to vesicle transitions. Kaler and coworkers21,22 have reported the solution becomes turbid for 50 mM SDS micelles with PTHC beyond xPTHC = 0.6 due to the strongly associative nature of the salt and surfactant. We believe that the formation of a catanionic salt near the equimolar ratio is responsible for the appearance of turbidity in the solution. A similar turbid region is observed in the phase behavior of the SDS-octyl trimethylammonium bromide (C8TAB)-water system.37 While in case of cationic micelles such as cetyl trimethyl ammonium bromide (CTAB) with the addition of sodium salicylate, no such turbidity is observed even at a very high ratio of salt to surfactant.38 It is probably due to the greater length of the hydrocarbon chains in CTAB than in SDS. The larger asymmetry of the hydrocarbon chain lengths in oppositely charged surfactant–additive pairs prevents the precipitation of catanionic salt. This is also evident from the difference in aggregation behavior of cetyltrimethyl ammonium alkyl sulfonate (CTACnSO3) surfactants.39 For n = 6 or 7 isotropic viscoelastic phases exist at low surfactant concentrations, whereas for n = 8 the aggregates are vesicles.40 Nevertheless, it has passed through the microscopic separation that the anionic SDS solutions with addition of PTHC turn back to homogeneous upon changes in xPTHC, SDS concentration or temperature due to the recovered stabilization of the catanionic salts.

Next, let us discuss the effects of surfactant concentration and temperature on the existing SDS/PTHC vesicular aggregates. As shown above, the dilution induced the vesicle to WLM transition thereby increasing the viscosity of solutions. It can be explained if we consider concentration dependant solubilization of hydrotropes in micelles and postulate that the binding of PTHC is a reversible process. The critical aggregate concentrations of SDS and PTHC are widely different. PTHC, being a hydrotrope, has much higher minimum hydrotrope concentration (MHC) than the CMC of SDS. Upon dilution more and more PTHC will be desorbed from the micelle surface to keep a constant concentration of unassociated monomers in the bulk, which leads to a decrease in the PTHC to SDS ratio in the aggregates. Such dilution induced desorption, if it occurs, would increase the effective headgroup area and reduce the tail volume, thereby driving the vesicles to aggregates of higher curvature. At even higher dilutions the formation of cylindrical structures are favored, and a spontaneous transition from vesicles to WLMs is induced.

The above mechanism allows the temperature effects to be treated in an analogous manner. At low temperatures, most of the PTHC molecules are bound to the vesicles due to dual function of the electrostatic interactions between the negative SDS molecules and positive PTH+ counterions and π–π interactions between the aromatic rings of PTHC. The resulting low surface charge lead to the formation of vesicular aggregates. However, as temperature raised, the solubility of PTHC in bulk water is expected to increase. On the other hand, π–π interactions is a type of non-covalent interaction which should be weakened upon heating. Both of the two reasons mean a reduction in the tendency of PTHC molecules to bind to the vesicles. This may causes some of the weakly bound PTHC to desorb from the vesicles and release into solutions. In turn, along the same line as dilution, one can also explain the transition from vesicles to WLMs upon heating.

Conversely, the vesicle transformation from WLMs can be viewed as the more effective PTHC molecules binding to the aggregates interface. Certainly this could be reached either by adding more solute to the solution or by lowering the temperature.

Conclusions

The present study demonstrated the successful formation of unilamellar vesicles in SDS/PTHC systems at [PTHC]/[SDS], xPTHC > 0.6 and [SDS] = 50 mM. Additionally, a systematic investigations of the SDS/PTHC vesicles over a range of concentration and temperature was performed employed with a combination of rheological techniques, LLS, TEM, micro-DSC, and transmittance measurements. With dilution or increasing temperature the bluish, low-viscosity solutions switched to viscoelastic, shear-thinning fluids, indicating the transition from vesicles to long, flexible WLMs. Moreover, a qualitative mechanism was tentatively proposed to explain the transition between vesicles and WLMs.

Acknowledgements

The financial support from National Natural Scientific Foundation of China (NNSFC) Project (21004001, 21274137 and 51033005), Foundation of Anhui Educational Committee Project (2011SQRL109ZD), Fundamental Research Funds for the Central Universities, and Specialized Research Fund for the Doctoral Program of Higher Education (SRFDP, 20123402130010).

References

  1. V. Degiorgio and M. Corti, Physics of Amphiphiles: Micelles, Vesicles and Microemulsions, North Holland, Amsterdam, 1985 Search PubMed.
  2. B. Jonsson, B. Lindman, K. Holmberg and B. Kronberg, Surfactants and Polymers in Aqueous Solutions, Wiley, New York, 1998 Search PubMed.
  3. D. F. Evans and H. Wennerstrom, The Colloidal Domain: Where Physics, Chemistry, Biology, and Technology Meet, VCH Publishers, New York, 1994 Search PubMed.
  4. R. Zana, Surfactant Solutions: New Methods of Investigation, Marcel Dekker, New York, 1987 Search PubMed.
  5. H. Wennerstrom and B. Lindman, Phys. Rep., 1979, 52, 1–86 CrossRef.
  6. Y. Chevalier and T. Zemb, Rep. Prog. Phys., 1990, 53, 279–371 CrossRef CAS.
  7. Y. Chevalier, Curr. Opin. Colloid Interface Sci., 2002, 7, 3–11 CrossRef CAS.
  8. M. J. Lawrence, Chem. Soc. Rev., 1994, 23, 417–424 RSC.
  9. M. Gradzielski, Curr. Opin. Colloid Interface Sci., 2004, 9, 256–263 CrossRef CAS.
  10. A. Khan, Curr. Opin. Colloid Interface Sci., 1996, 1, 614–623 CrossRef CAS.
  11. M. Gradzielski, Curr. Opin. Colloid Interface Sci., 2003, 8, 337–345 CrossRef CAS.
  12. A. Shioi and T. A. Hatton, Langmuir, 2002, 18, 7341–7348 CrossRef CAS.
  13. M. E. Cates and S. J. Candau, J. Phys.: Condens. Matter, 1990, 2, 6869–6892 CrossRef CAS.
  14. H. Q. Yin, Z. K. Zhou, J. B. Huang, R. Zheng and Y. Y. Zhang, Angew. Chem., Int. Ed., 2003, 42, 2188–2191 CrossRef CAS PubMed.
  15. G. C. Kalur and S. R. Raghavan, J. Phys. Chem. B, 2005, 109, 8599–8604 CrossRef CAS PubMed.
  16. N. Vlachy, C. Merle, D. Touraud, J. Schmidt, Y. Talmon, J. Heilmann and W. Kunz, Langmuir, 2008, 24, 9983–9988 CrossRef CAS PubMed.
  17. P. A. Hassan, S. J. Candau, F. Kern and C. Manohar, Langmuir, 1998, 14, 6025–6029 CrossRef CAS.
  18. A. Khatory, F. Kern, F. Lequeux, J. Appell, G. Porte, N. Morie, A. Ott and W. Urbach, Langmuir, 1993, 9, 933–939 CrossRef CAS.
  19. L. Ziserman, L. Abezgauz, O. Ramon, S. R. Raghavan and D. Danino, Langmuir, 2009, 25, 10483–10489 CrossRef CAS PubMed.
  20. S. Kumar, S. L. David, V. K. Aswal, P. S. Goyal and Kabir-ud-Din, Langmuir, 1997, 13, 6461–6464 CrossRef CAS.
  21. P. A. Hassan, S. R. Raghavan and E. W. Kaler, Langmuir, 2002, 18, 2543–2548 CrossRef CAS.
  22. P. A. Hassan, G. Fritz and E. W. Kaler, J. Colloid Interface Sci., 2003, 257, 154–162 CrossRef CAS PubMed.
  23. M. Scherlund, M. Malmsten, P. Holmqvist and A. Brodin, Int. J. Pharm., 2000, 194, 103–116 CrossRef CAS PubMed.
  24. M. Scherlund, K. Welin-Berger, A. Brodin and M. Malmsten, Eur. J. Pharm. Sci., 2001, 14, 53–61 CrossRef CAS PubMed.
  25. Y.-L. Chen, Thickening on dilution liquid soap, US Pat., 6617293, 2001.
  26. G. Verma, V. K. Aswal, G. Fritz-Popovski, C. P. Shah, M. Kumar and P. A. Hassan, J. Colloid Interface Sci., 2011, 359, 163–170 CrossRef CAS PubMed.
  27. D. G. Angelescu and P. Linse, Langmuir, 2003, 19, 9661–9668 CrossRef CAS.
  28. Y. X. Han, Z. L. Chu, H. Q. Sun, Z. Q. Li and Y. J. Feng, RSC Adv., 2012, 2, 3396–3402 RSC.
  29. Y. X. Han, Y. J. Feng, H. Q. Sun, Z. Q. Li, Y. G. Han and H. Y. Wang, J. Phys. Chem. B, 2011, 115, 6893–6902 CrossRef CAS PubMed.
  30. Z. L. Chu, C. A. Dreiss and Y. J. Feng, Chem. Soc. Rev., 2013, 42, 7174–7203 RSC.
  31. K. Tobita, H. Sakai, Y. Kondo, N. Yoshino, K. Kamogawa, N. Momozawa and M. Abe, Langmuir, 1998, 14, 4753–4757 CrossRef CAS.
  32. M. J. Greenhillhooper, T. P. Osullivan and P. A. Wheeler, J. Colloid Interface Sci., 1988, 124, 77–87 CrossRef CAS.
  33. G. C. Kalur, B. D. Frounfelker, B. H. Cipriano, A. I. Norman and S. R. Raghavan, Langmuir, 2005, 21, 10998–11004 CrossRef CAS PubMed.
  34. T. S. Davies, A. M. Ketner and S. R. Raghavan, J. Am. Chem. Soc., 2006, 128, 6669–6675 CrossRef CAS PubMed.
  35. L. Sreejith, S. Parathakkat, S. M. Nair, S. Kumar, G. Varma, P. A. Hassan and Y. Talmoni, J. Phys. Chem. B, 2011, 115, 464–470 CrossRef CAS PubMed.
  36. J. Y. Zhang, Z. S. Ge, X. Z. Jiang, P. A. Hassan and S. Y. Liu, J. Colloid Interface Sci., 2007, 316, 796–802 CrossRef CAS PubMed.
  37. C. A. Barker, D. Saul, G. J. T. Tiddy, B. A. Wheeler and E. Willis, J. Chem. Soc., Faraday Trans. 1, 1974, 70, 154–162 RSC.
  38. H. Rehage and H. Hoffmann, Mol. Phys., 1991, 74, 933–973 CrossRef CAS.
  39. R. Oda, J. Narayanan, P. A. Hassan, C. Manohar, R. A. Salkar, F. Kern and S. J. Candau, Langmuir, 1998, 14, 4364–4372 CrossRef CAS.
  40. B. K. Mishra, S. D. Samant, P. Pradhan, S. B. Mishra and C. Manohar, Langmuir, 1993, 9, 894–898 CrossRef CAS.

This journal is © The Royal Society of Chemistry 2016
Click here to see how this site uses Cookies. View our privacy policy here.