Tunable emission color and mixed valence state via the modified activator site in the AlN-doped Sr3SiO5:Eu phosphor

Wei Lia, Jin Wanga, Haoran Zhanga, Yingliang Liu*a, Bingfu Lei*a, Jianle Zhuanga, Jianghu Cuia, Mingying Pengb and Yue Zhua
aGuangdong Provincial Engineering Technology Research Center for Optical Agriculture, College of Materials and Energy, South China Agricultural University, Guangzhou 510642, P. R. China. E-mail: tleibf@scau.edu.cn; Fax: +86-20-85285026; Tel: +86-20-85282603
bThe State Key Laboratory of Luminescent Materials and Devices, School of Materials Science and Engineering, South China University of Technology, Guangzhou 510640, P. R. China

Received 18th February 2016 , Accepted 28th March 2016

First published on 29th March 2016


Abstract

Commercially white LEDs have cool white light and a low color rendering index (CRI) due to the absence of red light emission. Considering the respective characteristic luminescence properties of Eu2+ and Eu3+ ions, the combination of the two activators into a single host compound shows promisingly technical feasibility to realize warm w-LEDs with a high CRI but it is still a challenge in practice. Here, we confirmed the mixed europium valence states in Sr3Si1−xAlxO5−2xNx:Eu phosphors, synthesized by a solid-state reaction method under a H2/N2 atmosphere. The crystal structure was characterized by X-ray diffraction and found to crystallize in the Sr3SiO5 phase. The samples show broad excitation bands (250–400 nm) and tunable emission colors from yellow to red, and the CIE chromaticity coordinates of Sr2.97Si1−xAlxO5−2xNx:0.03Eu (x = 0, 0.03, 0.2) were (0.518, 0.474), (0.607, 0.385) and (0.630, 0.367), respectively. The modification of activator sites caused by Al3+–N3− replacing Si4+–O2− explained the coexistence of Eu2+/Eu3+ ions, which was demonstrated by Rietveld refinement, photoluminescence analysis and fluorescence lifetime studies. Furthermore, the obtained phosphors also possessed good thermal stabilities. These results suggest that the Sr3Si1−xAlxO5−2xNx:Eu phosphors show potential applications in w-LEDs.

1 Introduction

Due to fossil fuel depletion and global climate change, all countries call for concerted actions to realize energy conservation and carbon reduction. As one of the representatives in the technical field, solid-state lighting (SSL) offers a promising alternative to conventional lighting sources such as incandescent bulbs and fluorescent tubes. White light-emitting diodes (w-LEDs) have gained general consensus for being the next-generation lighting source owing to its high energy efficiency, long lifetime, short response time, energy savings, environmental friendliness, and material hardness.1–3 Currently, white LEDs typically comprise a blue InGaN chip and yellow (Y,Gd)3(Al,Ga)5O12:Ce3+ (YAG:Ce3+) phosphors. But with long-wavelength spectral emission lacked, this phosphor-converted LEDs (pc-LEDs) solution suffers from high color temperature and low color rendering index.4 Nitride phosphors, such as CaAlSiN3:Eu2+ and M2Si5N8:Eu2+ (M = Ca, Sr, Ba), are commonly used as red-lighting compensation for w-LEDs. But the rather broad emission bands of these materials greatly limits the maximum achievable luminous efficacies of high-quality warm-white pc-LEDs because a significant part of the light is produced outside the sensitivity range of the human eye.5,6 On these accounts, novel phosphor materials with optimized luminescence properties are urgently required.

Among all rare earth ions, europium is the most well-known activator, and both the divalent or trivalent state ions have found enormous applications in lighting and display fields because of their abundant emission colors based on the 5d–4f or 4f–4f transitions.7 Since the f–d transitions of Eu2+ seriously depend on the crystal field effects imposed by the host lattice, its emissions in inorganic phosphors usually occur as broad emission bands and the color can range from ultraviolet to deep red. And Eu3+ ions, frequently used as red-emitting activator, present a series of characteristic sharp emission bands assigned to the electronic transitions of 5D07FJ (J = 0, 1, 1, 2, 3 and 4). Yet Eu3+-activated phosphors often show low absorption efficiency because the 4f–4f transitions are parity-forbidden.8,9 Earlier research pointed that combining Eu2+ and Eu3+ ions in a single host lattice could be a possibility to generate white light with superior color coordinates, which avoid the limit of spectra adjustment and energy loss in multiple rare-earth co-doped phosphors.10 But until now, relative few researches have been conducted on the coexistence of Eu2+ and Eu3+ ions in a single host lattice. Initial studies about concomitance of the two activators found that Eu2+ in some special compounds, which have stiff three-dimensional enclosed crystal structures such as BO4, SO4, AlO4, SiO4 or PO4 tetrahedron groups, can be obtained by synthesis in air at high temperature.11–14 Later, similar phenomenon of mixed valance states were found in LaAlO3:Eu and La1−xSrxAlO3:Eu, meanwhile the Eu2+ ions appear to substitute the trivalent rare earth sites, hitherto, which is still hard to achieve even now.15,16 An abnormal reduction mechanism for above Eu3+ to Eu2+ was proposed on the basis of charge compensation, in which these tetrahedron groups play the electron transferring roles. Recently, a new strategy based on crystal-site engineering, such as designing the host composition with two types of sites for various valence' cations to occupy or choosing appropriate dopants to tune the valence state via controlling the activator site, was reported to realize the coexistence of Eu2+/Eu3+ in Ba2(Ln1−zTbz)(BO3)Cl:Eu (Ln = Y, Gd and Lu), Ca12Al14−zSizO32F2−z:Eu and Ca1+xY1−xAl1−xSixO4:Eu.17–20 Actually, this crystal-site engineering approach has been often used to design inorganic functional materials because it can customize the photoluminescence properties of a given inorganic substance through changing the coordination environment at the site occupied by the luminescent center ion in the crystal.21–23

Due to its high luminous efficiency and thermal stability, Sr3SiO5:Eu2+ can also function as an excellent yellow-orange phosphor for w-LEDs application.24 However, as with available YAG:Ce3+ phosphor, the photoluminescence of Sr3SiO5:Eu2+ phosphor lacks necessary red-emission parts. Hence, efforts have been devoted to improving the intensity in red spectral region through partial substitution like (Sr,Ba,Mg)3SiO5:Eu2+ and Sr3SiO5:Ce3+,Eu2+,Al3+.25–28 In this work, we synthesized a series of Sr2.97Si1−xAlxO5−2xNx:0.03Eu (x = 0–0.5) phosphors under a reducing atmosphere. The obtained samples presented not only broad excitation bands (ranging from 250 to 400 nm) but also tunable emission colors, originated from the characteristic emissions of Eu2+ and Eu3+. The coexistence of mixed valence states was confirmed through photoluminescence (PL) and fluorescence lifetime analysis. We investigated the effects of Al3+–N3− substitution on Sr3SiO5:Eu2+ structure by Rietveld refinement analysis. The valence change results from structural modification-induced and the valence stability of europium was explained based on crystal-site engineering. Especially, the Eu2+/Eu3+ activated Sr2.97Si1−xAlxO5−2xNx phosphors possessed additional red emissions and excellent thermal stability, which hold great prospect for w-LEDs applications.

2 Experimental section

2.1 Materials and synthesis

Sr2.97Si1−xAlxO5−2xNx:0.03Eu (x = 0–0.5) phosphors were prepared from appropriate stoichiometric mixture of SrCO3 (A. R.), SiO2 (A. R.), AlN (A. R.), and Eu2O3 (A. R.) by traditional high temperature solid-state reaction method. All raw materials were purchased commercially without further treatment. In a typical process, 0.005 mol of starting materials were weighted and mixed thoroughly in an agate mortar according to different values of x. Then the powder mixtures were annealed at 1500 °C for 6 h in a corundum crucible under the reducing atmosphere (N2/H2 = 95[thin space (1/6-em)]:[thin space (1/6-em)]5%). The as-prepared samples were cooled to room temperature naturally, and after discarding the top layer of the nongrinded products, the interior of uniform samples was ground into powder for next characterization. For comparison, samples of Sr2.97SiO5:0.03Eu3+, Sr2.97SiO5:0.03Eu3+,0.03Li+, Sr2.97Si1−xAlxO5−2xNx:0.03Eu3+ (x = 0.1) synthesized in air and Sr2.97Si1−xAlxO5−2xNx:0.03Eu3+ (x = 0.1) synthesized in N2 were also obtained under same sintered procedure.

2.2 Characterization

Crystal structure of the samples was analyzed by X-ray powder diffractometer (SHIMADZU, XRD-6000, Cu Kα radiation, λ = 0.15406 Å). The data were collected in a 2θ range from 20° to 70° with a scanning step of 0.02° and a scanning rate of 4° min−1. The powder diffraction pattern for Rietveld analysis was collected with the same diffractometer. The step size of 2θ was 0.016°, and the counting time was 1 s per step. The crystal structure parameters were obtained using UnitCell software based on the Rietveld refinement data. Room-temperature photoluminescence and photoluminescence excitation (PLE) spectra were measured with a Hitachi F-7000 (Tokyo, Japan) spectrophotometer equipped with a 150 W xenon arc lamp. Temperature-dependent (300–460 K) photoluminescence spectra were conducted using a heating apparatus (OXFORD instrument, Oxon, UK) in combination with the above Hitachi 7000 spectrophotometer. Decay curves were measured using a FSP920 Time Resolved and Steady State Fluorescence Spectrometers (Edinburgh Instruments) equipped with a 450 W Xe lamp, a 150 W nF900 flash lamp, TM300 excitation monochromator and double TM300 emission monochromators and thermo-electric cooled red-sensitive PMT.

3 Results and discussion

Fig. 1a gives the XRD patterns of the as-prepared Sr2.97Si1−xAlxO5−2xNx:0.03Eu (x = 0–0.2) phosphors synthesized by traditional solid-state reaction methods. The standard data for Sr3SiO5 phase (JCPDF card no. 26-0984) are also presented in the figure for comparison. As seen, all diffraction peaks of the samples agree well with the pure Sr3SiO5 phase, which indicate the formation of solid solutions, and suggest that the introduction of europium and AlN cannot affect the main crystal structure through partial replacement. As the XRD patterns show in ESI Fig. S1, unknown impurities (two extra diffraction peaks at 31.0° and 32.5°) began to appear when x value exceeds 0.3. Sr3SiO5 phase has a tetragonal crystal structure with space group P4/ncc and lattice constants of a = 6.948 Å, c = 10.75 Å, Z = 4. The typical crystal structure of Sr3SiO5 was exhibited in Fig. 1b: Si4+ forms one kind of tetrahedral and builds up to a SiO4 ring, and Sr2+ have two different crystal sites surrounded by SiO4 and coordinated by six O2−; the three-dimensional tetragonal crystal structure of Sr3SiO5 is further formed by sharing the O2− between SiO4 rings. It is worth noting that the octahedron of Sr2 sites has larger volume than that of the Sr1 sites.27
image file: c6ra04387a-f1.tif
Fig. 1 (a) XRD patterns of Sr2.97Si1−xAlxO5−2xNx:0.03Eu (x = 0–0.2), together with the standard data for Sr3SiO5 (JCPDF card no. 26-0984) as reference and (b) crystal structure of Sr3SiO5 and coordination environment of Sr atom.

Herein, we actually obtained Sr2.97SiO5:0.03Eu2+ (x = 0) under a reducing atmosphere of H2/N2, as previously reported.25,27,29,30 Fig. 2 shows the room-temperature excitation and emission spectra of sample Sr2.97SiO5:0.03Eu2+ (x = 0). The PLE spectrum (λem = 580 nm) spans from near-UV to visible area, which is useful for effective excitation in w-LEDs applications. And the PL spectrum (λex = 335 nm) exhibits a broad emission band peaked at 580 nm with full width at half maximum (FWHM) of 70.6 nm, attributed to typical 4f65d → 4f7 electron transitions of Eu2+ ions. After enlargement of the emission spectrum between 400 nm and 500 nm, a small emission peak at 467 nm was observed (see insert of Fig. 2). As mentioned above, there are two different crystallographic Sr2+ sites and the octahedron of Sr2 sites has larger volume than that of the Sr1 sites. Therefore, it is believed that two Eu2+ emission centers exist in Sr3SiO5:Eu2+, and most Eu2+ ions incorporate into Sr2 sites corresponding to the main emission at 580 nm.


image file: c6ra04387a-f2.tif
Fig. 2 Room-temperature PLE (λem = 580 nm) and PL (λex = 335 nm) spectra of Sr2.97SiO5:0.03Eu2+ (x = 0).

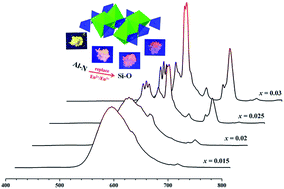
Through the crystal-site engineering approach, we introduced Al3+–N3− into Sr3SiO5 structure to replace Si4+–O2− resulting in Sr3Si1−xAlxO5−2xNx:Eu phosphors under a reducing atmosphere. We noted that a slight excess of negative charge is formed due to the substitution and the formation of Eu3+. The structure offers many mechanisms to compensate this excess charge, the most possible being slight off-stoichiometry between N3− and O2−. Although original idea of this substitution operation was only supposed to further improve the photoluminescence performances of Sr3SiO5:Eu2+ phosphor, additional narrow red emission was observed, which is unexpected but quite valuable. Because it is possible to obtain both Eu2+ and Eu3+ emissions in a single host lattice and then compensate the red emission in current w-LEDs. Fig. 3a displays the emission spectra of Sr2.97Si1−xAlxO5−2xNx:0.03Eu (x = 0–0.5) phosphors under the excitation of 340 nm. Obviously, several sharp emission bands between 570–715 nm appear with increasing x, accompanied by the broad emission bands at 580 nm of Eu2+ within 0 < x ≤ 0.03 ranges. Given the well-known characteristic 4f–4f electron transitions of Eu3+, we concluded that these narrow emissions come from Eu3+ ions, meaning the coexistence of two activators Eu3+ and Eu2+. And with more amount of AlN incorporating, the photoluminescence intensity of Eu3+ have a maximum value at x = 0.3, and the luminescence intensity of Eu2+ decrease to completely disappearing. Fig. 3b further lists the photographs and Commission International de I'Eclairage (CIE) coordinates of the selected samples (x = 0, 0.02, 0.025, 0.03, 0.1, 0.2). As shown, the luminescence colors tune from yellow to red, corresponding CIE coordinates of these samples are regularly shifted from (0.518, 0.474) to (0.630, 0.367). Apparently, the substitution of Si4+–O2− by Al3+–N3− in Sr3SiO5:Eu host compound gets the ability to fix the valence state of part europium ions as trivalent under the reducing atmosphere, and improve the photoluminescence intensity of Eu3+. In general, the utilization of crystal-site engineering approach commonly brings with the changes of coordination environment and crystal site size, which can indeed determine the valence state of activator ions and influence the photoluminescence properties of phosphors in some cases.18,31 Detailed mechanisms for the valence stability in this study will be discussed below.


image file: c6ra04387a-f3.tif
Fig. 3 (a) Emission spectra (λex = 335 nm) of Sr2.97Si1−xAlxO5−2xNx:0.03Eu (x = 0–0.5), (b) dependence of CIE chromaticity coordinates on various x values upon 340 nm excitation, and (c) PLE (λem = 619 nm) and PL (λex = 310 nm) spectra of Sr2.97Si1−xAlxO5−2xNx:0.03Eu (x = 0 and 0.1) and Sr2.94SiO5:0.03Eu3+,0.03Li+ prepared in various conditions.

First, we synthesized a series of samples with Li+ co-doping or under different atmosphere, namely, Sr2.97SiO5:0.03Eu3+, Sr2.97SiO5:0.03Eu3+,0.03Li+, Sr2.97Si1−xAlxO5−2xNx:0.03Eu3+ (x = 0.1) prepared in air and Sr2.97Si1−xAlxO5−2xNx:0.03Eu3+ (x = 0.1) prepared in N2, to investigate the effect of synthesis conditions and local charge unbalance on photoluminescence properties of phosphors. Corresponding PLE (λem = 619 nm) and PL (λex = 310 nm) spectra of these phosphors and sample Sr2.97Si1−xAlxO5−2xNx:0.03Eu (x = 0.1) prepared in N2/H2 are given in Fig. 3c. It is not hard to find that all emission spectra exhibit the same characteristic 5D07FJ (J = 1, 2, 3 and 4) line-emissions of Eu3+ ions, in which the strongest emission is located at 619 nm (5D07F2). This further confirms that the sharp red emissions in Sr2.97Si1−xAlxO5−2xNx:0.03Eu are attributed to Eu3+ ions, and also means that Eu3+ originating from raw materials Eu2O3 fail to be reduced even under the reducing atmosphere after AlN co-doping. The Li+ co-doping sample shows slightly enhanced emission compared to Sr2.97SiO5:0.03Eu3+ due to charge compensation. While the addition of AlN especially under the reducing atmosphere is able to dramatically increase the emission intensities, probably because the incorporation result in crystalline optimization and H2 can restrain the generation of defects like oxygen vacancy.32 The PLE spectra consist of three excitation peaks: the broadband (250–380 nm) with a maximum value at 310 nm corresponds to the charge transfer band (CTB) of O2− → Eu3+, and the other two peaks at 391 and 461 nm are caused by the 7F05L6 and 7F05D2 transition absorption of Eu3+ ions, respectively.33

Second, efforts have also been taken to figure out how the substitution influences the coordination environment around luminescence centers and crystal structure. As we know, the intensity ratio (R) of the electric (5D07F2) and magnetic (5D07F1) dipole allowed transitions of Eu3+ provides an easy way to assess ligand symmetry of the Eu3+-site.34 Because 5D07F2 is dependent on ligand symmetry and 5D07F1 is not, high R values typically indicate low ligand symmetry and high bond covalency. As seen in Fig. S2, a continuous increase of R (from 0.54 to 3.97) is observed with the increasing x. This observation is taken as evidence for the incorporation of Eu3+ species into a less symmetric environment with more covalent character. In Sr3SiO5:Eu2+ structure, the EuO6 octahedral neighbors with the SrO6 octahedral by linking to the SiO4 tetrahedral, which means that the (Sr,Eu)O6 octahedral is closely surrounded by SiO4 tetrahedral to form a highly condensed framework. The doping AlN into Sr3SiO5 structure was proposed to replace Si4+–O2− to form host composite Sr2.97Si1−xAlxO5−2xNx.

Detailed crystal structure change information is plotted in Fig. 4a. Based on the ions radius: r4(Si4+) = 0.26 Å, r4(Al3+) = 0.39 Å, r4(N3−) = 1.46 Å and r4(O2−) = 1.38 Å,35 the replacement of Si4+–O2− by Al3+–N3− contributes to the expansion of (Si/Al)(O/N)4 tetrahedral, which will shrink the (Sr/Eu)O6 octahedral. In the cases of Ca12Al14−zSizO32F2−z:Eu and Ca1+xY1−xAl1−xSixO4:Eu, the occupation sites of Eu3+ in CaO6F and CaO9 get to expand after corresponding substitutions, which could favor the reduction Eu3+ to Eu2+.17,18 Instead, here the shrinkage of (Sr/Eu)O6 octahedral gives rise to the possibility of the activators maintaining as Eu3+. The variation of unit cell parameters (a, b, c, V) of Sr2.97Si1−xAlxO5−2xNx:0.03Eu (x = 0–0.05) dependent on x values is given in Fig. 4b, which clearly shows that they gradually decrease with minimum values at x = 0.02 and then increase with increasing x values. The variation trend indicated the successful incorporation of AlN and formation of solid solutions of Sr2.97Si1−xAlxO5−2xNx. Since the ion radius of Eu3+ [r6(Eu3+) = 0.947 Å] is much smaller than that of Sr2+ [r6(Sr2+) = 1.18 Å] and Eu2+ [r6(Eu2+) = 1.17 Å],35 the unit cell contraction caused by the emerge of Eu3+ are predominant at the beginning, then the unit cell expansion caused by more incorporation of AlN accounted for the main, resulting in “V” type change trend of the cell parameters. Detailed XRD patterns from 30° to 31.5° also confirm this, as illustrated in Fig. S3, the diffraction peaks shift to the larger 2θ angles until x = 0.02 and then to the opposite side. From the point view of applied physics, multiple factors, such as coordination environment, crystal site size and band gap of the compound, are the reasons for valance stability of lanthanide. In theory, Dorenbos pointed that the location of the lanthanide ground-state energy relative to the Fermi energy in the un-doped inorganic compound (referred to energy difference EFf) determines the valance stability of lanthanide, assuming that the latter energy is located midway between the top of the valence band and the bottom of the conduction band.36,37 Accordingly, the crystal-site engineering approach actually results in the change of EFf and then determines the preferred valence of Eu in compound.


image file: c6ra04387a-f4.tif
Fig. 4 (a) Detailed crystal structure change information of Sr2.97Si1−xAlxO5−2xNx:0.03Eu: (Sr/Eu)O6 octahedral surrounded by (Si/Al)O4 tetrahedral, (b) dependence of unit cell parameters a, b, c, V of Sr2.97Si1−xAlxO5−2xNx:0.03Eu on x values.

In order to further understand the effect of AlN incorporation on the coordination environment of the activators, Fig. 5 depicts the lifetime decay curves for the samples Sr2.97Si1−xAlxO5−2xNx:0.03Eu (x = 0, 0.01 and 0.02), monitored at λex = 340 nm and λem = 619 nm. It is found that all decay curves can be well fitted by a second-order exponential equation38

 
I(t) = I0 + A1[thin space (1/6-em)]exp(−t/τ1) + A2[thin space (1/6-em)]exp(−t/τ2) (1)
where I(t) is the luminescence intensity at time t and I0 is the luminescence intensity initially, A1 and A2 are constants, and τ1 and τ2 are the lifetimes of the exponential components. The average lifetime τ* can be obtained by the formula as follows38
 
τ* = (A1τ12 + A2τ22)/(A1τ1 + A2τ2) (2)


image file: c6ra04387a-f5.tif
Fig. 5 Decay curves (λex = 340 nm, λem = 619 nm) of Eu in Sr2.97Si1−xAlxO5−2xNx:0.03Eu (x = 0, 0.01 and 0.02).

The decay times of Sr2.97Si1−xAlxO5−2xNx:0.03Eu (x = 0, 0.01 and 0.02) are determined to be 1.452, 1.366 and 1.388 μs, respectively, suggesting that the coordination environment around europium is indeed affected by the substitution and influences the valence stability of Eu. Fig. S4 also gives the decay curves of Sr2.97Si1−xAlxO5−2xNx:0.03Eu (x = 0.03–0.2), well fitted by eqn (1). The samples (x = 0.03–0.2) have almost same calculated lifetimes (about 1.33 μs), inducing that the coordination environment of the activators seems to no longer change, that is to say, the reduction process of Eu3+ to Eu2+ was completed at around x = 0.03.

Fig. 6 gives the PLE and PL spectra of sample Sr2.97Si1−xAlxO5−2xNx:0.03Eu (x = 0.02). PLE spectra monitored at 619 and 703 nm both show strong excitation bands around 250–350 nm, originating from the CTB of O2+–Eu3+. Yet the PLE spectrum monitored at 580 nm reveals a broad band from 250 to 500 nm with the maximum at 349 nm, attributed to the 4f7 → 4f65d1 electron transition of the Eu2+ ions. Interestingly, strong emissions of Eu2+ (4f7 → 4f65d1, broadband around 580 nm) and Eu3+ (5D07F1, 2, 3, 4, 570–590, 619, 659 and 703 nm, respectively) ions can be obtained simultaneously under the excitation of 290–350 nm ranges. This is because the excitation bands of Eu2+ and Eu3+ ions have big overlap, which is quite useful for the effective excitation for phosphors with the coexistence of Eu2+ and Eu3+ activators.


image file: c6ra04387a-f6.tif
Fig. 6 Room-temperature PLE (λem = 580, 619 and 703 nm) and PL (λex = 290–350 nm) spectra of Sr2.97Si1−xAlxO5−2xNx:0.03Eu (x = 0.02).

Due to the inevitable problems of thermal stability in high-power LEDs applications, thermal quenching behaviours of phosphors must be taken into consideration. Thus, the temperature-dependent (300–460 K) PL spectra of selected samples (x = 0, 0.02 and 0.2) were measured and given in Fig. 7. As expected, the emission intensities of all samples decline with increasing temperatures (as shown in Fig. 7a–c), resulting from the stronger nonradiative transition probability at high temperature.39 Fig. 7d gives the integrated PL intensities of these samples at different temperatures. When the temperature rises to 460 K, the integrated areas of samples x = 0, 0.02 and 0.2 (λex = 340 nm) are decreased to 71.4%, 61.8% and 34.6% of their respectively initial intensities at room temperature, suggesting the emissions of Eu2+ ions possess better thermal stability than that of Eu3+ ions. As a proof of the concept, the integrated areas of sample x = 0.02 (λex = 310 nm) at 460 K are about 55.6% of its intensity at room temperature, corresponding temperature-dependent PL spectra of sample x = 0.02 excited at 310 nm were shown in Fig. S5. To further understand the temperature dependence behaviours, the activation energy of nonradiative transition was fitted (see Fig. 7d) and calculated by Arrhenius equation40

 
I(T) = I0/[1 + C[thin space (1/6-em)]exp(−EA/kT)] (3)
where I0 and I(T) are the intensity at temperature T = 0 and T(K), respectively. k is the Boltzmann' constant while C is a rate constant for the thermally activated escape. EA is the activation energy for the thermal quenching process. Thus, the EA for samples of x = 0, 0.02 and 0.2 excited at 340 nm and sample of x = 0.02 excited at 310 nm are calculated to be 0.504, 0.395, 0.311 and 0.348 eV, respectively, which indicate relatively good thermal stability. Note that, the emission band of Eu2+ has a light blueshift from 580 nm to 575 nm with increasing temperature. This phenomenon can be ascribed to the thermally active phonon-assisted tunnelling from the excited states of the lower-energy side to those of the high-energy side in the configuration coordinate diagram.41,42


image file: c6ra04387a-f7.tif
Fig. 7 PL (λex = 310 nm and 340 nm) spectra of (a) Sr2.97Si1−xAlxO5−2xNx:0.03Eu (x = 0), (b) Sr2.97Si1−xAlxO5−2xNx:0.03Eu (x = 0.02), and (c) Sr2.97Si1−xAlxO5−2xNx:0.03Eu (x = 0.2) under various temperatures (300–460 K). (d) Dependence of integrated PL intensities on measured temperature for samples x = 0, 0.02 and 0.2.

4 Conclusions

In summary, we have successfully synthesized series of yellow-to-red emitting Sr2.97Si1−xAlxO5−2xNx:0.03Eu (0–0.5) phosphors under the H2/N2 atmosphere. In the ranges of x = 0–0.2, the samples perform as pure Sr3SiO5 phase and the CIE chromaticity coordinates can be tuned from (0.518, 0.474) to (0.630, 0.367). Within 0 < x < 0.03, two activators Eu2+ and Eu3+ coexist in compound, obviously confirmed by the photoluminescence spectra. When the x value exceeds 0.03, the phosphors exhibit extremely strong characteristic line emissions (5D07FJ, J = 1, 2, 3 and 4) of Eu3+ ions, and the emission at 619 nm of sample with x = 0.1 is nine times than that of sample Sr2.97SiO5:Eu3+ prepared in air. Meanwhile, the excitation spectra of all samples show broad excitation band varying from 250 to 400 nm, which match well with the near-UV LEDs chip. The valence state of europium dopants can be fixed as trivalent state once the replacement of Si4+–O2− by Al3+–N3− occurs, because the substitution changes the coordination environment and crystal site size of the activators based on the analysis of Rietveld refinement, photoluminescence and fluorescence lifetime. The selected phosphors of Sr2.97Si1−xAlxO5−2xNx:0.03Eu (x = 0.02, 0.2) also show a good thermal stability with activation energy of 0.395 and 0.311 eV, respectively, which quite benefits for the application in w-LEDs.

Acknowledgements

The present work was supported by the National Natural Science Foundations of China (Grant No. 51203053, 51372091), the Foundation for High-level Talents in Higher Education of Guangdong Province, the Project for Construction of High-level University in Guangdong Province, and the Teamwork Projects funded by the Guangdong Natural Science Foundation (Grant No. S2013030012842).

Notes and references

  1. R.-J. Xie and N. Hirosaki, Sci. Technol. Adv. Mater., 2007, 8, 588–600 CrossRef CAS.
  2. H. A. Höppe, Angew. Chem., Int. Ed., 2009, 48, 3572–3582 CrossRef PubMed.
  3. L. Chen, C.-C. Lin, C.-W. Yeh and R.-S. Liu, Materials, 2010, 3, 2172–2195 CrossRef CAS.
  4. B. Wang, H. Lin, J. Xu, H. Chen and Y. S. Wang, ACS Appl. Mater. Interfaces, 2014, 6, 22905–22913 CAS.
  5. Y. Wang, F. Y. Zhao, X. Q. Piao, Z. Sun, T. Horikawa and K. Machida, ECS J. Solid State Sci. Technol., 2013, 2, R131–R134 CrossRef CAS.
  6. P. Pust, V. Weiler, C. Hecht, A. Tücks, A. S. Wochnik, A. Henß, D. Wiechert, C. Scheu, P. J. Schmidt and W. Schnick, Nat. Mater., 2014, 13, 891–896 CrossRef CAS PubMed.
  7. H. Guo, X. Y. Liu, F. Li, R. F. Wei, Y. L. Wei and C. G. Ma, J. Electrochem. Soc., 2012, 159, J223–J226 CrossRef CAS.
  8. Z. X. Fu, L. Ma, S. Sahi, R. Hall and W. Chen, J. Lumin., 2013, 143, 657–662 CrossRef CAS.
  9. J. C. Zhang, Y. Z. Long, H. D. Zhang, B. Sun, W. P. Han and X. Y. Sun, J. Mater. Chem. C, 2014, 2, 312–318 RSC.
  10. M. P. Saradhi, V. Prolong, U. V. Varadaraju and B. Raveau, Chem. Mater., 2009, 21, 1793–1795 CrossRef CAS.
  11. Q. Su, H. B. Ling, T. Hu, Y. Tao and T. Liu, J. Alloys Compd., 2002, 344, 132–136 CrossRef CAS.
  12. M. Y. Peng, Z. W. Pei, G. Y. Hong and Q. Su, J. Mater. Chem., 2003, 13, 1202–1205 RSC.
  13. A. U. Pawar, A. P. Jadhav, U. Pal, B. K. Kim and Y. S. Kang, J. Lumin., 2012, 132, 659–664 CrossRef CAS.
  14. G. Zhu, Y. R. Shi, M. Mikami, Y. Shimomura and Y. H. Wang, Mater. Res. Bull., 2014, 50, 405–408 CrossRef CAS.
  15. Z. Y. Mao, D. J. Wang, Q. F. Lu, W. H. Yu and Z. H. Yuan, Chem. Commun., 2009, 346–348 RSC.
  16. Z. Y. Mao and D. J. Wang, Inorg. Chem., 2010, 49, 4922–4927 CrossRef CAS PubMed.
  17. Y. Zhang, X. J. Li, K. Li, H. Z. Lian, M. M. Shang and J. Lin, ACS Appl. Mater. Interfaces, 2015, 7, 2715–2725 CAS.
  18. K.-W. Huang, W.-T. Chen, C.-I. Chu, S.-F. Hu, H.-S. Sheu, B.-M. Cheng, J.-M. Chen and R.-S. Liu, Chem. Mater., 2012, 24, 2220–2227 CrossRef CAS.
  19. Z. G. Xia, J. Q. Zhuang and L. B. Liao, Inorg. Chem., 2012, 51, 7202–7209 CrossRef CAS PubMed.
  20. Z. G. Xia, J. Q. Zhuang, A. Meijerink and X. P. Jing, Dalton Trans., 2013, 42, 6327–6336 RSC.
  21. Y. Sato, H. Kato, M. Kobayashi, T. Masaki, D.-H. Yoon and M. Kakihana, Angew. Chem., Int. Ed., 2014, 53, 7756–7759 CrossRef CAS PubMed.
  22. S.-S. Wang, W.-T. Chen, Y. Li, J. Wang, H. S. Sheu and R.-S. Liu, J. Am. Chem. Soc., 2013, 135, 12504–12507 CrossRef CAS PubMed.
  23. Z. G. Xia, C. G. Ma, M. S. Molokeev, Q. L. Liu, K. Rickert and K. R. Poeppelmeier, J. Am. Chem. Soc., 2015, 137, 12494–12497 CrossRef CAS PubMed.
  24. J. K. Park, C. H. Kim, S. H. Park, H. D. Park and S. Y. Choi, Appl. Phys. Lett., 2004, 84, 1647 CrossRef CAS.
  25. H. S. Jang, Y.-H. Won, S. Vaidyanathan, D. H. Kim and D. Y. Jeon, J. Electrochem. Soc., 2009, 156, J138–J142 CrossRef CAS.
  26. H. D. Luo, J. Liu, X. Zheng, L. X. Han, K. X. Ren and X. B. Yu, J. Mater. Chem., 2012, 22, 15887–15893 RSC.
  27. Z. P. Ci, M. D. Que, Y. R. Shi, G. Zhu and Y. H. Wang, Inorg. Chem., 2014, 53, 2195–2199 CrossRef CAS PubMed.
  28. J. J. Chen, J. Liu, H. Yao, X. Q. Li, Z. L. Yao, H. L. Yue and X. B. Yu, J. Am. Ceram. Soc., 2015, 98, 1836–1841 CrossRef CAS.
  29. Y. Li, B. H. Li, C. C. Ni, S. X. Yuan, J. Wang, Q. Tang and Q. Su, Chem.–Asian J., 2014, 9, 494–499 CrossRef CAS PubMed.
  30. H. K. Yang, H. M. Noh, B. K. Moon, J. H. Jeong and S. S. Yi, Ceram. Int., 2014, 40, 12503–12508 CrossRef CAS.
  31. W.-Y. Huang, F. Yoshimura, K. Ueda, W. K. Pang, B.-J. Su, L.-Y. Jang, C.-Y. Chiang, W. Z. Zhou, N. H. Duy and R.-S. Liu, Inorg. Chem., 2014, 53, 12822–12831 CrossRef CAS PubMed.
  32. W. W. Ji, M.-H. Lee, L. Y. Hao, X. Xu, S. Agathopoulos, D. W. Zheng and C. H. Fang, Inorg. Chem., 2015, 54, 1556–1562 CrossRef CAS PubMed.
  33. X. Min, Z. H. Huang, M. H. Fang, Y.-G. Liu, C. Tang and X. W. Wu, Inorg. Chem., 2014, 53, 6060–6065 CrossRef CAS PubMed.
  34. G. J. Gao, S. Reibstein, M. Y. Peng and L. Wondraczek, J. Mater. Chem., 2011, 21, 3156–3161 RSC.
  35. R. D. Shannon, Acta Crystallogr., Sect. A: Cryst. Phys., Diffr., Theor. Gen. Crystallogr., 1976, 32, 751–767 CrossRef.
  36. P. Dorenbos, J. Lumin., 2005, 111, 89–104 CrossRef CAS.
  37. P. Dorenbos, Chem. Mater., 2005, 17, 6452–6456 CrossRef CAS.
  38. Z. G. Xia, M. S. Molokeev, A. S. Oreshonkov, V. V. Atuchin, R.-S. Liu and C. Dong, Phys. Chem. Chem. Phys., 2014, 16, 5952–5957 RSC.
  39. Y. Zhang, X. J. Li, K. Li, H. Z. Lian, M. M. Shang and J. Lin, J. Mater. Chem. C, 2015, 3, 3294–3303 RSC.
  40. S.-P. Lee, T.-S. Chan and T.-M. Chem, ACS Appl. Mater. Interfaces, 2015, 7, 40–44 CAS.
  41. W. G. Xiao, X. Zhang, Z. D. Hao, G.-H. Pan, Y. S. Luo, L. G. Zhang and J. H. Zhang, Inorg. Chem., 2015, 54, 3189–3195 CrossRef CAS PubMed.
  42. J. S. Kim, Y. H. Park, S. M. Kim, J. C. Choi and H. L. Park, Solid State Commun., 2005, 133, 445–448 CrossRef CAS.

Footnote

Electronic supplementary information (ESI) available. See DOI: 10.1039/c6ra04387a

This journal is © The Royal Society of Chemistry 2016
Click here to see how this site uses Cookies. View our privacy policy here.