Preparation of rutile TiO2 by hydrolysis of TiOCl2 solution: experiment and theory

Yahui Liu ab, Dawei Shaoabc, Weijing Wangab, Lingyun Yiab, Desheng Chenab, Hongxin Zhaoab, Jingyi Wude, Tao Qi*ab and Chengbo Cao*c
aNational Engineering Laboratory for Hydrometallurgical Cleaner Production Technology, Beijing 100190, PR China
bKey Laboratory of Green Process and Engineering, Institute of Process Engineering, Chinese Academy of Sciences (CAS), Beijing 100190, PR China. E-mail: tqgreen@ipe.ac.cn; Fax: +86-010-82544847; Tel: +86-010-82544847
cSchool of Chemistry and Chemical Engineering, Shandong University, Jinan 250061, China. E-mail: cbcao@sdu.edu.cn; Fax: +86-0531-88392606; Tel: +86-0531-88392606
dNational Laboratory for Molecular Sciences, Institute of Chemistry, Beijing 100190, PR China
eKey Laboratory of Molecular Nanostructure and Nanotechnology, Beijing Chinese Academy of Sciences (CAS), Beijing 100190, PR China. E-mail: wujy@iccas.ac.cn; Fax: +86-010-62652120; Tel: +86-010-62652120

Received 18th February 2016 , Accepted 16th June 2016

First published on 16th June 2016


Abstract

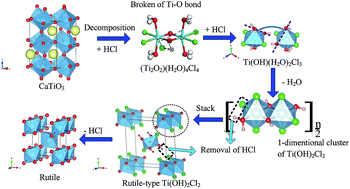
Titanium slag with a perovskite phase (CaTiO3) is difficult to use in traditional titanium dioxide production. Herein, we demonstrate that HCl can decompose CaTiO3 with a high acidolysis ratio of >97 wt% to obtain a TiOCl2 solution. With subsequent hydrolysis and calcination, rutile TiO2 was synthesised in one step without crystalline-structure transformation. As hydrolysis of the TiOCl2 solution to prepare metatitanic acid (H2TiO3) is an essential step in the process, a simulated pure TiOCl2 solution (prepared from TiCl4 and H2O) was confirmed to have the same structure in water as HCl-treated CaTiO3 slag by Raman spectroscopy. The TiOCl2 solution was also concluded to have the Ti compound cluster of (Ti2O2)(H2O)4Cl4, based on DFT calculations from the Raman data and the curve fit for the hydrolysis ratio. By elucidating the relationship between the H2TiO3 particle size and the concentration of Ti4+ and HCl, we identified the nuclear energy as -19.46 kJ mol−1. Moreover, a complete scheme for the production of rutile TiO2, induced by TiOCl2 solution hydrolysis, was proposed. Periodic structures show the feasibility of the following transformation occurring through a simple structural rearrangement: (Ti2O2)(H2O)4Cl4 (in solution)–Ti(OH)(H2O)2Cl3 (with addition of HCl)–Ti(OH)2Cl2 (1-dimentional growth and removal of HCl)–rutile-type Ti(OH)2Cl2 (stack)–rutile TiO2 (with removal of HCl).

1. Introduction

Titanium dioxide (TiO2) is widely used as a white pigment, catalyst framework, and photocatalyst.1–7 It is well known that TiO2 has three distinct crystallographic phases: rutile, anatase, and brookite.8,9 Among them, rutile TiO2 has received the highest attention in commercial preparations; it is the best white pigment for paint, plastic, paper, and cosmetics due to its lack of toxicity, high achromicity, and chemical and heat stability.7,9,10

At present, the chloride and sulfate processes are the two main industrial methods for titanium dioxide pigment production.11,12 The chloride process needs rutile (natural or synthetic) or titanium slag containing high-grade Ti and low Mg and Ca contents.13–15 The sulfate process was the first commercialised technology for making TiO2 pigments, in which ilmenite or titanium slag react with concentrated sulfuric acid (92–95%) to obtain anatase or rutile products. About 40% of the worldwide TiO2 pigment production comes from this process because of its low cost and ability to utilise a broad feedstock range. However, there are some disadvantages such as the large amounts of acidic (pH 3–5) wastewater and solid waste generated in the process that lead to serious environmental degradation.16–18

At present, titanomagnetite concentrates with high titanium contents are smelted in a blast furnace to produce cast iron and titanium slag. The titanium slag contains 22–25% TiO2 as the perovskite structure (CaTiO3).19–22 This titanium mineral and slag cannot be used in the two aforementioned industrial processes; therefore, new methods have been proposed in order to utilize them. Altair Nanomaterials Inc. (US) first produced TiO2 pigments using a hydrochloric acid process, in which ilmenite was leached with hydrochloric acid, and the resultant insoluble residue was filtered and separated.23,24 Iron powder was poured into the filtered solution to reduce Fe3+ to Fe2+, cooled to allow crystallization, and isolated to obtain FeCl2·4H2O. Separation of the titanium-containing leaching solution was achieved over two steps to obtain purified titanium chloride. After hydrolysis of the purified titanium chloride solution, metatitanic acid and other titanium dioxide products were obtained by calcining the metatitanic acid.

In Chaoyang, China, a vanadium-bearing titanomagnetite mineral with a high vanadium and titanium content is found that is smelted with additives in an electric furnace to produce cast iron and titanium slag. The titanium slag contains 40–45% TiO2 (Table 1), mainly existing as perovskite (Fig. 1). Due to the stability of the perovskite structure, refining its titanium components with the chloride or sulfate processes is difficult. Thus, an alternative route for producing TiO2 white pigments, based on an improved hydrochloric acid process, was proposed that would fully utilise the abundant titanium resources from the slag in Chaoyang. A brief flowchart of the novel process is shown in Fig. 2.

Table 1 Chemical compositions of the titanium slag (wt%)
TiO2 SiO2 CaO Al2O3 TFe MgO V2O5
41.70 14.66 9.53 5.74 5.74 1.36 0.23


image file: c6ra04386k-f1.tif
Fig. 1 XRD pattern of low-grade titanium slag.

image file: c6ra04386k-f2.tif
Fig. 2 Brief flow sheet of the TiO2 pigment production process.

The novel process for utilising the titanium slag has four key steps: (i) decomposition of the titanium slag with HCl acid at 150 °C, where titanium is converted to a TiOCl2 solution; (ii) hydrolysis, in which H2TiO3 is precipitated by heating the TiOCl2 solution; (iii) doping with additives such as K, P, Al salts to improve the TiO2 pigment performance; and (iv) calcination of H2TiO3, to obtain the rutile TiO2 pigment product.25–29

As in the sulfate process, hydrolysis is an essential step in the new process for controlling the structure of the precipitates, and further deciding the TiO2 pigment quality. However, information about hydrolysis of both TiOSO4 and TiOCl2 has rarely been reported. Many researchers proposed mechanisms of hydrolysis for a low range of titanium concentrations. Ligorio and Work30 found that in the titanyl sulfate solution, the initial Ti cluster exists as Ti(OH2)84+. Duncan and Richards31 used UV spectrum data at 220 nm to study hydrolysis kinetics; the results showed that the initial complex, Ti(OH)3(OH2)2HSO4, was hydrolysed to hydrated titanium dioxide via the Ti(OH)3+ intermediate. There are also some investigations into TiCl4 hydrolysis.32,33 West et al.34 predicted the thermochemical parameters for a number of TiOxCly intermediates using density functional theory (DFT), while Shirley et al.35 considered the possible aluminium-containing species generated from Ti2O2Cl4.

In this work, we mainly focus on the efficient use of titanium slag, as shown in Table 1 and Fig. 1. To prepare rutile TiO2 with excellent pigment properties and high yield by using this type of titanium slag, we paid more attention on improving the hydrolysis ratio of TiOCl2 solution and ensuring a suitable particle size of TiO2. The hydrolysis of a simulated TiOCl2 solution obtained from a mixture of TiCl4 and H2O was investigated. The real and simulated TiOCl2 solutions were compared by Raman spectroscopy. The nuclear energy was fitted on the basis of titanium and HCl concentrations, and H2TiO3 particle size. Moreover, the hydrolysis mechanism was postulated using both experimental and theoretical data.

2. Experimental

2.1 Preparation of titanium chloride solution

In this paper, the simulated TiOCl2 solution was obtained from the reaction between chemically pure TiCl4 and water. TiCl4 was diluted with ice-cold distilled water to prepare a simulated TiOCl2 solution (5 mol L−1). Evaporation or addition of HCl was used to decrease or increase the molar ratio of H+/Ti4+, respectively, in the simulated solution. The H+/Ti4+ molar ratio was a more important factor in the hydrolysis that was labelled as Fmol, compared with the F value (quality ratio of H2SO4/TiO2) in the sulfate process. Corresponding to the simulated solution, the acid leaching TiOCl2 solution was prepared from titanium slag (mentioned in Table 1 and Fig. 1) with 35 wt% HCl acid and liquid–solid ratio of 8[thin space (1/6-em)]:[thin space (1/6-em)]1, at 150 °C for about 2 h. ​And its chemical compositions were listed in Table 2.

2.2 Preparation of metatitanic acid

TiOCl2 solutions with different Fmol values were heated at slightly above boiling temperature (105–112 °C). The solution turned grey after <5 min, called the turbidity point. The mixture was stirred at 260 rpm for 4 h, and then cooled to room temperature, filtered, and washed with deionised water to afford metatitanic acid as the product. The hydrolysis equation is as follows:
 
TiOCl2(aq) + 2H2O(l) → H2TiO3(s) + 2HCl(aq) (1)

2.3 Preparation of rutile TiO2

H2TiO3 samples generated under different hydrolysis conditions were calcined at 530–900 °C for more than 4 h to complete the crystalline transformation to rutile TiO2 by removing chemically bound water and HCl.

The equation for H2TiO3 decomposition is as follows:

 
H2TiO3(s) → TiO2(s) + H2O(g) (2)

2.4 Characterisation

The concentrations of Ti4+ and H+ in the leaching solution and titanium chloride solution were detected by chemical titration. During those titrations, Ti4+ was first reduced to Ti3+ by an aluminium sheet and the reduced Ti3+ solution was titrated with 0.1027 mol L−1 ammonium iron(III) sulfate, with ammonium thiocyanate used as the indicator. The concentration of H+ was determined by titration with 0.2833 mol L−1 NaOH solution with methyl orange as the indicator.

The titanium chloride solution was mainly analysed by Raman spectra using a Raman spectrometer (LabRAM HR800, HORIBA Jobin Yvon, France) and excitation with the 514.5 nm line of the argon laser at 297 K.

The H2TiO3 and rutile TiO2 products were characterised by a variety of techniques, including X-ray diffraction (XRD), transmission/scanning electron microscopy (TEM/SEM), X-ray fluorescence, and a master 2000 laser particle size analyser (LPSA). SEM (JEOL JSM-6510A, Japan) equipped with energy-dispersive spectroscopy (EDS; INCA X-MAX, Oxford Instruments, UK) was used, at an accelerating voltage of 15 kV, to observe the size and morphology of the samples. The particle size distribution was measured by dynamic light scattering (DLS) using LPSA under ultrasonic agitation. Powder XRD patterns of samples were obtained with an X'Pert PRO MPD diffractometer (PANalytical, Almelo, Netherlands). XRD patterns were recorded at angles of 5–90° using Cu Kα radiation. Crystallography data analysis software (GSAS)36 was used to remove the peaks of Kα2. In order to obtain accurate crystalline information on the unit cell parameters, the GSAS-expgui37 was used to refine the XRD patterns. The average crystal size was determined from the broadening of the corresponding X-ray spectral peaks using the Scherrer formula38 (D = 0.89 λ/(β[thin space (1/6-em)]cos[thin space (1/6-em)]θ); λ = 1.54056 Å, β is the peak width at half height). The chemical composition of the samples was examined by inductively coupled plasma atomic emission spectroscopy (ICP-AES; Optima 5300DV, PerkinElmer, USA). The compositions are shown in Table 2. All crystal structures were visualised with VESTA (Visualization for Electronic and Structural Analysis) Ver. 3.0.1 software.39

Table 2 Chemical compositions of the titanium chloride solution from chloride acid decomposed process of Chaoyang titanomagnetite mineral (g L−1)
TiO2 CaO Al2O3 FeO MgO MnO V2O5
31.43 6.38 5.25 4.98 1.22 0.83 0.17


2.5 Theoretical simulations with density functional theory (DFT)

First-principles calculations were performed on the modular structures of (Ti2O2)(H2O)4Cl4, Ti(OH2)2(OH)2Cl2, and [TiO(OH2)5]2+ by using the Dmol3 software package40,41 with fine quality and geometry optimisation convergence criteria, the threshold for density convergence during the SCF minimisation of 10−6, the DNP (double-numerical with d and p polarisation) basis set, and generalised-gradient approximation (GGA) density functional Perdew–Burke–Ernzerhof (PBE).42

After full geometry optimisation, the Raman activity and intensities of vibrational modes were calculated. The Raman spectra were fitted as a function of intensity, at 297 K, incident light wavelength of 514.5 nm and smearing of 5 cm−1.

3. Results and discussion

3.1 Structure of Ti(IV) in HCl solution

The Raman spectra of three samples, including the simulated solutions and hydrochloric acid leaching solution, are shown in Fig. 3, with the three samples clearly having the same structure. The impurity (shown in Table 2) in the TiOCl2 solution does not affect the existence of the Ti4+ ion. Therefore, the simulated solution from TiCl4 diluted in water can represent a hydrochloric acid leaching solution of HCl-treated titanium slag. Moreover, Raman spectroscopy with a high detection concentration has recently been considered a useful method for analysing the structure of TiOSO4 solutions. Corresponding Raman bands were located at 84, 100–200, 405, 419, 643, and 693 cm−1. Anatase has a body-centred tetragonal structure (space group I41/amd, Z = 4) and six Raman active modes (A1g + 2B1g + 3Eg); the corresponding Raman bands were located at 144, 197, 399, 513, 519, and 639 cm−1. Brookite has an orthorhombic structure (space group Pbca, Z = 8) and 36 Raman active modes (9A1g + 9B1g + 9B2g + 9B3g); the corresponding Raman bands were located at about 150, 323, 416, and 636 cm−1. The most intensive Raman band for brookite was at 150 cm−1, which can influence the width of the E1g Raman mode at 144 cm−1 (ascribed to anatase). Rutile has a tetragonal structure (space group P42/mnm, Z = 2) and four Raman active modes (A1g + B1g + B2g + Eg); the corresponding Raman bands were located at about 145, 240, 445, and 610 cm−1. By comparing the Raman spectra, especially in the range 380–700 cm−1 (sharp peaks), we concluded that the Ti clusters in TiOCl2 solution should have the similar chemical environment or symmetry to the anatase or brookite structures. Therefore, treatment of the TiOCl2 structure in solution shows that it should have Ti–O–Ti bond. This means that Ti clusters in TiOCl2 solution should contain two or more than two Ti atoms.
image file: c6ra04386k-f3.tif
Fig. 3 Comparison of the Raman spectra between the simulated and real solution of samples: (a) 2.5 mol L−1 TiO2 (b) 0.5 mol L−1 TiO2 (c) hydrochloric acid leaching solution.

As is known, although the state of the hydrated TiO2+ ion in solution is difficult to determine, Raman spectroscopy and DFT computing are good ways to study the state of hydrated ions in solution. In this work, many structures of the hydrated TiO2+ ion were anticipated, and their Raman spectra were calculated by Dmol3 code. By comparing the Raman spectra from the experimental data of the TiOCl2 solution with those calculated from the expected structures, the forms of the hydrated TiO2+ ions present can be obtained. At present, the major problem is obtaining the expected structures.

In the current method, a series of structures for the hydrated TiO2+ ions described as TiOClx(H2O)y(OH)z need to be optimised, and the stable structures should be the most probable forms present. As this method requires huge computational resources, this method had not been chosen. We found that the Raman spectra of anatase and brookite are similar to that of the TiOCl2 solution. The periodic structures of TiOCl2·nH2O were designed based on the crystal structures of anatase and brookite, respectively. However, the calculated Raman spectra are different from the experimental data. Therefore, another method to model the structures of TiOCl2·nH2O was tried. We proposed that the crystalline structures of TiOCl2·nH2O could be used to analyse the existing forms of hydrated TiO2+ ion in the solution. However, there were no reports about the crystalline structures of TiOCl2·nH2O. By comparing the chemical formulae of TiOCl2·nH2O and Fe(H2O)Cl2·(m − 1)H2O, a series of crystalline structures for TiOCl2·nH2O could be built from Fe(H2O)Cl2·(m − 1)H2O by only removing some H+ ions. Therefore, the structures of TiOCl2·3H2O and TiOCl2·H2O can be designed based on the crystal structure of FeCl2·4H2O (space group P21/c) and that of FeCl2·2H2O (space group C2/m), respectively. The periodic structure of (Ti2O2)(H2O)4Cl4 (treated as a crystal) was then built with the space group Immm, with its initial unit cell parameters being derived from the crystal structure of FeCl2·2H2O (space group C2/m). The elements had to be changed from Fe to Ti in the crystallographic information files (CIF), the super cell was made 1 × 1 × 3, one Ti was deleted, the bridging atoms were changed from Cl to O, and then the periodic structure of (Ti2O2)(H2O)4Cl4 was finally built. Based on its crystal structure, each (Ti2O2)(H2O)4Cl4 cluster was treated as a single molecule. We recognised that the (Ti2O2)(H2O)4Cl4 cluster, where two Ti atoms were bridged with two O atoms, and coordinated to four H2O and four Cl ligands, had D2h symmetry. This structure is corresponding to our speculation from experimental data.

To examine the structure of Ti(IV) ions in water, we recorded the Raman spectra for real and calculated titanium chloride solutions (Fig. 4). The Raman spectrum of (Ti2O2)(H2O)4Cl4 cluster was calculated by Dmol3 code, and important corresponding structures are depicted in Fig. 5. Based on the calculated vibrational modes of the (Ti2O2)(H2O)4Cl4 cluster with D2h symmetry, most of the peaks are consistent with the experimental data, but there is no obvious peak 0 appearing at 251 cm−1 as in the calculated spectrum. According to the calculated result, the Ti–Cl symmetric stretching vibration (shown in Fig. 5) should be the dominant contribution to a band at this position. Therefore, the importance of the Ti–Cl bond must be lower in real life. Some of the Cl may be replaced by OH and the corresponding structure of (Ti2O2)(H2O)4Cl4−x(OH)x seems to be a more reasonable one. The peak 1 located at 385 (cal. 375) cm−1 which cannot be readily found in the calculated Raman spectrum is mainly caused by a Ti–O2 vibration. The peak 2 at 405 (cal. 402) cm−1, and peak 3 at 418 (cal. 450) cm−1 correspond with the vibrational modes of Ti–O1 shown in Fig. 5. Due to the deviation of experimental and calculated value of peak 3, we speculated that the free H+ ions in TiOCl2 solution were adsorbed by O1 in (Ti2O2)(H2O)4Cl4 and formed strong bonds as O1–H+. As we know the bond length of Ti–OH (∼2.0 Å) is much longer than that of Ti–O (∼1.9 Å), protonation of O increases the Ti–Ti distance, the Raman bad to move to lower wave number. The spectral line intensity at 643 (cal. 617) and 693 (cal. 689) cm−1 are caused by the vibration of the O2–H bond of structured water in (Ti2O2)(H2O)4Cl4 cluster.


image file: c6ra04386k-f4.tif
Fig. 4 Comparison of the Raman spectra between experimental and calculated data: (a) calculated Raman data from (Ti2O2)(H2O)4Cl4; (b) experimental Raman data of TiO2 = 2.5 mol L−1.

image file: c6ra04386k-f5.tif
Fig. 5 Vibrational modes of the important Raman peaks of (Ti2O2)(H2O)4Cl4.

3.2 Hydrolysis of TiOCl2 solution

3.2.1 Hydrolysis ratio. Fig. 6 shows the hydrolysis ratio curve of TiOCl2 with different H+ concentrations. It exhibits a regular pattern, but not as predicted, since we expected the hydrolysis ratio of TiOCl2 to decrease monotonically as the concentration of H+ increased. However, the hydrolysis ratio pattern had peaks showing the highest values at H+ concentrations of 4.17 and 4.77 mol L−1, for TiO2 concentration of 0.46 ± 0.02 mol L−1 and 0.93 ± 0.03 mol L−1; the hydrolysis ratios were highest at 71.5% and 91.6%, respectively. Therefore, we considered the (Ti2O2)(H2O)4Cl4 cluster to be very stable and difficult to aggregate in HCl solution. The addition of H+ was propitious for breaking the stable Ti–O bond and forming an active intermediate labelled as Ti(OH)(H2O)2Cl3 (shown as chemical reaction (3)). Using the hydrolysis process of chemical reaction (4), the single Ti atom cluster of Ti(OH)(H2O)2Cl3 could be aggregated by removing HCl. Further aggregation and rearrangement may have taken place between the active clusters of Ti(OH)2Cl2. We concluded that an intermediate rutile-like structure of Ti(OH)2Cl2 may have existed.
 
n/2(Ti2O2)(H2O)4Cl4 + nHCl → nTi(OH)(H2O)2Cl3 (3)
 
nTi(OH)(H2O)2Cl3 → [Ti(OH)2Cl2]n + nHCl (4)
 
[Ti(OH)2Cl2]n → [TiO2]n + 2nHCl (5)

image file: c6ra04386k-f6.tif
Fig. 6 The relationship between hydrolysis ratio and the concentration of H+ (before hydrolysis). (a) The concentration of TiO2 is 0.93 ± 0.03 mol L−1; (b) the concentration of TiO2 is 0.46 ± 0.02 mol L−1.
3.2.2 Particle size of hydrated TiO2. The TiO2 samples were obtained by drying the precipitated hydrated TiO2 at 80 °C to remove the adsorbed water and make the XRD peaks sharper and more intense. In this work, all the TiO2 samples exhibited the rutile TiO2 phase.

The calculated lattice parameters for rutile phase hydrated TiO2 are a = b = 4.612–4.624 Å and c = 2.956–2.962 Å. Table 3 shows the detailed parameters of hydrated TiO2 in the rutile phase. The crystallite size (crystalline grain) of nuclei measurements was calculated from XRD patterns using the Scherrer equation (see Section 2.4). The average particles D(0.5) of the agglomerated precipitate from solution were found to be 1–24 μm by a LPSA.

Table 3 The parameters of unit cell and crystalline grain under different initial concentration of TiO2a
Rwp (%) Rp (%) a (Å) b (Å) c (Å) A (nm) B (nm) C (nm) S (nm2) n D(0.5) (μm) CH+ (mol L−1) CTiO2 (mol L−1)
a The parameter n representatives the number of TiO2 in a crystal particle (similar to Z value), n = Z(ABC)/(abc) A, B and C are the crystalline grain parameters calculated by Scherrer equation. S is the surface of crystalline grain, S = 2(AB + AC + BC).
The initial concentration of TiO2 is 0.93 ± 0.03 mol L−1
5.14 3.51 4.615 4.615 2.957 3.121 3.121 7.642 114.884 2364 23.71 6.13 0.701
6.11 4.05 4.612 4.612 2.956 3.701 3.701 8.519 163.592 3712 22.18 5.82 0.313
6.03 4.05 4.621 4.621 2.958 3.915 3.915 8.489 153.510 4120 21.12 5.22 0.137
6.36 4.23 4.617 4.617 2.962 4.049 4.049 9.018 178.844 4683 6.827 4.02 0.091
6.04 4.25 4.614 4.614 2.958 5.118 5.118 10.215 261.509 8498 1.257 3.24 0.115
[thin space (1/6-em)]
The initial concentration of TiO2 is 0.46 ± 0.02 mol L−1
7.13 4.39 4.624 4.624 2.960 4.268 4.268 10.254 211.488 5903 14.58 5.65 0.305
6.80 4.33 4.616 4.616 2.960 3.780 3.780 9.579 173.411 4340 10.16 4.78 0.190
6.42 4.29 4.621 4.621 2.961 3.921 3.921 9.242 175.700 4494 11.62 3.79 0.141
5.84 3.99 4.621 4.621 2.959 5.147 5.147 9.767 254.066 8190 4.600 2.80 0.151
5.41 3.79 4.622 4.622 2.957 5.136 5.136 8.933 236.277 7460 5.129 1.69 0.176


On the basis of chemical reactions (3)–(5), and the Gibbs free energy formula (6), the formula (7) can be obtained as follows:

 
ΔG = −RT[thin space (1/6-em)]ln[thin space (1/6-em)]k + sl (6)
 
ΔG = −RT(2[thin space (1/6-em)]ln[H+] − ln[Ti4+]) + sl (7)
where, ΔG = Gibbs free energy, R = ideal gas constant, T = temperature, S = surface of crystalline nuclei, γsl = surface tension between the solution and the nuclei.

Based on formula (7), we calculated ΔG and γsl, shown in Fig. 7, as equal to the intercept of a and the slope of –b, respectively. Therefore, ΔG was −19.46 ± 1.70 kJ mol−1 and γsl was 0.0237 ± 0.0085 kJ mol−1 nm−2 (=3.93 ± 1.41 × 10⁻⁵ Nm−1). Some points in Fig. 7 were excluded, due to some concentrations of H+ and TiO2 giving rise to unusual values. From the data in Table 4, the removed point at 114.884 nm2 can be calculates as corresponding to concentrations of H+ and TiO2 of 6.13 and 0.701 mol L−1, respectively. The other removed point at 236.277 nm2 has H+ and TiO2 concentrations of 1.69 and 0.176 mol L−1, respectively. At the two removed points, the Fmol values are 8.74 and 9.20 which are much lower than the other values of 18.5–44.18. It is clear that the Fmol values obtained after the hydrolysis process were nearly ranged in the left side separated by a dotted line in Fig. 6. As it was mentioned in Fig. 5, some Ti4+ ions in the solution should not be treated as the hydrate structure with only one Ti atom, but as containing two Ti atoms. Therefore, the formula (7) needed to be adjusted, and some hydrated Ti4+ ions with the Ti(OH)2Cl2 structure transform to that of (Ti2O2)(H2O)4Cl4. However, the mole ratio of Ti(OH)2Cl2 to (Ti2O2)(H2O)4Cl4 is difficult to obtain. Therefore, we excluded the two aberrant points.


image file: c6ra04386k-f7.tif
Fig. 7 The linear fitting between the superficial area of particle grain and Gibbs free energy of chemical reaction.
Table 4 The chemical composition of the sample (wt%)
TiO2 Al2O3 CaO P2O5 SiO2 Cl
99.44 0.276 0.091 0.044 0.041 0.058


The average particle size, D(0.5), of TiO2 gradually decreased with increasing n value, and a D(0.5) of 1.257 μm indicated a narrower particle size distribution than that obtained under other conditions. The appropriate particle size and narrow particle size distribution were also beneficial for improving the pigment properties of TiO2. However, the hydrolysis ratio of the TiOCl2 solution under these conditions was only about 23.7%. For the highest hydrolysis ratio with different concentrations of Ti4+, the n value was about 4000, with an average particle size D(0.5) of about 10–20 μm, which was much higher than the optimum particle size. Therefore, balancing the relationship between D(0.5) and the hydrolysis ratio was the key issue for preparing useful rutile TiO2 pigments.

3.3 Preparation of rutile TiO2

The acid leaching TiOCl2 solution (real solution) with CTi4+ = 0.92 mol L−1 and CH+ = 6.01 mol L−1 were hydrolyzed at boiling temperature for 4 hours. After calcination of rutile-type TiO2·nH2O, samples that were not doped and coated contained more than 99 wt% of TiO2. As shown in Table 4, the composition of samples prepared in this work met the commercial requirements of pigments. However, this kind of sample did not have properties suitable for use as pigment. It is well known that the samples with good crystallinity exhibit excellent refrangibility (rutile > 1700, anatase > 1250) and that the optimum particle size for TiO2 pigments is between 0.2 and 0.3 μm (half the visible wavelength). In the sulfate processes, high temperatures (>900 °C) make anatase transform to rutile. In this work, we did not need to consider this conversion because most of the hydrolysed TiO2·nH2O exhibited the rutile phase, but both the crystallinity and size distribution of the samples was highly affected by calcination temperature. The effects of temperature were investigated by comparing the size of particle grains under different initial concentrations of Ti4+ and H+. The results in Table 5 show that larger particle grains were obtained on increasing the temperature at CTi4+ = 0.908 mol L−1 and CH+ = 3.47 mol L−1. It was also found that the calcined product exhibited a typical mesoporous structure, as detected by SEM (Fig. 8(b)). The mesoporous structure should be direct evidence of the migration pathway generated by HCl.
Table 5 The parameters of unit cell and crystalline grain under different temperaturea
Temperature (°C) Rwp (%) Rp (%) a (Å) b (Å) c (Å) A (nm) B (nm) C (nm) Diameter (μm)
a Diameters were measured by SEM.
530 6.55 4.46 4.5928 4.5928 2.9571 12.396 12.396 16.009 0.3–1
630 6.46 4.42 4.5962 4.5962 2.9593 18.308 18.308 22.318 4–6
830 7.77 5.27 4.5972 4.5972 2.9606 54.627 54.627 67.365 6–10
900 8.21 6.26 4.6001 4.6001 2.9625 132.247 132.247 190.657 6–9


image file: c6ra04386k-f8.tif
Fig. 8 SEM image of rutile TiO2 calcinates at 830 °C.

3.4 Formation mechanism of hydrated titanium dioxide

According to Wang43 and Zheng44 reports, when the concentration of HCl is low, rutile is the prominent crystalline phase. They found that [TiO(OH2)5]2+ monomer45 should be the dominant structure in TiOCl2 solution when CHCl < 2 mol L−1. In this way, octahedral TiO6 corner/edge-sharing structure can be formed, which leads to the rutile phase. If CHCl > 3 mol L−1, Ti(OH)2Cl2(H2O)2 (ref. 46) is the dominant structure, which then aggregates to form the anatase phase. Their study showed that rutile can be formed with low concentration of HCl but it can be converted to anatase by increasing the concentration of HCl. However, according to Cheng's report,47 [Ti(OH)mCln]2− (n + m = 6) is the reasonable structure in TiOCl2 solution, and n and m are determined by the acidity and concentration of Cl anions. As the acidity in TiOCl2 solution increases, the number of OH ligands in [Ti(OH)nClm] decreases, leading to the aggregation of Ti clusters where octahedral TiO6 corner/edge-sharing structures are more probable than octahedral TiO6 edge-sharing structures. Therefore, higher acidity and concentrations of TiOCl2 could be beneficial for the formation of the rutile TiO2 phase. Unfortunately, different researchers who have investigated the influence of acidity have obtained different results. To better explain the experimental results, we proposed a novel mechanism for hydrolysis of TiOCl2 solutions as follows.

The Raman spectra displayed in Fig. 4 show that the Ti4+ ion in TiOCl2 solution occurs in the stable (Ti2O2)(H2O)4Cl4 structures. Based on the Ti2O2Cl4 cluster (point group: D2h) reported by Shirley et al.,35 we proposed a similar structure for (Ti2O2)(H2O)4Cl4 in solution, as discussed in Section 3.1. In order to simplify the postulated reaction pathway from (Ti2O2)(H2O)4Cl4 to TiO2, a series of periodic structures are described in Fig. 9 (e.g. the cluster of (Ti2O2)(H2O)4Cl4 shown in Fig. 5 can be expressed as Fig. 9(a)). When HCl is removed from between the adjacent (Ti2O2)(H2O)4Cl4 moieties, the anatase structure forms due to TiO6 edge-sharing. Because the clusters of [(Ti2O2)(H2O)4Cl4−m]m+ and [(Ti2O2)(H2−nO)4Cl4]4n are generated rapidly due to ionisation reactions, the reaction kinetics play significant roles. A high concentration of the (Ti2O2)(H2O)4Cl4 cluster is beneficial for the formation of the anatase TiO2 phase. Moreover, the size of generating nuclei should be smaller. Under hydrolysis by adding H+, some Ti–O bonds in (Ti2O2)(H2O)4Cl4 (Fig. 9(a)) break, leading to the formation of the active cluster. In this work, we supposed that Ti(OH)(H2O)2Cl3 (Fig. 9(b)) was the intermediate phase in the formation process of the 1-dimensional periodic structure, Ti(OH)2Cl2 (Fig. 9(c)). The 1-dimensional periodic structure of Ti(OH)2Cl2 can stack to rutile-type Ti(OH)2Cl2 (Fig. 9(d)). Further aggregation and removal of HCl may have taken place between adjacent Ti(OH)2Cl2 complexes. It is well known that both anatase and rutile TiO2 phases can grow from octahedral TiO6 complexes, and that the phase transition proceeds by octahedral rearrangement. The arrangement of octahedral TiO6 through edge-sharing initiates the anatase phase, while corner/edge-sharing leads to the rutile phase. In this system, rutile-type Ti(OH)2Cl2 easily lost Cl and H from the –OH groups of adjacent Ti(OH)2Cl2 to form rutile-type H2TiO3. Therefore, the intermediate structure of Ti(OH)2Cl2 determines the final crystal structures of TiO2. Under high acidity, (Ti2O2)(H2O)4Cl4 should easily form Ti(OH)2Cl2, and Ti(OH)2Cl2 should also easily convert to rutile-type Ti(OH)2Cl2. Thus, higher acidity of TiOCl2 should be beneficial for the formation of a rutile TiO2 phase. Moreover, the size of generating nuclei should be bigger. After calcination of rutile-type H2TiO3, we found mesoporous structures by SEM (Fig. 8(b)); therefore, intermediate rutile-type structure of Ti(OH)2Cl2 may also exist. Moreover, we expected the unit cell parameters to decrease with higher calcination temperatures due to the removal of HCl from rutile-type Ti(OH)2Cl2 (in this work, the predicted unit cell parameters for rutile-type Ti(OH)2Cl2 of a = b = 9.273 Å and c = 3.210 Å were larger than that of rutile TiO2, with a = b = 4.59 Å and c = 2.96 Å). This contradiction in experimental findings, shown in Table 5, most likely occurred because the calcination temperatures of 530–900 °C were too high, causing nearly all Cl to be eliminated. Table 5 shows that the size of the crystal grain clearly becomes larger with increasing temperature.


image file: c6ra04386k-f9.tif
Fig. 9 The schematic diagram of the hydrolysis process. (a) Cluster of (Ti2O2)(H2O)4Cl4; (b) the intermediate cluster of Ti(OH)(H2O)2Cl3; (c) 1-dimensional periodic structure of Ti(OH)2Cl2; (d) rutile-type Ti(OH)2Cl2; (e) rutile TiO2.

4. Conclusions

The Raman spectra of Ti(IV) structures in HCl solution have been studied in close comparison with DFT calculations. Ti(IV) was stable, existing with two Ti atoms in a cluster and forming a (Ti2O2)(H2O)4Cl4 structure with D2h symmetry. By determining the relationship between the surface area of H2TiO3 and the concentrations of Ti4+ and HCl, we identified that the nuclear energy was −19.46 kJ mol−1. Moreover, a complete scheme for the formation and transformation of rutile, TiO2, induced by the hydrolysis of a TiOCl2 solution, was proposed. Using DFT simulations, it was shown that the periodic structure can lead to this transformation occurring through a simple structural rearrangement, as follows: (Ti2O2)(H2O)4Cl4 (in solution)–Ti(OH)(H2O)2Cl3 (with addition of HCl)–Ti(OH)2Cl2 (1-dimentional growth and removal of HCl)–rutile-type Ti(OH)2Cl2 (stack)–rutile TiO2 (with removal of HCl).

Acknowledgements

The authors would like to thank National Supercomputing Center in Shenzhen for providing the computational resources and materials studio (version 6.1, MS Dmol3 Parallel). We gratefully acknowledge support from the Major State Basic Research Development Program of China (Grant No. 2013CB632604), National Science Foundation for Distinguished Young Scholars of China (Grant No. 51125018), and National Natural Science Foundation of China (Grant No. 51402303, 21403243, 51504230, 21506233).

Notes and references

  1. M. Anpo, T. Shima, S. Kodama and Y. Kubokawa, J. Phys. Chem., 1987, 91, 4305–4310 CrossRef CAS.
  2. U. Diebold, Surf. Sci. Rep., 2003, 48, 53–229 CrossRef CAS.
  3. W. P. Hsu, R. Yu and E. Matijević, J. Colloid Interface Sci., 1993, 156, 56–65 CrossRef CAS.
  4. J. Karch, R. Birringer and H. Gleiter, Nature, 1987, 330, 556–558 CrossRef CAS.
  5. P. A. Mandelbaum, A. E. Regazzoni, M. A. Blesa and S. A. Bilmes, J. Phys. Chem. B, 1999, 103, 5505–5511 CrossRef CAS.
  6. B. O'regan and M. Grätzel, Nature, 1991, 353, 737–740 CrossRef.
  7. R. Wang, K. Hashimoto, A. Fujishima, M. Chikuni, E. Kojima, A. Kitamura, M. Shimohigoshi and T. Watanabe, Nature, 1997, 388, 431–432 CrossRef CAS.
  8. N. N. Greenwood and A. Earnshaw, Chemistry of the Elements, Elsevier, 2012 Search PubMed.
  9. Y. Li, Y. Fan and Y. Chen, J. Mater. Chem., 2002, 12, 1387–1390 RSC.
  10. E. Stathatos, P. Lianos, F. Del Monte, D. Levy and D. Tsiourvas, Langmuir, 1997, 13, 4295–4300 CrossRef CAS.
  11. J. Barksdale, Titanium: its occurrence, chemistry, and technology, Ronald Press Co., 1966 Search PubMed.
  12. Y. Wang, J. Li, L. Wang, T. Qi, D. Chen and W. Wang, Chem. Eng. Technol., 2011, 34, 905–913 CrossRef CAS.
  13. C. Li, B. Liang and H. Wang, Hydrometallurgy, 2008, 91, 121–129 CrossRef CAS.
  14. S. Middlemas, Z. Z. Fang and P. Fan, Hydrometallurgy, 2013, 131, 107–113 CrossRef.
  15. W. Zhang, Z. Zhu and C. Y. Cheng, Hydrometallurgy, 2011, 108, 177–188 CrossRef CAS.
  16. A. L. Dann, R. S. Cooper and J. P. Bowman, Water Res., 2009, 43, 2302–2316 CrossRef CAS PubMed.
  17. B. Liang, C. Li, C. Zhang and Y. Zhang, Hydrometallurgy, 2005, 76, 173–179 CrossRef CAS.
  18. X. Xiong, Z. Wang, F. Wu, X. Li and H. Guo, Adv. Powder Technol., 2013, 24, 60–67 CrossRef CAS.
  19. D. s. Chen, B. Song, L. n. Wang, T. Qi, Y. Wang and W.-j. Wang, Miner. Eng., 2011, 24, 864–869 CrossRef CAS.
  20. J. Deng, X. Xue and G.-g. Liu, J. Mater. Metall., 2007, 6, 83 CAS.
  21. W. G. Fu, Y. C. Wen and H. E. Xie, J. Iron Steel Res. Int., 2011, 18, 7–18 CrossRef CAS.
  22. S. Wang, G. Li, T. Lou and Z. Sui, ISIJ Int., 1999, 39, 1116–1119 CrossRef CAS.
  23. W. P. Duyvesteyn, B. J. Sabacky, D. E. V. Verhulst, P. G. West-Sells, T. M. Spitler, A. Vince, J. R. Burkholder and B. J. P. M. Huls, US Pat., 6375923, 2002.
  24. W. P. Duyvesteyn, T. M. Spitler, B. J. Sabacky and J. Prochazka, US Pat., 6440383, 2002.
  25. U. Gesenhues, Chem. Eng. Technol., 2001, 24, 685–694 CrossRef CAS.
  26. B. Grzmil, D. Grela, B. Kic and M. Podsiadły, Pol. J. Chem. Technol., 2008, 10, 4–12 CAS.
  27. B. Grzmil, M. Rabe, B. Kic and K. Lubkowski, Ind. Eng. Chem. Res., 2007, 46, 1018–1024 CrossRef CAS.
  28. J. P. Jalava, Ind. Eng. Chem. Res., 1992, 31, 608–611 CrossRef CAS.
  29. N. S. Subramanian, P. L. Gai, R. B. Diemer Jr, A. Allen and J. S. Gergely, US Pat., 5922120, 1999.
  30. C. Ligorio and L. Work, Ind. Eng. Chem., 1937, 29, 213–217 CrossRef CAS.
  31. J. Duncan and R. Richards, N. Z. J. Sci., 1976, 19, 179–183 CAS.
  32. R. H. West, M. S. Celnik, R. Inderwildi, M. Kraft, G. J. O. Beran and W. H. Green, Ind. Eng. Chem., 2007, 46, 6147–6156 CrossRef CAS.
  33. T. H. Wang, A. M. Navarrete-Lopez, S. G. Li, D. A. Dixon and J. L. Gole, J. Phys. Chem. A, 2010, 114, 7561–7570 CrossRef CAS PubMed.
  34. R. H. West, G. J. O. Beran, W. H. Green and M. Kraft, J. Phys. Chem. A, 2007, 111, 3560–3565 CrossRef CAS PubMed.
  35. R. Shirley, Y. Y. Liu, T. S. Totton, R. H. West and M. Kraft, J. Phys. Chem., 2009, 113, 13790–13796 CrossRef CAS PubMed.
  36. A. Larson and R. Von Dreele, Los Alamos National Laboratory, NM, 1994 Search PubMed.
  37. B. H. Toby, J. Appl. Crystallogr., 2001, 34, 210–213 CrossRef CAS.
  38. A. Patterson, Phys. Rev., 1939, 56, 978 CrossRef CAS.
  39. K. Momma and F. Izumi, J. Appl. Crystallogr., 2008, 41, 653–658 CrossRef CAS.
  40. B. Delley, J. Chem. Phys., 1990, 92, 508–517 CrossRef CAS.
  41. B. Delley, J. Chem. Phys., 2000, 113, 7756–7764 CrossRef CAS.
  42. J. P. Perdew, K. Burke and M. Ernzerhof, Phys. Rev. Lett., 1996, 77, 3865 CrossRef CAS PubMed.
  43. H. M. Wang, X. Tan and T. Yu, Appl. Surf. Sci., 2014, 321, 531–537 CrossRef CAS.
  44. W. J. Zheng, X. D. Liu, Z. Y. Yan and L. J. Zhu, ACS Nano, 2009, 3, 115–122 CrossRef CAS PubMed.
  45. Y. Q. Zheng, E. W. Shi, Z. Z. Chen, W. J. Li and X. F. Hu, J. Mater. Chem., 2001, 11, 1547–1551 RSC.
  46. C. Chanéac, E. Tronc, L. Mazerolles and J. P. Jolivet, J. Mater. Chem., 2001, 11, 1116–1121 RSC.
  47. H. Chen, J. M. Ma, Z. G. Zhao and L. M. Qi, Chem. Mater., 1995, 7, 663–671 CrossRef.

Footnote

These authors contributed to this work equally.

This journal is © The Royal Society of Chemistry 2016
Click here to see how this site uses Cookies. View our privacy policy here.