Biomineralization on single crystalline rutile: the modulated growth of hydroxyapatite by fibronectin in a simulated body fluid

Yixiao Cai , Hu Li, Mikael Karlsson, Klaus Leifer, Håkan Engqvist and Wei Xia*
Applied Materials Science, Department of Engineering Sciences, Ångström Laboratory, Uppsala University, Uppsala, Sweden. E-mail: wei.xia@angstrom.uu.se

Received 17th February 2016 , Accepted 5th April 2016

First published on 6th April 2016


Abstract

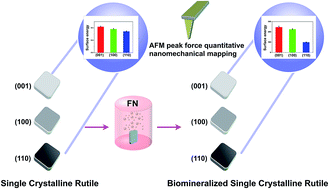
The aim of this study is to probe the complex interaction between surface bioactivity and protein adsorption on single crystalline rutile. Our previous studies have shown that single crystalline rutile possessed in vitro bioactivity and the crystalline faces affected the hydroxyapatite (HA) formation. However, upon implantation, a fast adsorption of proteins, from the biological fluids, is intermediated by a water layer towards the biomaterial interface. Thus the effect of protein on the bioactivity must be addressed. In this study, the HA growth dynamics on (001), (100) and (110) faces was investigated in a simulated body fluid with the presence of fibronectin (FN) by two different processes. The surface adhesion of each face before and after FN adsorption, as revealed by direct numerical values, was determined by atomic force microscopy (AFM) based peak force quantitative nanomechanical mapping (PF-QNM) for the first time. The findings suggest the surface energies of FN pre-adsorbed (001), (100) and (110) faces have been enhanced, leading to the subsequent accelerated HA formation. Furthermore, (001) and (100) faces were found to have larger coverage of HA crystals than (110) face at an early stage. In addition, various characterizations were performed to probe the chemical and crystal structures of as-grown biomimetic HA crystals, and in particular, the Ca/P ratio variations at different soaking time points.

1. Introduction

The repair or regeneration of fractured or diseased bone tissue is a worldwide health care problem. Efforts have been made to improve the biological functionality of bone implant interfaces.1 Kay et al. have reported the clinical experience using hydroxyapatite (HA) coated implants in the 1980s.2 HA coatings on implants have shown good fixation to the host bone and act as a bonding layer between bone and implant, which is particularly important for the osseointegration and long-term implant stability. In this sense, it is desirable to design biomaterials which can enhance the process of biomineralization at the implant surface to form a strong bone implant interface.3

Titanium implants form an oxide layer, that interacts with tissue, when the outermost surface is exposed to air.4–6 Titanium dioxide has two bioactive crystal structures, anatase and rutile.7 Surface atomic configuration of titanium dioxide is pivotal in determining the physicochemical properties such as light absorption and reactive selectivity.8,9 Polycrystalline titanium dioxide, well-known as a bioactive material, has been proved to be bioactive due to the presence of hydroxyl groups on the surface that can induce HA formation from body fluids.10,11 Single crystalline rutile photocatalytic and photoelectrochemical properties have been extensively studied.12–14 However, few studies involving their bioactivity and bio-compatibility have been reported. Lindberg et al.15 studied HA growth on different facets of single crystalline rutile, indicating the specific orientation of the HA precipitate nucleus on the (001) face leads to a faster coverage when compared to the (110) and (100) faces. Lindahl et al.16 studied the dynamics at the early stages of HA growth, a crucial process which would determine the osseointegration of titanium implants. These two studies could be concomitantly used to further deepen the understanding of bioactive rutile surfaces. However, upon implantation the cell–substrate interaction never occurs directly with the bare surface of the material but through the extracellular matrix (ECM) biomacromolecules (e.g. proteins, polysaccharides, proteoglycans), which are intermediated by a water layer17–19 and adsorb onto the implant surface by exposure to biological fluids.20–22 Mann et al. demonstrated the protein types and hierarchical structures are key features of the preorganization required for controlled inorganic nucleation.23 Indeed, the types and the amounts of adsorbed proteins determine the availability of the bioactive sites that could be decisive for cell–substrate interactions. The characteristics, including orientation, conformation, packing density of the adsorbed proteins determine whether the bioactive sites are recognized by the membrane-bound receptors, through which the cells interrogate their surroundings.24 In this sense, what has been addressed previously has been limited to study HA growth on single rutile crystals in a pure inorganic solution. This is not sufficient to mimic a biomimetic mineralization.

As an abundant extracellular matrix glycoprotein, fibronectin (FN) is found in connective and calcified tissues. FN is hydrophilic and actively participating in cell adhesion, spreading, wound healing, cytoskeletal reorganization and bone tissue formation.25–27 The interaction of FN with HA plays a significant role within bone tissue and the osseointegration of implants.28,29 Interestingly, Couchourel et al.30 reported FN could inhibit HA precipitation in biological fluids, while stimulated crystal formation in gel once HA powder was present. Thus it is of great importance to know how proteins modulate the biomineralization of implant surfaces, especially for certain crystal faces. The knowledge of biomineralization on different crystal faces can help for design and prepare better bioactive ceramic materials. By focusing on a single protein, the simplicity of such system allows us to begin unraveling the complex interfacial reactions occurring between the surface bioactivity and biomimetic surroundings. Besides, since the bioactivity of different crystalline facets in a biomimetic system containing proteins is still not fully understood, the focus on how single protein modulates biomineralization would provide evidence and significance.

The objectives of this study were: (i) to investigate the effect of pre-adsorbed FN on different single rutile faces then observe the surface bioactivity by using a simulated body fluid (SBF); and (ii) to investigate the biomineralization by mixing FN in SBF and compare biomineralization dynamics in above two processes.

2. Experimental section

2.1. Materials and chemicals

The single rutile crystals including (001), (100) and (110) faces were purchased from MTI Corporation (Richmond, California). All the analytical grade chemicals and bovine plasma fibronectin (F1141) for preparing the solutions were purchased from Sigma-Aldrich.

2.2. Surface preparation of single rutile crystals

The single rutile crystals with dimensions 5 mm × 5 mm × 0.5 mm were cleaned before use. Initially, each face was carefully washed ultrasonically with 0.5 M HCl and milliQ water. After dried in a flow of nitrogen gas, the crystals were polished with a 1 μm diamond paste on acetate cloth (Struers, Inc.) for 3 × 2 min. Then each face was again ultrasonically cleaned in ethanol and milliQ water, and placed in a separate Petri dish. All the crystals were treated in UV-ozone for 1 hour and stored for further use. Between and after different experimental sets, sufficient washing was taken to reproducibly obtain a clean surface. The cleaning process of single rutile surface aimed to remove contaminants, as detected by high resolution scanning electron microscopy (SEM) and later AFM analyses.

2.3. Preparation of FN, SBF, and SBF containing FN solutions

Three solutions were used in this study: the protein solution was used without further purification and prepared by weighing and dissolving 200 μg mL−1 of FN into MilliQ water. The prepared concentration is close to the level of normal human serum FN.31 Simulated body fluid (SBF) was prepared as Kokubo et al. proposed.32 Basically, chemicals of NaCl, NaHCO3, KCl, K2-HPO4·3H2O, MgCl2·6H2O, CaCl2, and Na2SO4 were dissolved in deionized water. (CH2OH)3CNH2 and (CH2–OH)3CNH2HCl and 1 M HCl were used to buffer the pH at 7.40. The resulting ion concentrations were: Na+ (142.0 mM), K+ (5.0 mM), Mg2+(1.5 mM), Ca2+ (2.5 mM), Cl(148.8 mM), HCO3− (4.2 mM), HPO42− (1.0 mM), SO42− (0.5 mM). For the last type of solution, a concentration of 200 μg mL−1 FN was added in SBF.

2.4. In vitro study of biomineralization on single rutile surfaces

The study involved two different biomineralization processes, which individually performed on (001), (100) and (110) faces, as shown in Fig. 1. In process I, each single crystalline surface was soaked in a 10 mL of SBF containing FN for 1 week and 4 weeks. In process II, each surface was firstly soaked in a 10 mL FN solution for 2 hours and gently rinsed with deionized water to remove loosened adsorbed protein. Then, a 10 mL SBF was used for 1 and 4 weeks. In order to compensate the consumption of FN and ions in the soaking medium, the soaking solution was replaced every day. Each single crystalline surface was placed vertically with a top lid and the temperature was kept at 37 °C. After each biomineralization time point (1 week and 4 weeks) the surfaces were carefully rinsed by deionized water. After that, all the crystals were dried in air for further characterization. For AFM measurements, after immersing in FN solution for 2 hours, the surfaces were rinsed in water to remove loosely adsorbed protein, then dried and stored before further use.
image file: c6ra04303h-f1.tif
Fig. 1 Schematic illustration of two biomineralization processes on (001), (100) and (110) single crystalline rutile surfaces.

2.5. Characterizations

Before soaking, Raman analysis was performed on all single crystalline surfaces, by using a Renishaw Ramascope equipped with a Leica LM optical microscope, a CCD camera and an Argon ion laser (λ = 532 nm) source. Calibration was performed using a piece of Si wafer. Analyses of bare and FN pre-adsorbed single rutile surfaces, including surface topography and adhesion force, were investigated in a Bruker Multimode 8 AFM under PeakForce Quantitative Nanomechanical Property Mapping (PF-QNM) mode, by utilizing a silicon tip (radius of 3 nm, spring constant of 0.4 N m−1) in all measurements. The surface roughness was obtained from a scanning area of 1000 × 1000 nm2 using the Nanoanalysis software and the value of root-mean-square roughness (Rq) was used to characterize the surface topography. The adhesion force that refers to the maximum adhesion force derived from the AFM force volume curve between the AFM tip and specimens. Each image consists of 512 pixels × 512 pixels, which means that the contrast in adhesion force mapping images is based on more than 250[thin space (1/6-em)]000 individual nanoindentations. Interfacial energies of each face with the AFM tip were calculated according to Derjagin-Muller-Toropov model and the specimen size is based on more than 250[thin space (1/6-em)]000 nanoindentations for each face.33–35 After 4 weeks by being soaked in process II, the single crystalline rutile substrates were analyzed by using grazing incidence X-ray diffraction (GIXRD; Siemens Diffractometer 5000) with Cu Kα radiation (λ = 1.541 Å) as the source operating at 45 kV and 40 mA with the incidence angle 1°. All surface morphologies were detected by SEM (FESEM, Merlin) equipped with an energy-dispersive X-ray (EDX) spectrometer operating at 15 kV. Based on SEM images, sizes of biomimetic HA crystals formed on different faces were determined by ImageJ software (NIH, USA). A minimum of 300 as-grown HA crystals were collected and counted for the average size. The EDX mapping illustrations of calcium and phosphorus were performed on both processes after 4 weeks. In order to provide more localized elemental information, a number of spots were conducted to investigate the variations of Ca/P on the biomineralized surface. Moreover, the topmost surface composition and Ca/P ratio for (001), (100) and (110) faces being soaked in process I after 4 weeks were analyzed by X-ray photoelectron spectroscopy (XPS, Physical Electronics Quantum 2000, Al Kα X-ray source). The XPS data were acquired at takeoff angles of 45°. The IGOR software (Wavemetrics, Lake Oswego, OR) was further used for curve fitting and quantitative chemical analysis. The spectrum including Ca2p and P2p were calibrated to the adventitious C1s peak (284.6 eV). The XPS peaks with multiple components were resolved by Gaussian peak shapes. For curve fitting procedure, the Ca2p peak from each face are fitted by using a peak width of 1.8 eV and a separation width of 3.6 eV.36 The P2p peak from each face are fitted by using a P2p3/2/P2p1/2 doublet with spin–orbit splitting (Δ = 0.87 eV, intensity ratio = 0.5).37

3. Results

3.1. Analysis of pristine and FN pre-adsorbed single crystalline rutile

The representative Raman spectra of bare (001), (100) and (110) faces, as well as two main vibration modes graphically inserted, were illustrated. As shown in Fig. 2, Eg vibration mode indicates a clear intensity order of IEg(110) > IEg (100) > IEg (001), while IA1g(001) > IA1g (100) > IA1g (110) for A1g vibration mode, which corresponded well with the Raman polarization effect and displayed the rutile crystals were well polished during surface preparation.
image file: c6ra04303h-f2.tif
Fig. 2 Raman spectra of (001) face, (100) face and (110) face, as shown in red color, blue color and green color, respectively.

Fig. 3 shows the surface morphologies of (001), (100) and (110) faces before and after polishing, as well as after FN adsorption after 2 hours. Due to the fine polishing process, different single rutile faces display nanometer scale scratches and endow the similar surface roughness of 2.03–2.49 nm, indicating flat and well-polished surfaces, as shown in Fig. 3(a–f). After 2 hours FN pre-adsorption, a morphological change on each face was found, indicating the presence of adsorbed protein layer, though the scratches were still visible. FN adsorption led to smoother surfaces as the surface roughness of three surfaces decreases to 0.77–1.1 nm. The adhesion force mapping of (001), (100) and (110) faces is shown in Fig. 3(g–l), which shows a significant changes in the adhesion force before and after FN adsorption. After FN pre-adsorption, more than two orders of magnitude increase was found in the adhesion of all single rutile faces.


image file: c6ra04303h-f3.tif
Fig. 3 Topographic AFM images of (001), (100) and (110) faces after fine polish (a–c) and subsequently after 2 hours FN adsorption (d–f). Adhesion force mapping of (001), (100) and (110) faces after fine polish (g–i) and after FN adsorption (j–l).

3.2. Morphological analysis of biomineralized single crystalline rutile

Fig. 4 illustrates biomineralization on each face after 1 week soaking. In process I, few HA crystals could be found on the center of each surface, which suggests the first week was the nucleation period during biomineralization. In comparison with (001) and (100) faces, less HA crystals with plate-like structures could be found on (110) face. Significant difference in HA growth on 3 faces was found in process II. All (001), (100) and (110) faces revealed a faster crystal growth than that of process I, while the rate of HA growth on (110) face was still the slowest. The HA crystals on (001) and (100) faces, as shown in Fig. 4(d and e), are spherical-like and the size of HA crystals on (001) face is 2.05 ± 0.28 μm, which is larger than that of (100) face, 1.70 ± 0.24 μm.
image file: c6ra04303h-f4.tif
Fig. 4 Scanning electron micrographs of (001), (100) and (110) faces by being soaked in process I (a–c) and II (d–f) for 1 week. Some individual captures of biomimetic HA crystals were also presented.

After prolonged soaking of the surfaces for 4 weeks, in process I, morphologies of (001), (100) and (110) faces were basically similar, as shown in Fig. 5. High-magnification SEM images reveal the particle agglomerates obtain lath-like structures, a typical morphology for biomimetic HA crystals.38 The sizes of particle agglomerates on each face were similar; 4.42 ± 0.41 μm, 4.33 ± 0.49 μm and 4.24 ± 0.51 μm for (001), (100) and (110) face, respectively. The sizes of HA particles, forming from process II, on (001), (100) and (110) faces are 6.94 ± 0.61 μm, 6.66 ± 0.53 μm and 5.92 ± 0.66 μm, which are larger than that from process I.


image file: c6ra04303h-f5.tif
Fig. 5 Scanning electron micrographs of (001), (100) and (110) faces by being soaked in process I (a–c) and II (d–f) for 4 weeks. High magnification images were inserted inside.

3.3. Chemical structures of biomineralized single crystalline rutile

As shown in Fig. 6 the single rutile surfaces, being soaked in process I or II, are composed of homogeneous calcium and phosphate distribution, which indicates the good conversion from bare surface to HA layer formation after 4 weeks biomineralization. The detailed variations of Ca/P ratios in process II are also presented in Fig. 6. The Ca/P molar ratios were calculated as 1.63 ± 0.07, 1.66 ± 0.06 and 1.68 ± 0.06, for (001), (100) and (110) face after 1 week being soaked in SBF. However, after 4 weeks being soaked in SBF, the Ca/P molar ratio decreased and exhibited values of 1.51 ± 0.05, 1.52 ± 0.04 and 1.53 ± 0.05, respectively for (001), (100) and (110) face. In case of process I, due to very few crystal growth could be detected after 1 week, Ca/P molar ratio was collected after 4 weeks, exhibiting values of 1.51 ± 0.05, 1.53 ± 0.05 and 1.52 ± 0.05, for (001), (100) and (110) face. The above findings revealed the Ca/P ratios, after 4 weeks, were below than stoichiometric HA (Ca/P ratio of 1.67) and stabilized in both processes.
image file: c6ra04303h-f6.tif
Fig. 6 EDX mapping of biomineralization on (001), (100) and (110) faces by being soaked in process I and II for 4 weeks. Detailed molar ratio of Ca/P of biomineralized surfaces by being soaked (a) in process II for 1 week and 4 weeks, respectively (b) in process I for 4 weeks were statistically calculated from series of spots.

XPS survey spectra shown in Fig. 7 identified the main constituents of all single rutile surfaces are calcium, phosphorus and oxygen. The absence of titanium peaks is indicative of well-formed HA layer on each face. As a complementary technique to EDX, Ca/P ratios at the outmost surfaces were also investigated by XPS in process I, after 4 weeks biomineralization. Calcium (Ca 2p3/2) and phosphorus (P 2p3/2) peaks were found centered at 346.2 eV (001), 346.2 eV (100) and 346.4 eV (110). Though the presence of nitrogen hardly could be identified by full survey spectra, the high resolution spectra indicated the presence of FN on the surfaces. The Ca/P ratios calculated from overall coverage are 1.49 (001), 1.40 (100) and 1.45 (110), apparently lower than nominal ratio of 1.67. XRD analysis of all 4 weeks samples indicated nanocrystalline HA formation on all 3 faces in the two processes.


image file: c6ra04303h-f7.tif
Fig. 7 XPS full survey spectra of (001), (100) and (110) faces and high resolution spectra of calcium, phosphorus and nitrogen by being soaked in process I for 4 weeks.

Fig. 8 shows the XRD pattern of the biomineralized (110) face verified the HA formation, by displaying reflections of (002), (211), (310), (222) and (213), as typical peaks for HA (JCPDS, card no. 9-432).


image file: c6ra04303h-f8.tif
Fig. 8 XRD pattern of (110) face by being soaked in process II for 4 weeks.

4. Discussion

4.1. The surface bioactivity of single crystalline rutile

The bioactivity of rutile is due to its ability to adsorb and dissociate water, creating Ti–OH groups and a negative surface charge.39 Uchida et al. did not report all Ti–OH groups, but certain types of Ti–OH in a specific structural arrangement are effective in inducing apatite nucleation. The key is how well structurally matched the interface between the hydroxylated surface and HA crystal, and also its surface charge.40 Bioactivity of crystalline materials is normally due to a better lattice match with HA, a higher acidity and lower surface ζ-potential.41 In order to design a better bioactive crystalline material, the effect of different crystal faces on biomineralization should be studied. Our previous studies have reported the effect of crystal faces of rutile on HA formation in SBF.15,16 However, proteins will also affect the biomineralization process and to investigate the interaction between surface bioactivity and protein adsorption on single crystalline rutile FN was selected. Main reason for using FN as a single model is because of its high affinity to HA.42

Worth noting is that in the case of polycrystalline titanium oxide, the effect of protein in SBF has been profoundly studied, showing a pre-adsorbed protein layer does not delay the recrystallization rate. However, both albumin and fibrinogen existing in solution were proven to be delaying the crystal growth.43 In contrast to that study,43 where rough titania coatings was used as model surfaces, the single rutile crystals used in this study averagely obtain a surface roughness around 2.03–2.49 nm, as revealed by AFM measurements. Though it was suggested that the surface roughness of titanium films has little effects on protein adsorption,44 the well-defined surfaces would undoubtedly establish a comparable platform when aiming of unraveling the biomineralization dynamics in different crystalline directions. Besides, in single crystalline rutile,45 A1g mode, asymmetric bending of O–Ti–O bonds by oxygen atoms, and Eg mode, symmetric stretching of O–Ti–O bonds, were seen as the finger-print Raman scattering signals with Raman shift at 466 cm−1 and 615 cm−1, respectively. Anisotropic Raman scattering of crystals was mainly determined by the crystallographic structure and could be utilized to distinguish crystal facets.

4.2. The model of HA growth on single crystalline rutile

An earlier work revealed the apatite-inducing ability of a titanium oxide layer links to its surface energy and the nucleation is easier on a surface with a higher surface energy.46 Moreover, Tang et al. demonstrated the importance of interfacial energies in biomineralization, showing in solution the biological growth modifiers could delay the crystal growth by altering mineral surface energies.47 Therefore, by correlating the biomineralization dynamics to interfacial energies, the complex interaction between solid surface bioactivity and protein adsorption could indeed be simplified.

AFM was originally invented for topographic imaging48 but now has evolved into a diversified tool, especially in biomedicine.49–51 Very recently, the innovative emergence of peak force quantitative nano-mechanical mapping (PF-QNM) gives opportunities to investigate the surface mechanical properties quantitatively, based on the force-separation feedback loop.52–54 To be noted, the adhesion force denotes the adhesion between the AFM tip and the substrate surface,55 which corresponds to the surface free energy of the substrate surface (single rutile in this study). As shown in Fig. 9, the adhesion force, peak force, elastic modulus and the energy dissipation could be extracted in real time. The adhesion force between the tip and the specimen is determined by the difference between the base force (zero force) and the minimum force.56 According to Derjaguin–Muller–Toporov (DMT) model, the adhesion force can be expressed as:

 
Fad = 2π (1)
 
Γ = 2(γsample × γtip)1/2 (2)


image file: c6ra04303h-f9.tif
Fig. 9 Illustration of the force volume curve in a cycle of peak force AFM.

Eqn (1) and (2) indicate the correlation between adhesion force and interfacial energy of single crystalline rutile. Where R is the tip radius, Γ is the interfacial energy between the tip and the specimen surface, γsample and γtip refer to the surface energies of the specimen and the tip, respectively.57 Since the AFM tip used in the study is composed of silicon, the surface energy of the tip is taken as 1240 mJ m−2.58 According to eqn (1) and (2), the surface energies of rutile (001), (100) and (110) surfaces after FN adsorption are calculated in Fig. 10.


image file: c6ra04303h-f10.tif
Fig. 10 Surface energies with standard deviations of (001), (100), (110) faces before (a) and after (b) FN adsorption.

The bare rutile surfaces obtained similar surface energies (0.42 ± 0.01 mJ m−2, 0.38 ± 0.01 mJ m−2 and 0.34 ± 0.01 mJ m−2 for (001), (100) and (110) faces, respectively). Striking feature was found after FN adsorption, showing that the newly obtained surface energy gives more than two orders of magnitude enhancement in all faces (247 ± 9.8 mJ m−2, 226 ± 6.8 mJ m−2 and 101 ± 2.3 mJ m−2 for (001), (100) and (110) faces, respectively) and followed the sequence as γ(001)γ(100) > γ(110). Nucleation is normally the first step of the formation of biomineralization on surface.59 In general, nucleation represents an activation energy barrier to the spontaneous formation of a solid phase from a supersaturated solution.60,61 With respect to thermodynamic analysis, heterogeneous nucleation occurs on the surface by overcoming the energy barrier of nucleation and, thus, can be summarized and expressed by the classical Gibbs free energy equation:62

 
image file: c6ra04303h-t1.tif(3)

Assuming ΓHR is the interfacial energy between HA and single rutile, which can be calculated by the surface energies of single rutile and HA: ΓHR = 2(γHA × γsingle rutile)1/2. V is the volume growth units, k is the Boltzmann constant, T is the absolute temperature and σ is the supersaturation of the solution. When the energy exceeds the barrier, Gibbs free energy would drop and the crystal initiates to grow. Based on the growth dynamics, the HA growth rate J is given by:

 
image file: c6ra04303h-t2.tif(4)

According to eqn (3) and (4), it is feasible to demonstrate the relationship between the surface energy of single rutile and HA nucleation as well as later growth. First, higher surface energy could significantly increase the interfacial energy between single rutile surface and the emerging HA nucleus so as to declines the barrier height of HA nucleation, resulting in a larger quantity of clusters would later become nucleation centers. Second, once the nucleation centers are established, the HA crystal growth rate is as well promoted due to the increased interfacial energy.

In contrast to process I, process II started with FN pre-adsorbed surfaces that gave more than two orders of magnitude enhancement in surface energies (shown in Fig. 10), leading to a significant interfacial energy increase. At the first time point of process II, the overall biomineralization displayed much larger coverage of HA crystals than that of process I, as shown in Fig. 4. Moreover, the individual observation of each face basically corresponded with the measured surface energies. In process I, bare single rutile surfaces showed similar but relatively low surfaces energies of 0.34–0.42 mJ m−2. SEM images revealed very few biominerals on all faces. However, at the first time point of process II, FN pre-adsorbed (001) and (100) surfaces had a ∼600-fold increase in surfaces energies, while for (110) surface a 300-fold increase of the surface energy was measured. This agrees well with our SEM observations, showing that both (001) and (100) faces display larger coverage of HA crystals than (110) face. Our previous study has also showed, in PBS solution, adsorption of calcium and phosphate ions was faster on the (001) and (100) surfaces than on the (110) surface.16

4.3. Composition of the biomineralized surfaces

Another phenomenon emphatically addressed is the Ca/P ratio on each surface during biomineralization, which represent the changes of bioactive surfaces during in vitro exposures. EDX is a powerful tool to quantify and track HA growth.63–65 Element mapping and spot analysis were employed to display the composition of calcium phosphate compounds and variation of Ca/P ratios. In process II, the Ca/P ratios decreased from 1 week to 4 weeks soaking in SBF, in all faces. The close Ca/P ratios after 4 weeks revealed the stabilization for biomimetic HA growth in both processes. These results indicated the pre-adsorption of FN could facilitate HA formation on single crystalline rutile, as well influence the crystallinity of HA formed on the surfaces. Furthermore, FN adsorbed on surfaces could affect the early formation of HA, but not the later stage when the surfaces were covered by newly formed HA. Without ion substitutions, calcium deficient HA with better crystallinity normally has higher Ca/P. That is one of the reasons the Ca/P decreased after 4 weeks' soaking. The values from EDX and XPS displayed FN in SBF nucleate a form of calcium deficient HA on single crystalline rutile surfaces, which are in good agreement with the theory proposed by Olszta et al.66 and some recent findings on biomineralization in vitro.43,65,67

It has been proved that the promotion of cell spreading on FN adsorbed surface was highly correlated with an increase in the oxide's negative net charge.68 Furthermore, it has been shown that cells will bind to adsorbed FN but not to soluble FN.69 The significance of the present study is to quantitatively compare the interfacial energies towards surface bioactivities. One preliminary advantage from quantitatively probing the solid–liquid interfacial energies is the aid of the design for novel interface biomaterials, since normally the controlled surface parameters in modulating protein adsorption or cell behavior are insufficient. Besides, the use of protein to test surface bioactivity for implant materials can be broadened, and may not be limited to the solid surfaces.

5. Conclusions

Biomineralization of single crystalline rutile with (001), (100) and (110) faces can be controlled by involving FN on surfaces or in solutions. Pre-adsorption FN could help biomineralization. FN existing in biomineralization medium did not inhibit HA formation, but showed a slower HA formation. The quantitative evidence on surface energies was further provided to unravel an accelerating role of surface pre-adsorbed FN on subsequent biomimetic HA growth, by comparing with a process with the presence of FN in SBF. This conclusion corresponds well the latter morphological observations, showing that (100) and (100) faces had a lager coverage of HA crystals than that of (110) face. Therefore, in order to increase the surface bioactivity of crystalline materials in a biomimetic system, a pre-adsorbed biological modifier could be a promising strategy.

Acknowledgements

We gratefully acknowledge the support from China Scholarship Council (CSC).

References

  1. H. Petite, V. Viateau, W. Bensaïd, A. Meunier, C. de Pollak, M. Bourguignon, K. Oudina, L. Sedel and G. Guillemin, Nat. Biotechnol., 2000, 18, 959–963 CrossRef CAS PubMed.
  2. J. F. Kay, T. S. Golec and R. L. Riley, J. Prosthet. Dent., 1987, 58, 339–343 CrossRef CAS PubMed.
  3. N. M. Alves, I. B. Leonor, H. S. Azevedo, R. L. Reis and J. F. Mano, J. Mater. Chem., 2010, 20, 2911 RSC.
  4. B. D. Boyan, T. W. Hummert, D. D. Dean and Z. Schwartz, Biomaterials, 1996, 17, 137–146 CrossRef CAS PubMed.
  5. T. Albrektsson, P. I. Brånemark, H. A. Hansson, B. Kasemo, K. Larsson, I. Lundström, D. H. McQueen and R. Skalak, Ann. Biomed. Eng., 1983, 11, 1–27 CrossRef CAS.
  6. W. Xia, C. Lindahl, J. Lausmaa, and H. Engqvist, Biomimetic Hydroxyapatite Deposition on Titanium Oxide Surfaces for Biomedical Application, 2011 Search PubMed.
  7. W. Zhou, X. Zhong, X. Wu, L. Yuan, Q. Shu, Y. Xia and K. Ostrikov, J. Biomed. Mater. Res., Part A, 2007, 81, 453–464 CrossRef PubMed.
  8. K. Lee, M. Kim and H. Kim, J. Mater. Chem., 2010, 20, 3791 RSC.
  9. S. Liu, J. Yu and M. Jaroniec, Chem. Mater., 2011, 23, 4085–4093 CrossRef CAS.
  10. P. Li, I. Kangasniemi, K. de Groot and T. Kokubo, J. Am. Ceram. Soc., 1994, 77, 1307–1312 CrossRef CAS.
  11. P. Li, C. Ohtsuki, T. Kokubo, K. Nakanishi, N. Soga and K. De Groot, J. Biomed. Mater. Res., 1994, 28, 7–15 CrossRef CAS PubMed.
  12. T. Ohno, K. Sarukawa and M. Matsumura, New J. Chem., 2002, 26, 1167–1170 RSC.
  13. M. Xu, Y. Gao, E. M. Moreno, M. Kunst, M. Muhler, Y. Wang, H. Idriss and C. Wöll, Phys. Rev. Lett., 2011, 106, 138302 CrossRef PubMed.
  14. J. B. Lowekamp, G. S. Rohrer, P. a. M. Hotsenpiller, J. D. Bolt and W. E. Farneth, J. Phys. Chem. B, 1998, 102, 7323–7327 CrossRef CAS.
  15. F. Lindberg, J. Heinrichs, F. Ericson, P. Thomsen and H. Engqvist, Biomaterials, 2008, 29, 3317–3323 CrossRef CAS PubMed.
  16. C. Lindahl, P. Borchardt, J. Lausmaa, W. Xia and H. Engqvist, J. Mater. Sci.: Mater. Med., 2010, 21, 2743–2749 CrossRef CAS PubMed.
  17. B. Kasemo and J. Lausmaa, The International Journal of Oral & Maxillofacial Implants, 1988, 3, 247–259 CAS.
  18. J. Breme, C. J. Kirkpatrick, and R. Thull, Metallic Biomaterial Interfaces, Wiley-VCH Verlag GmbH & Co. KGaA, Weinheim, Germany, 2008 Search PubMed.
  19. A. Agnihotri and C. A. Siedlecki, Langmuir, 2004, 20, 8846–8852 CrossRef CAS PubMed.
  20. H. Chen, L. Yuan, W. Song, Z. Wu and D. Li, Prog. Polym. Sci., 2008, 33, 1059–1087 CrossRef CAS.
  21. P. Ducheyne and Q. Qiu, Biomaterials, 1999, 20, 2287–2303 CrossRef CAS PubMed.
  22. Y. Cai, F. Edin, Z. Jin, A. Alexsson, O. Gudjonsson, W. Liu, H. Rask-Andersen, M. Karlsson and H. Li, Acta Biomater., 2015, 31, 211–220 CrossRef PubMed.
  23. S. Mann, D. D. Archibald, J. M. Didymus, T. Douglas, B. R. Heywood, F. C. Meldrum and N. J. Reeves, Science, 1993, 261, 1286–1292 CAS.
  24. C. J. Wilson, R. E. Clegg, D. I. Leavesley and M. J. Pearcy, J. Tissue Eng., 2005, 11, 1–18 CrossRef CAS PubMed.
  25. R. Pankov and K. M. Yamada, J. Cell Sci., 2002, 115, 3861–3863 CrossRef CAS PubMed.
  26. R. O. Hynes and K. M. Yamada, J. Cell Biol., 1982, 95, 369–377 CrossRef CAS PubMed.
  27. R. E. Weiss and A. H. Reddi, Proc. Natl. Acad. Sci. U. S. A., 1980, 77, 2074–2078 CrossRef CAS.
  28. C. D. Tidwell, S. I. Ertel, B. D. Ratner, B. J. Tarasevich, S. Atre and D. L. Allara, Langmuir, 1997, 13, 3404–3413 CrossRef CAS.
  29. T. Matsuura, R. Hosokawa, K. Okamoto, T. Kimoto and Y. Akagawa, Biomaterials, 2000, 21, 1121–1127 CrossRef CAS PubMed.
  30. D. Couchourel, C. Escoffier, R. Rohanizadeh, S. Bohic, G. Daculsi, Y. Fortun and M. Padrines, J. Inorg. Biochem., 1999, 73, 129–136 CrossRef CAS PubMed.
  31. S. R. Sousa, P. Moradas-Ferreira and M. A. Barbosa, J. Mater. Sci.: Mater. Med., 2005, 16, 1173–1178 CrossRef CAS PubMed.
  32. T. Kokubo, H. Kushitani, S. Sakka, T. Kitsugi and T. Yamamuro, J. Biomed. Mater. Res., 1990, 24, 721–734 CrossRef CAS PubMed.
  33. J. Drelich, G. W. Tormoen and E. R. Beach, J. Colloid Interface Sci., 2004, 280, 484–497 CrossRef CAS PubMed.
  34. D. L. Sedin and K. L. Rowlen, Anal. Chem., 2000, 72(10), 2183–2189 CrossRef CAS PubMed.
  35. S. Das, D. Lahiri, D. Y. Lee, A. Agarwal and W. Choi, Carbon, 2013, 59, 121–129 CrossRef CAS.
  36. C. Arnould, C. Volcke, C. Lamarque, P. A. Thiry, J. Delhalle and Z. Mekhalif, J. Colloid Interface Sci., 2009, 336, 497–503 CrossRef CAS PubMed.
  37. I. Zafiropoulou, K. Papagelis, N. Boukos, A. Siokou, D. Niarchos and V. Tzitzios, J. Phys. Chem. C, 2010, 114, 7582–7585 CAS.
  38. J. Ryu, S. H. Ku, H. Lee and C. B. Park, Adv. Funct. Mater., 2010, 20, 2132–2139 CrossRef CAS.
  39. M. Lindgren, M. Åstrand, U. Wiklund and H. Engqvist, J. Mater. Sci.: Mater. Med., 2009, 20, 1401–1408 CrossRef CAS PubMed.
  40. M. Uchida, H.-M. Kim, T. Kokubo, S. Fujibayashi and T. Nakamura, J. Biomed. Mater. Res., Part A, 2003, 64, 164–170 CrossRef PubMed.
  41. C. Mao, H. Li, F. Cui, C. Ma and Q. Feng, J. Cryst. Growth, 1999, 206, 308–321 CrossRef CAS.
  42. N. Horada, K. Tajima, H. Takeuchi, Y. Doi, Y. Moriwaki, T. Fujii, K. Shibuya, S. Kito and R. Abe, Nippon Shishubyo Gakkai Kaishi, 1986, 28, 125–130 CrossRef CAS PubMed.
  43. S. Areva, T. Peltola, E. Säilynoja, K. Laajalehto, M. Lindén and J. B. Rosenholm, Chem. Mater., 2002, 14, 1614–1621 CrossRef CAS.
  44. K. Cai, J. Bossert and K. D. Jandt, Colloids Surf., B, 2006, 49, 136–144 CrossRef CAS PubMed.
  45. J. Yan, G. Wu, N. Guan, L. Li, Z. Li and X. Cao, Phys. Chem. Chem. Phys., 2013, 15, 10978–10988 RSC.
  46. X. J. Wang, Y. C. Li, J. G. Lin, P. D. Hodgson and C. E. Wen, J. Mater. Res., 2008, 23, 1682–1688 CrossRef CAS.
  47. R. Tang, M. Darragh, C. A. Orme, X. Guan, J. R. Hoyer and G. H. Nancollas, Angew. Chem., Int. Ed., 2005, 44, 3698–3702 CrossRef CAS PubMed.
  48. G. Binnig, C. F. Quate and C. Gerber, Phys. Rev. Lett., 1986, 56, 930–933 CrossRef PubMed.
  49. M. Plodinec, M. Loparic, C. A. Monnier, E. C. Obermann, R. Zanetti-Dallenbach, P. Oertle, J. T. Hyotyla, U. Aebi, M. Bentires-Alj, R. Y. H. Lim and C.-A. Schoenenberger, Nat. Nanotechnol., 2012, 7, 757–765 CrossRef CAS PubMed.
  50. G. Yeroslavsky, O. Girshevitz, J. Foster-Frey, D. M. Donovan and S. Rahimipour, Langmuir, 2015, 31, 1064–1073 CrossRef CAS PubMed.
  51. O. Krivosheeva, M. Sababi, A. Dedinaite and P. M. Claesson, Langmuir, 2013, 29, 9551–9561 CrossRef CAS PubMed.
  52. O. Sahin, S. Magonov, C. Su, C. F. Quate and O. Solgaard, Nat. Nanotechnol., 2007, 2, 507–514 CrossRef PubMed.
  53. M. E. Dokukin and I. Sokolov, Langmuir, 2012, 28, 16060–16071 CrossRef CAS PubMed.
  54. E. T. Herruzo, A. P. Perrino and R. Garcia, Nat. Commun., 2014, 5, 3126 Search PubMed.
  55. U. Landman, W. D. Luedtke, N. a. Burnham and R. J. Colton, Science, 1990, 248, 454–461 CAS.
  56. F. Zhang, M. Sababi, T. Brinck, D. Persson, J. Pan and P. M. Claesson, J. Colloid Interface Sci., 2013, 404, 62–71 CrossRef CAS PubMed.
  57. M. F. Yu, T. Kowalewski and R. S. Ruoff, Phys. Rev. Lett., 2001, 86, 87–90 CrossRef CAS PubMed.
  58. J. J. Gilman, J. Appl. Phys., 1960, 31, 2208–2218 CrossRef CAS.
  59. H. Jiang and X. Y. Liu, J. Biol. Chem., 2004, 279, 41286–41293 CrossRef CAS PubMed.
  60. S. Mann, D. D. Archibald, J. M. Didymus, T. Douglas, B. R. Heywood, F. C. Meldrum and N. J. Reeves, Science, 1993, 261, 1286–1292 CAS.
  61. S. Mann and G. a Ozin, Nature, 1996, 382, 313–318 CrossRef CAS.
  62. P. Zhu, Y. Masuda and K. Koumoto, Biomaterials, 2004, 25, 3915–3921 CrossRef CAS PubMed.
  63. C. Capuccini, P. Torricelli, F. Sima, E. Boanini, C. Ristoscu, B. Bracci, G. Socol, M. Fini, I. N. Mihailescu and A. Bigi, Acta Biomater., 2008, 4, 1885–1893 CrossRef CAS PubMed.
  64. K. S. Vecchio, X. Zhang, J. B. Massie, M. Wang and C. W. Kim, Acta Biomater., 2007, 3, 910–918 CrossRef CAS PubMed.
  65. X. Li, J. Lan, M. Ai, Y. Guo, Q. Cai and X. Yang, Colloids Surf., B, 2014, 123, 753–761 CrossRef CAS PubMed.
  66. M. J. Olszta, X. Cheng, S. S. Jee, R. Kumar, Y. Y. Kim, M. J. Kaufman, E. P. Douglas and L. B. Gower, Mater. Sci. Eng., R, 2007, 58, 77–116 CrossRef.
  67. X. Ba, M. Rafailovich, Y. Meng, N. Pernodet, S. Wirick, H. Füredi-Milhofer, Y. X. Qin and E. DiMasi, J. Struct. Biol., 2010, 170, 83–92 CrossRef CAS PubMed.
  68. B. E. Rapuano and D. E. MacDonald, Colloids Surf., B, 2011, 82, 95–103 CrossRef CAS PubMed.
  69. F. Grinnell, Ann. N. Y. Acad. Sci., 1987, 516, 280–290 CrossRef CAS PubMed.

Footnote

These authors contributed equally to this work.

This journal is © The Royal Society of Chemistry 2016