Synthesis of CuO/ZnO/Al2O3/ZrO2/CeO2 nanocatalysts via homogeneous precipitation and combustion methods used in methanol steam reforming for fuel cell grade hydrogen production†
Saeed Khajeh Talkhonchehab,
Mohammad Haghighi*ab,
Shahab Minaeiab,
Hossein Ajameinab and
Mozaffar Abdollahifarab
aChemical Engineering Faculty, Sahand University of Technology, P.O. Box 51335-1996, Sahand New Town, Tabriz, Iran
bReactor and Catalysis Research Center (RCRC), Sahand University of Technology, P.O. Box 51335-1996, Sahand New Town, Tabriz, Iran. E-mail: haghighi@sut.ac.ir; Web: http://rcrc.sut.ac.ir Fax: +98-41-33444355; Tel: +98-41-33458096 Tel: +98-41-33459152
First published on 6th June 2016
Abstract
Homogeneous precipitation and urea-nitrate combustion methods have been comparatively investigated for the synthesis of CeO2 promoted CuO/ZnO/Al2O3/ZrO2 nanocatalysts. The catalytic performance of the samples was studied in the methanol steam reforming process for fuel cell grade hydrogen production. The physicochemical properties of the prepared nanocatalysts were characterized by XRD, FESEM, PSD, EDX, BET and FTIR analysis. XRD analysis shows that the homogeneous precipitation method and CeO2 addition improves the dispersion and decreases the relative crystallinity of CuO and ZnO species. FESEM images illustrate that the homogeneous precipitation method is more capable of the synthesis of smaller particles than the urea-nitrate combustion method. Addition of ceria to the fabricated catalysts decreases the particle size and enhances surface homogeneity. EDX analysis demonstrates that Cu and Zn elements are homogeneously dispersed on the catalyst surface, which is synthesized by a homogeneous precipitation method. The catalytic performance demonstrates that applying the homogeneous precipitation method improves activity while the ceria addition leads to lower CO selectivity.
1 Introduction
In recent years, fuel cells have been nominated as a promising alternative to the internal combustion engine, though hydrogen supply as their feed is not solved yet.1,2 Hydrogen can be produced from a variety of feedstocks such as methane, methanol, ethanol, etc.3–5 However, it should be noted that the application of fuel cells in vehicles forces us to produce on board hydrogen. Among various alternatives, methanol due to its advantages such as high H/C ratio, no C–C bonds and low operation temperature is most attractive.6–10 Hydrogen can be produced via a methanol feed through four catalytic pathways:11,12• Methanol decomposition.
• Steam reforming of methanol.
• Partial oxidation of methanol.
• Oxidative steam reforming of methanol.
Among these methods, steam reforming of methanol (SRM) with high hydrogen yield and low CO production is more desirable.13,14 Catalysts for this process are divided into two groups; copper based catalysts and group VIII metals.15–17 Copper based catalysts are the most appropriate catalysts for the steam reforming of methanol reaction as they are more active and selective for hydrogen.18,19
In order to improve the activity and reducibility of copper based catalysts, most investigations have focused on employing an appropriate promoter and synthesis method.20–22 ZnO is known as the most desirable promoter for enhancing the reducibility and dispersion of Cu species.23,24 Al2O3 as a structural promoter has a positive effect on the reactivity of the CuO/ZnO catalysts.14,25 It was added to the catalysts to increase the surface area, mechanical resistance and thermal stability.8,26 However, alumina at high loading has a negative effect on the activity and hinders the reforming reaction.8,27 In addition, other promoters such as CeO2 and ZrO2 have been interestingly studied due to their positive influence on the methanol steam reforming process.22 The improvement in activity, stability and dispersion of CuO and ZnO, as well as reduction in CO selectivity, are some of the significant promoting effects of CeO2.8,22 Furthermore, CeO2 prevents reducibility of the SRM catalyst.8 ZrO2 is introduced as a reducing agent in the active phase and improves the dispersion of active sites. It can also diminish CO yield and delay catalyst deactivation.8,26–29
In addition to promoter effects, the physicochemical properties of the catalyst employed in each process can be affected by the synthesis method.30–32 Conventionally, precipitation and impregnation are known as common methods for the synthesis of copper based catalysts. Much research has been performed to compare these methods with other novel fabrication pathways.21 One of the new techniques that has been recently applied in catalyst synthesis is the urea-nitrate combustion (UNC) method. Unlike conventional precipitation and impregnation methodologies, the UNC method is fast and simple due to the elimination of some time-consuming steps such as washing, filtering and drying.33 This method has two agents; an oxidizing agent such as nitrate and sulfate salts and an organic fuel such as glycine, citric acid or urea. Rapid and facile synthesis as well as producing a homogeneous powder from cheap precursors are the advantages of the UNC method.34–36 On the other hand, some work has focused on improving the conventional precipitation method by altering the original pathway. The homogeneous precipitation (HP) method is known to be an effective synthesis method for the production of highly dispersed active sites. Also, previous results have shown that a high degree of crystallinity can be achieved using this method.37,38 Comparing the homogeneous precipitation method with the co-precipitation method shows that nanocatalysts synthesized using the homogeneous precipitation method are more active because of its highly dispersion and smaller particles of active phases.37
Although so much work has been performed to characterize catalysts fabricated by the homogeneous precipitation and urea-nitrate combustion methods individually, there is little research that compares these methods. Therefore, the aim of this paper is to compare the characteristic and catalytic properties of CuO/ZnO/Al2O3/ZrO2 nanocatalysts synthesized by urea-nitrate combustion and homogeneous precipitation methods. Moreover, the fabricated catalysts were promoted by ceria (10% wt) to investigate its influence on the characterization of the prepared nanocatalysts. The characteristics of the fabricated catalysts were evaluated by XRD, FESEM, PSD, EDX, BET and FTIR analysis. The catalytic performance of CuO/ZnO/Al2O3/ZrO2 (CZAZ) and CuO/ZnO/Al2O3/ZrO2/CeO2 (CZAZC) nanocatalysts were studied in a fixed bed reactor through the methanol steam reforming reaction.
2 Materials and methods
2.1 Materials
Nitrate solutions used as nanocatalyst precursors were obtained by mixing Cu(NO3)2·3H2O, Zn(NO3)2·3H2O, Zr(NO3)4·5H2O and Ce(NO3)3·6H2O which were supplied by Merck Company, Germany. Aluminium hydroxide and Al(NO3)3·9H2O were used as alumina precursors in the UNC and HP method, respectively. These precursors, as well as urea as a precipitant in the HP method and fuel in the UNC method were supplied by Merck Company, Germany. Distilled water was used for nanocatalyst preparation stages. All of the reagents were used as received without further purification.2.2 Nanocatalyst preparation and procedures
To investigate the effect of preparation method on the synthesis of CeO2 promoted CuO/ZnO/Al2O3/ZrO2 nanocatalysts, two samples with different compositions were synthesized via urea-nitrate combustion (UNC) and homogeneous precipitation (HP) methods. In this paper, CuO/ZnO/Al2O3/ZrO2 and CuO/ZnO/Al2O3/ZrO2/CeO2 nanocatalysts are named CZAZ and CZAZC, respectively. UNC and HP after the name of the catalysts refers to urea-nitrate combustion and homogeneous precipitation, respectively.In the UNC method (Fig. 1s in the ESI†), an aqueous solution of Cu, Zn, Zr and Ce nitrate was made to the desired composition. Aluminium hydroxide (Al(OH)3) was heated under an air flow at 400 °C for 4 h to produce boehmite (AlOOH) as an Al precursor. In the next step, the nitrate solution of precursors, boehmite and urea as the combustion fuel were mixed for 45 min. The urea/nitrate ratio was determined as 3. The resulting solution was heated at 80 °C to evaporate excess water and form a viscous gel. The gel was put in a muffle furnace where it started to boil and froth at 400 °C and form a black powder. Finally, the resulting powder was calcined at 350 °C for 4 h under an air flow.
In the HP method (Fig. 2s in the ESI†), an aqueous solution of Cu, Zn, Zr, Ce and Al nitrate precursors was mixed with urea (urea/nitrate = 20:1 molar ratio). The urea was hydrolysed by heating the mixture to 90 °C for 24 h to release the precipitant agent (hydroxide ions). The precipitate was washed with deionized water and dried under an air flow at 80 °C for 24 h. The samples were calcined at 350 °C for 5 h. Finally, the prepared nanocatalysts from both methods were shaped for catalytic performance studies toward methanol steam reforming.
2.3 Nanocatalysts characterization techniques
X-ray diffraction (XRD) measurements were used to study the crystal structure of the synthesised nanocatalysts. They was carried out using a D5000 Siemens X-ray diffractometer with a Cu Kα radiation source (0.154056 nm) which was operated at 30 kV and 40 mA. The resulting patterns were compared with the Joint Committee on Powder Diffraction Standards (JCPDS) to identify the crystallite phases of metal oxides. Moreover, the crystallite size was calculated using the Scherrer equation as follows:where τ is the mean size of the ordered crystallite. K, λ and θ are the shape factor, X-ray wavelength and Bragg angle, respectively. β is known as the line broadening at half the maximum intensity (FWHM), after subtracting the instrumental line broadening. Furthermore, for more statistical analysis of XRD patterns the relative crystallinity was calculated by the selection of a single peak of the specific material. The highest intensity of the selected peak was assumed to be 100% of relative crystallinity and the others which surely had lower intensity were calculated compared to the basis value.
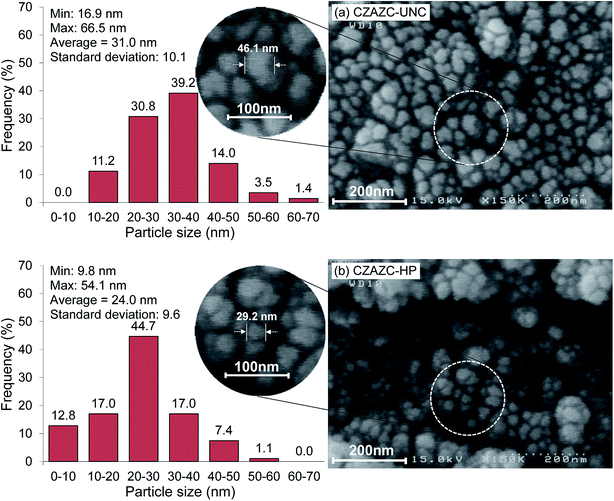
The surface morphology of CZAZ and CZAZC nanocatalysts were studied using a field emission scanning electron microscope (FESEM, HITACHI S-4160). Before each test for more accurate images, the samples were coated with an ultrathin layer of gold to increase the conductivity of the surface. The particle size distribution histograms were depicted by ImageJ software by analysing the FESEM images. EDX and dot mapping were conducted for surface elemental analysis (VEGA II, TESCAN). Specific surface area measurements were investigated by nitrogen adsorption at 77 K and desorption at room temperature using a Quantachrome ChemBET 3000 analyser. Before each measurement, the samples were degassed at 200 °C for 30 min. The FTIR spectra were acquired for surface functional groups by means of a Unicam 4000 FTIR spectrometer, using a KBr plate in the range of 400–4000 cm−1.
2.4 Experimental setup for catalytic performance test
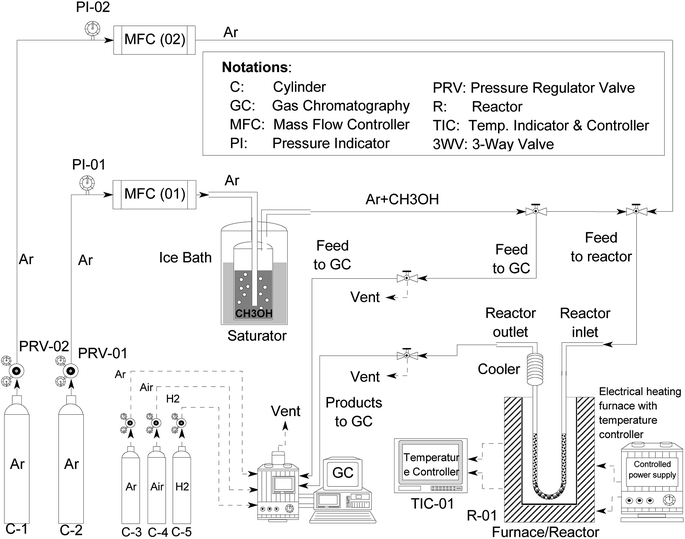
A schematic flowchart of the experimental setup for catalytic performance test toward the methanol steam reforming reaction is illustrated in Fig. 1. The setup consists of a gas feeding section, a fixed bed reactor and an analytical section. A methanol and water mixture was fed into the reactor by argon stream through a saturator. The flow rate of this stream was 70 mL min−1 which was controlled by a mass flow controller. The H2O/MeOH ratio was considered as 1.5 in the feed stream. The steam reforming of methanol reaction was carried out in a U-shape Pyrex tube packed bed reactor (ID = 8 mm and length = 32 cm) with 0.4 g of nanocatalyst loading. The heat of the reaction was provided by placing the reactor inside an electrical furnace equipped with an electronic temperature controller. Prior to the catalytic and stability tests, the nanocatalyst was reduced under a stream of hydrogen with a flow rate of 100 mL min−1 at 300 °C under atmospheric pressure for 3 h. Experiments were carried out over a temperature range of 200–300 °C to evaluate catalytic performance at atmospheric pressure. The gas hourly space velocity (GHSV) was set at 10![[thin space (1/6-em)]](https://www.rsc.org/images/entities/char_2009.gif) 000 cm3 gcat−1 h−1 as the literature reports that this is the most efficient.39–41 An on-line gas chromatograph (GC Chrom, Teif Gostar Faraz, Iran) equipped with a Plot-U Column (Agilent Technologies) as well as TCD and FID detectors was used to analyse reactor products. Argon was used as the carrier gas in the GC column.
000 cm3 gcat−1 h−1 as the literature reports that this is the most efficient.39–41 An on-line gas chromatograph (GC Chrom, Teif Gostar Faraz, Iran) equipped with a Plot-U Column (Agilent Technologies) as well as TCD and FID detectors was used to analyse reactor products. Argon was used as the carrier gas in the GC column.
 | ||
| Fig. 1 Experimental setup for activity test of CuO/ZnO/Al2O3/ZrO2 and CuO/ZnO/Al2O3/ZrO2/CeO2 nanocatalysts used in hydrogen production via methanol steam reforming. | ||
The conversion of methanol and selectivity of the products are defined as follows:
 | (1) |
 | (2) |
 | (3) |
 | (4) |
3 Results and discussion
3.1 Nanocatalyst characterization
 | ||
| Fig. 2 XRD patterns of the synthesised nanocatalysts: (a) CZAZ–UNC, (b) CZAZ–HP, (c) CZAZC–UNC and (d) CZAZC–HP. | ||
| Nanocatalyst | Synthesis method | Cu (%) | Zn (%) | Al (%) | Zr (%) | Ce (%) | BET (m2 g−1) | Relative crystallinitya | Crystallite sizeb (nm) | ||||||||
|---|---|---|---|---|---|---|---|---|---|---|---|---|---|---|---|---|---|
| CuO | ZnO | Al2O3 | ZrO2 | CeO2 | CuOc | ZnOd | Al2O3e | ZrO2f | CeO2g | ||||||||
| a Relative crystallinity: XRD relative peak intensity.b Crystallite size estimated by Scherrer’s equation.c Crystallite phase: monoclinic (JCPDS: 01-080-1268, 2θ = 35.5, 35.6, 38.8, 38.9, 48.8, 61.6, 68.2).d Crystallite phase: hexagonal (JCPDS: 01-076-0704, 2θ = 31.7, 34.4, 36.2, 47.5, 56.5, 62.8, 67.9, 69.0).e Crystallite phase: cubic (JCPDS: 00-004-0880, 2θ = 37.4, 39.7, 42.8, 45.8, 67.3).f Crystallite phase: cubic (JCPDS: 01-080-0784, 2θ = 30.2, 34.6, 35.3, 43.0, 50.3, 50.7, 53.9, 59.4, 60.2).g Crystallite phase: cubic (JCPDS: 01-075-0076, 2θ = 28.8, 33.2, 47.7, 56.6, 59.4, 69.8, 77.1, 79.5, 88.9). | |||||||||||||||||
| CZAZ–UNC | Combustion | 40 | 30 | 10 | 20 | 0 | 26.0 | 100 | 100 | 0 | 98.9 | — | 15.6 | 15.9 | — | 9.8 | — |
| CZAZ–HP | Precipitation | 40 | 30 | 10 | 20 | 0 | 132.9 | 34.2 | 0.0 | 0 | 11.2 | — | 8.4 | — | — | — | — |
| CZAZC–UNC | Combustion | 30 | 30 | 10 | 20 | 10 | 26.7 | 55.4 | 88.2 | 0 | 100 | 100 | 16.5 | 17.2 | — | 8.7 | 30.7 |
| CZAZC–HP | Precipitation | 30 | 30 | 10 | 20 | 10 | 149.9 | 10.9 | 11.8 | 0 | 0.0 | 50.0 | — | — | — | — | — |
 | ||
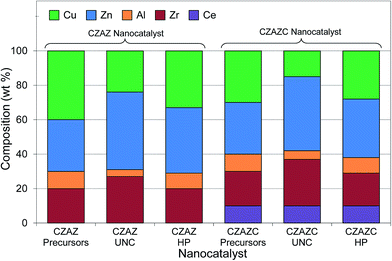
| Fig. 5 EDX analysis of synthesised nanocatalysts: (a) CZAZ–UNC, (b) CZAZ–HP, (c) CZAZC–UNC and (d) CZAZC–HP. | ||
3.2 Catalytic performance study toward methanol steam reforming
 | ||
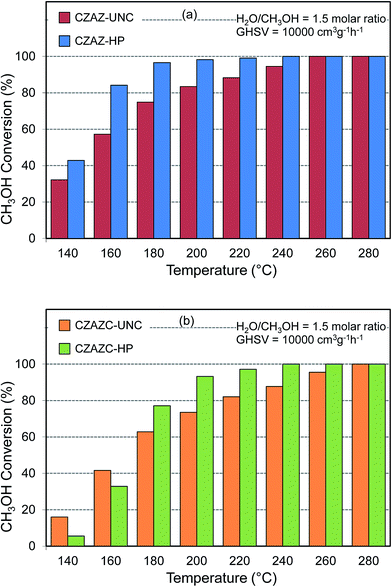
| Fig. 8 Influence of synthesis method and CeO2 addition on methanol conversion over synthesised nanocatalysts: (a) CZAZ–UNC vs. CZAZ–HP and (b) CZAZC–UNC vs. CZAZC–HP. | ||
| Sample | Synthesis method | Composition (wt%) | T (°C) | Methanol conversion | Reference |
|---|---|---|---|---|---|
| CuO/ZnO/ZrO2/Al2O3 | Co-precipitation | 30/30/30/10 | 270 | 92.4 | 8 |
| CuO/ZnO/CeO2/ZrO2/Al2O3 | Co-precipitation | 30/30/9/27/10 | 270 | 89.4 | 8 |
| CuO/ZnO/ZrO2/Al2O3 | Co-precipitation | 30/40/20/10 | 270 | 80 | 57 |
| CuO/ZnO/CeO2/ZrO2 | Co-precipitation | 45/20/17.5/17.5 | 260 | 100 | 56 |
| CuO/ZnO/ZrO2/Al2O3 | Impregnation | 15/15/10/60 | 270 | 70 | 27 |
| CuO/ZnO/CeO2/Al2O3 | Impregnation | 10/10/40/40 | 350 | 96 | 58 |
| CuO/ZnO/CeO2/ZrO2/Al2O3 | Homogeneous precipitation | 30/30/10/20/10 | 240 | 100 | Present study |
| CuO/ZnO/CeO2/ZrO2/Al2O3 | Urea-nitrates combustion | 30/30/10/20/10 | 280 | 100 | Present study |
| CuO/ZnO/ZrO2/Al2O3 | Homogeneous precipitation | 40/30/20/10 | 220 | 100 | Present study |
| CuO/ZnO/ZrO2/Al2O3 | Urea-nitrates combustion | 40/30/20/10 | 260 | 100 | Present study |
On the other hand, it can be understood that addition of ceria had no significant influence on enhancing methanol conversion while in some cases it partially decreased the conversion values. Some reasons can account for this behaviour of ceria in CZAZ nanocatalysts. As mentioned in previous work, CeO2 improves methanol conversion8 by ameliorating the dispersions of CuO and ZnO in the nanocatalysts, but the steam methanol reforming reaction was clearly weakened as CeO2 was doped. The interactions between CeO2 and Al2O3 have a negative effect on CeO2 and ZnO interaction as an effective parameter in the steam methanol reforming reaction.8 Therefore, the methanol conversion values of the CZAZC nanocatalysts are lower than the CZAZ samples due to the negative effect of ceria on ZnO as an effective parameter on methanol conversion. On the other hand, the interaction between ceria and zirconia can have an influence on the good interaction between CuO and ZnO as the main active phases of the SRM reaction to decrease methanol conversion.56
4 Conclusions
The effects of preparation method and promoter addition on the physicochemical and catalytic properties of CuO–ZnO–Al2O3–ZrO2 (CZAZ) nanocatalysts were studied. XRD patterns show that the homogeneous precipitation method improves Cu dispersion compared to the urea-nitrate combustion method. FESEM analysis indicates that HP-nanocatalysts have more homogeneous and smaller particles than UNC-nanocatalysts. EDX dot mapping analysis shows a good dispersion of Cu and Zn elements on the HP-nanocatalysts. FTIR analysis depicts that metal oxides were formed during both the preparation methods and no unwanted functional groups were found on the synthesized nanocatalysts. Catalytic performance tests demonstrate that the HP-nanocatalysts, due to their characteristic advantages, gave low CO selectivity and high methanol conversion. Moreover, CeO2 addition decreases CO selectivity and modifies Cu dispersion, however, CeO2 affects the interaction between ZnO and CuO, and reduces methanol conversion.Acknowledgements
The authors gratefully acknowledge Sahand University of Technology for financial support of the research as well as the Iran Nanotechnology Initiative Council for complementary financial support.References
- P. Biswas and D. Kunzru, Chem. Eng. J., 2008, 136, 41–49 CrossRef CAS.
- K.-l. Chiu, F.-l. Kwong and D. H. L. Ng, Curr. Appl. Phys., 2012, 12, 1195–1198 CrossRef.
- S. M. Sajjadi, M. Haghighi, A. Alizadeh Eslami and F. Rahmani, J. Sol-Gel Sci. Technol., 2013, 67, 601–617 CrossRef CAS.
- M. Saket Oskoui, M. Khatamian, M. Haghighi and A. Yavari, RSC Adv., 2014, 4, 19569–19577 RSC.
- S. M. Sajjadi, M. Haghighi and F. Rahmani, J. Sol-Gel Sci. Technol., 2014, 70, 111–124 CrossRef CAS.
- D. Swierczynski, C. Courson and A. Kiennemann, Chem. Eng. Process., 2008, 47, 508–513 CrossRef CAS.
- H. Lorenz, W. Jochum, B. Klötzer, M. Stöger-Pollach, S. Schwarz, K. Pfaller and S. Penner, Appl. Catal., A, 2008, 347, 34–42 CrossRef CAS.
- G. Huang, B.-J. Liaw, C.-J. Jhang and Y.-Z. Chen, Appl. Catal., A, 2009, 358, 7–12 CrossRef CAS.
- H.-M. Yang and M.-K. Chan, Catal. Commun., 2011, 12, 1389–1395 CrossRef CAS.
- M. Yang, S. Li and G. Chen, Appl. Catal., B, 2011, 101, 409–416 CrossRef CAS.
- M. Turco, G. Bagnasco, C. Cammarano, P. Senese, U. Costantino and M. Sisani, Appl. Catal., B, 2007, 77, 46–57 CrossRef CAS.
- Á. Mastalir, Á. Patzkó, B. Frank, R. Schomäcker, T. Ressler and R. Schlögl, Catal. Commun., 2007, 8, 1684–1690 CrossRef.
- J. Baneshi, M. Haghighi, N. Jodeiri, M. Abdollahifar and H. Ajamein, Energy Convers. Manage., 2014, 87, 928–937 CrossRef CAS.
- R. Shokrani, M. Haghighi, N. Jodeiri, H. Ajamein and M. Abdollahifar, Int. J. Hydrogen Energy, 2014, 39, 13141–13155 CrossRef CAS.
- S. Sá, H. Silva, L. Brandão, J. M. Sousa and A. Mendes, Appl. Catal., B, 2010, 99, 43–57 CrossRef.
- N. Takezawa and N. Iwasa, Catal. Today, 1997, 36, 45–56 CrossRef CAS.
- Y. Men and M. Yang, Catal. Commun., 2012, 22, 68–73 CrossRef CAS.
- J. Papavasiliou, G. Avgouropoulos and T. Ioannides, Appl. Catal., B, 2009, 88, 490–496 CrossRef CAS.
- N. Takezawa, H. Kobayashi, A. Hirose, M. Shimokawabe and K. Takahashi, Appl. Catal., 1982, 4, 127–134 CrossRef CAS.
- H. Agarás, G. Cerrella and M. A. Laborde, Appl. Catal., 1988, 45, 53–60 CrossRef.
- J.-P. Shen and C. Song, Catal. Today, 2002, 77, 89–98 CrossRef CAS.
- X. Zhang and P. Shi, J. Mol. Catal. A: Chem., 2003, 194, 99–105 CrossRef CAS.
- Y. Nitta, O. Suwata, Y. Ikeda, Y. Okamoto and T. Imanaka, Catal. Lett., 1994, 26, 345–354 CrossRef CAS.
- F. Raimondi, B. Schnyder, R. Kötz, R. Schelldorfer, T. Jung, J. Wambach and A. Wokaun, Surf. Sci., 2003, 532–535, 383–389 CrossRef CAS.
- J. Baneshi, M. Haghighi, N. Jodeiri, M. Abdollahifar and H. Ajamein, Ceram. Int., 2014, 400, 14177–14184 CrossRef.
- P. H. Matter, D. J. Braden and U. S. Ozkan, J. Catal., 2004, 223, 340–351 CrossRef CAS.
- S. D. Jones and H. E. Hagelin-Weaver, Appl. Catal., B, 2009, 90, 195–204 CrossRef CAS.
- H. Jeong, K. I. Kim, T. H. Kim, C. H. Ko, H. C. Park and I. K. Song, J. Power Sources, 2006, 159, 1296–1299 CrossRef CAS.
- X. R. Zhang, P. Shi, J. Zhao, M. Zhao and C. Liu, Fuel Process. Technol., 2003, 83, 183–192 CrossRef CAS.
- Z. Abbasi, M. Haghighi, E. Fatehifar and N. Rahemi, Asia-Pac. J. Chem. Eng., 2012, 7, 868–876 CrossRef CAS.
- N. Rahemi, M. Haghighi, A. A. Babaluo, M. Fallah Jafari and P. Estifaee, Plasma Chem. Plasma Process., 2013, 33, 663–680 CrossRef CAS.
- R. Khoshbin and M. Haghighi, Chem. Eng. Res. Des., 2013, 91, 1111–1122 CrossRef CAS.
- H. Ajamein and M. Haghighi, Energy Convers. Manage., 2016, 118, 231–242 CrossRef CAS.
- A. Kumar, A. S. Mukasyan and E. E. Wolf, Appl. Catal., A, 2010, 372, 175–183 CrossRef CAS.
- A. Civera, M. Pavese, G. Saracco and V. Specchia, Catal. Today, 2003, 83, 199–211 CrossRef CAS.
- J. Papavasiliou, G. Avgouropoulos and T. Ioannides, Catal. Commun., 2004, 5, 231–235 CrossRef CAS.
- T. Shishido, Y. Yamamoto, H. Morioka, K. Takaki and K. Takehira, Appl. Catal., A, 2004, 263, 249–253 CrossRef CAS.
- T. Shishido, Y. Yamamoto, H. Morioka and K. Takehira, J. Mol. Catal. A: Chem., 2007, 268, 185–194 CrossRef CAS.
- C. Fukuhara and H. Ohkura, Appl. Catal., A, 2008, 344, 158–164 CrossRef CAS.
- S. Monyanon, A. Luengnaruemitchai and S. Pongstabodee, Fuel Process. Technol., 2012, 96, 160–168 CrossRef CAS.
- J. E. Park, S.-D. Yim, C. S. Kim and E. D. Park, Int. J. Hydrogen Energy, 2014, 39, 11517–11527 CrossRef CAS.
- J. Papavasiliou, G. Avgouropoulos and T. Ioannides, Catal. Commun., 2005, 6, 497–501 CrossRef CAS.
- C.-M. Hung, Powder Technol., 2009, 196, 56–61 CrossRef CAS.
- Y. C. Lee, C. S. Yang, H. J. Huang, S. Y. Hu, J. W. Lee and C. F. Cheng, J. Lumin., 2010, 130, 1756–1759 CrossRef CAS.
- M. Charghand, M. Haghighi and S. Aghamohammadi, Ultrason. Sonochem., 2014, 21, 1827–1838 CrossRef CAS PubMed.
- N. Asgari, M. Haghighi and S. Shafiei, Environ. Prog. Sustainable Energy, 2013, 32, 587–597 CrossRef CAS.
- M. Abdollahifar, M. Haghighi, A. A. Babaluo and S. Khajeh Talkhoncheh, Ultrason. Sonochem., 2016, 31, 173–183 CrossRef CAS PubMed.
- L. Yosefi, M. Haghighi, S. Allahyari, R. Shokrani and S. Ashkriz, Adv. Powder Technol., 2015, 26, 602–611 CrossRef CAS.
- S. R. Yahyavi, M. Haghighi, S. Shafiei, M. Abdollahifar and F. Rahmani, Energy Convers. Manage., 2015, 97, 273–281 CrossRef CAS.
- M. Sharifi, M. Haghighi and M. Abdollahifar, J. Nat. Gas Sci. Eng., 2015, 23, 547–558 CrossRef CAS.
- S. Sadeghi, M. Haghighi and P. Estifaee, J. Nat. Gas Sci. Eng., 2015, 24, 302–310 CrossRef CAS.
- S. Khajeh Talkhoncheh and M. Haghighi, J. Nat. Gas Sci. Eng., 2015, 23, 16–25 CrossRef CAS.
- S. Saedy, M. Haghighi and M. Amirkhosrow, Particuology, 2012, 10, 729–736 CrossRef CAS.
- F. Rahmani, M. Haghighi, Y. Vafaeian and P. Estifaee, J. Power Sources, 2014, 272, 816–827 CrossRef CAS.
- M. Sharifi, M. Haghighi and M. Abdollahifar, Mater. Res. Bull., 2014, 60, 328–340 CrossRef CAS.
- L. Zhang, L. Pan, C. Ni, T. Sun, S. Zhao, S. Wang, A. Wang and Y. Hu, Int. J. Hydrogen Energy, 2013, 38, 4397–4406 CrossRef CAS.
- C.-C. Chang, J.-W. Wang, C.-T. Chang, B.-J. Liaw and Y.-Z. Chen, Chem. Eng. J., 2012, 192, 350–356 CrossRef CAS.
- M. Mrad, D. Hammoud, C. Gennequin, A. Aboukaïs and E. Abi-Aad, Appl. Catal., A, 2014, 471, 84–90 CrossRef CAS.
Footnote |
| † Electronic supplementary information (ESI) available. See DOI: 10.1039/c6ra03858a |
| This journal is © The Royal Society of Chemistry 2016 |


